
The distribution of U.S. irrigated acreage has shifted eastward since mid-20th century
- by R. Aaron Hrozencik
- 1/4/2022
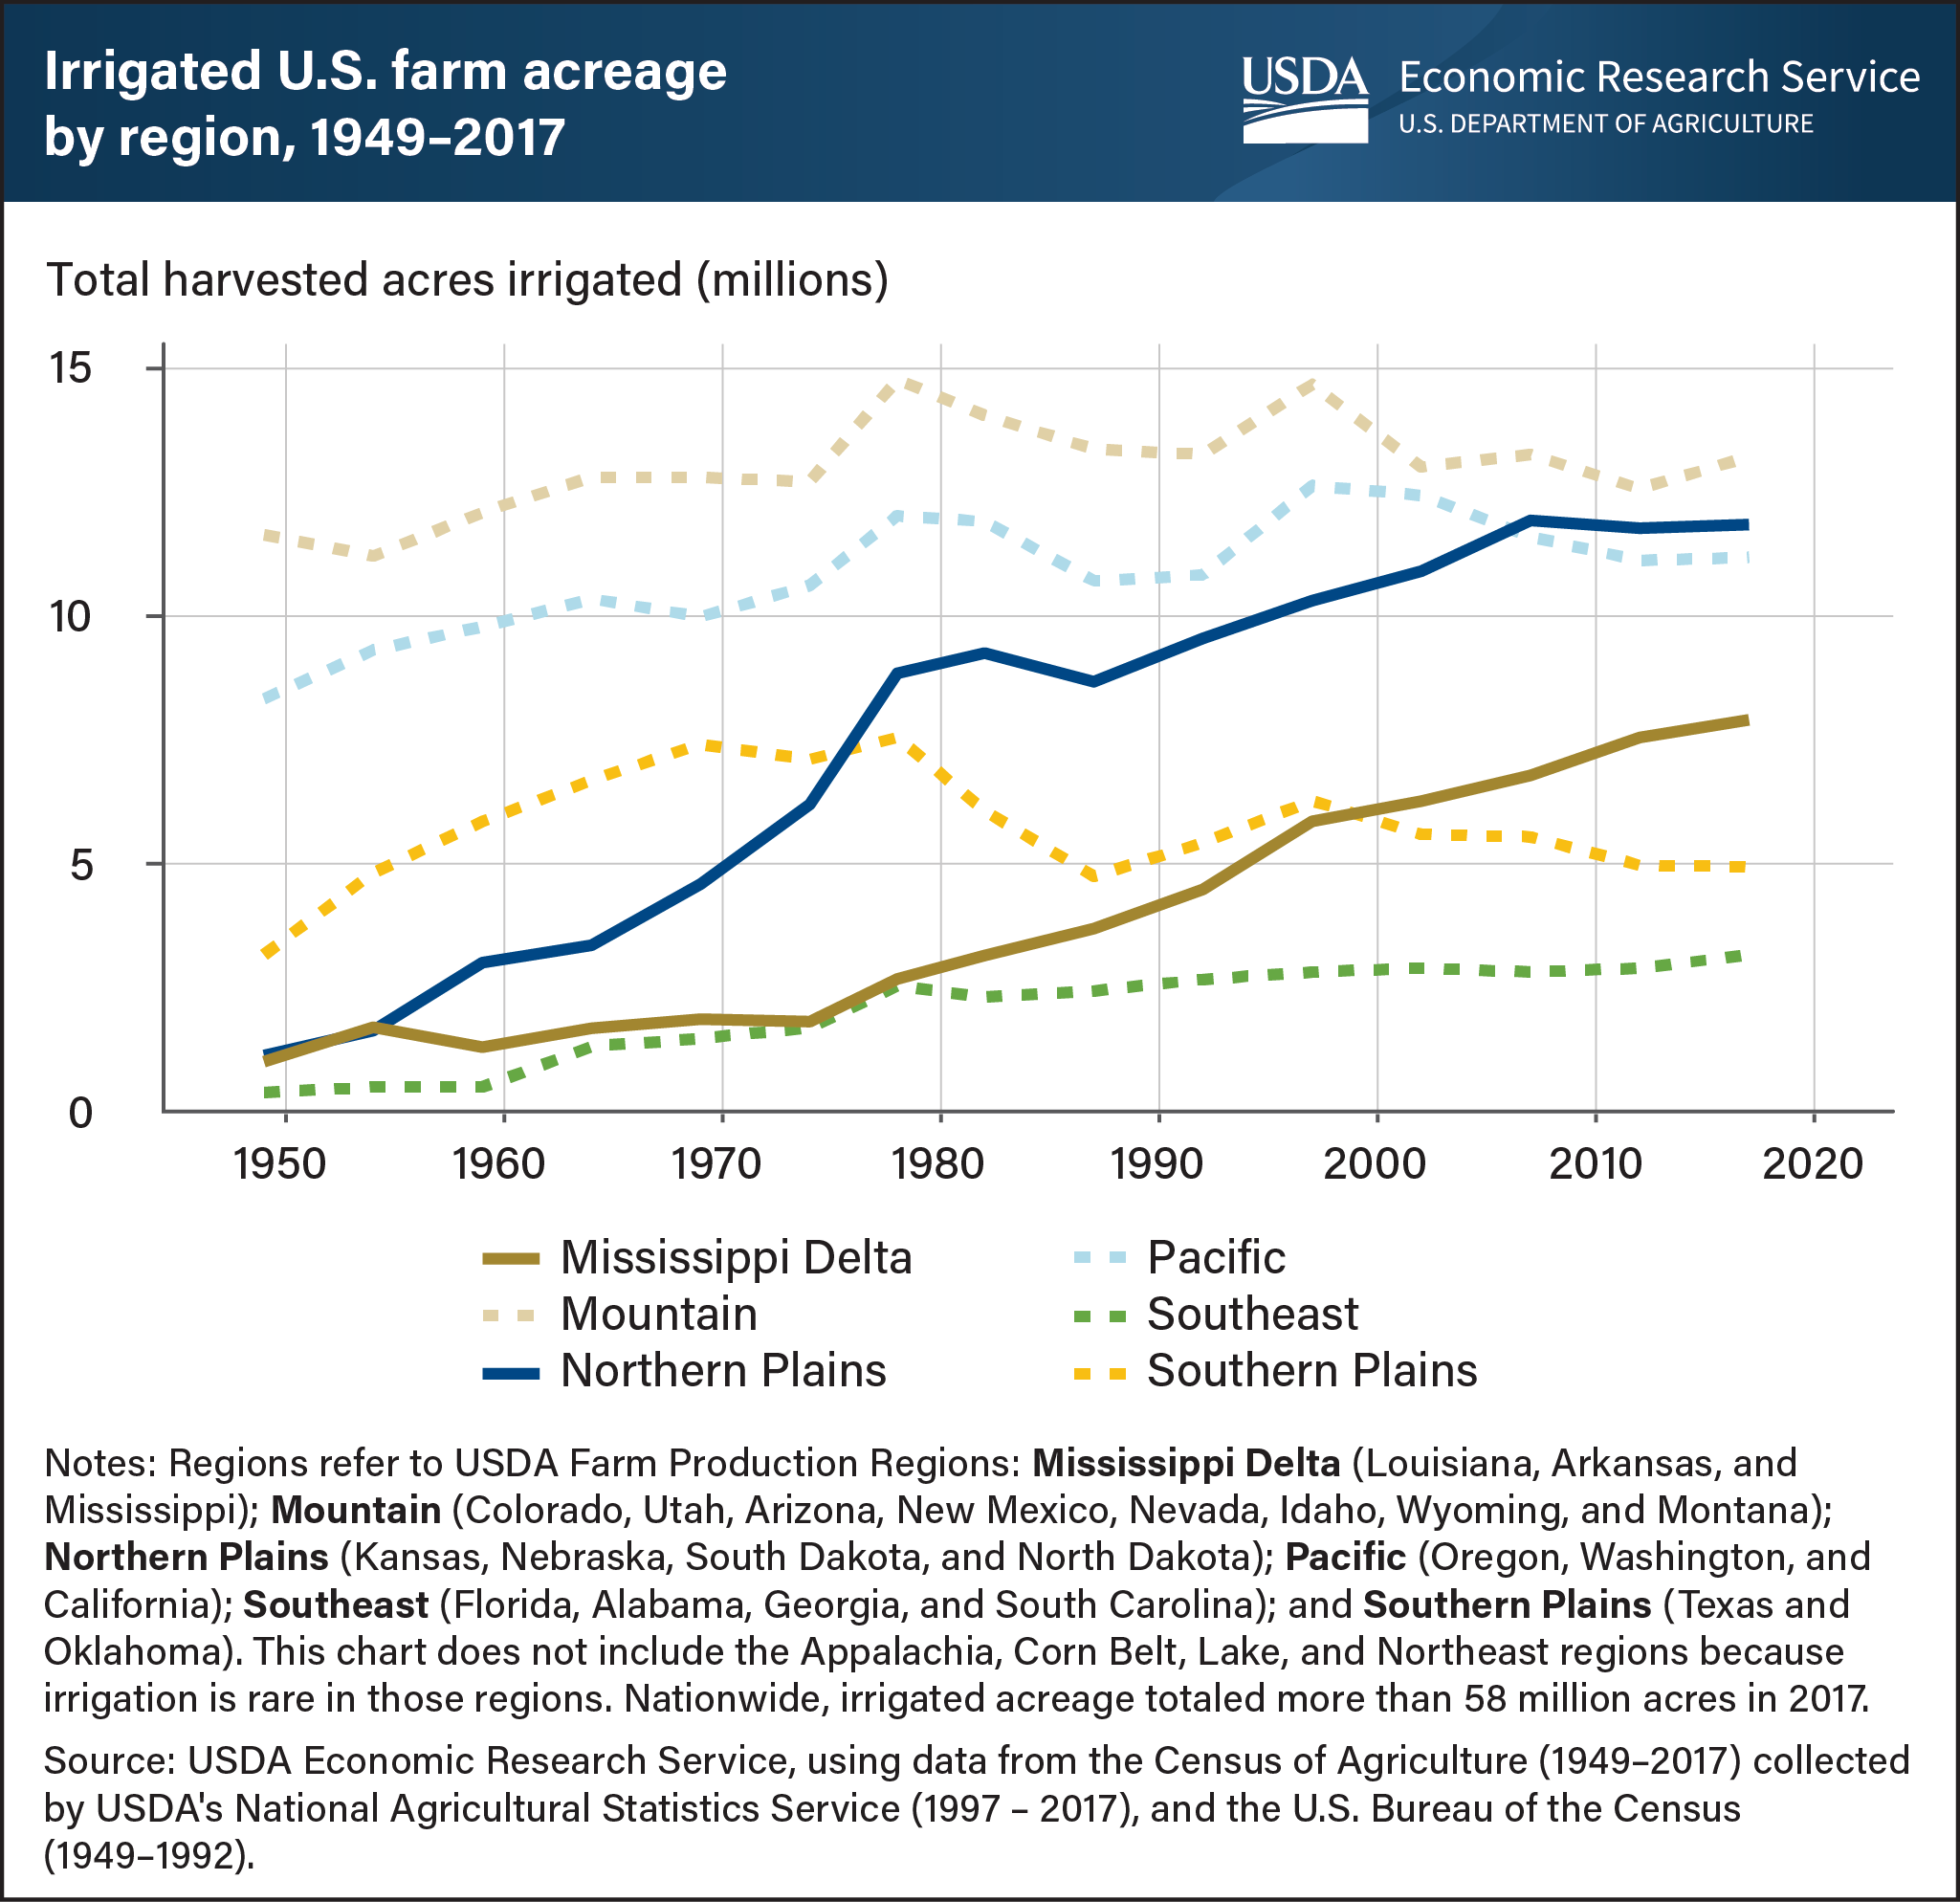
Regional distribution of U.S. irrigated acreage changed significantly from 1949 to 2017. Trends in irrigated cropping patterns, technological advances, water availability, and changing growing-season weather drove this evolution. The arid Mountain and Pacific regions consistently irrigated the most farmland until 2007, when irrigated acreage in the Northern Plains region surpassed acreage in the Pacific region. Irrigated acreage in the Mountain and Pacific regions remained relatively constant over the 70-year period, despite increasingly limited opportunities for additional water development and increasing competition for water from non-agricultural sectors. The Northern Plains region has experienced the most substantial increase in irrigated acreage, expanding from less than 2 million acres in 1949 to nearly 12 million acres in 2017. The expansion of irrigated acreage in the Northern Plains is related to advances in groundwater pumping technologies, the diffusion of center pivot irrigation application systems, and the region’s abundant aquifer resources. The Southern Plains region experienced similar growth in irrigation until the 1980s, when dwindling groundwater supplies resulted in irrigated acreage declines. The Mississippi Delta and Southeast regions also have expanded irrigated acreage since 1949 reflecting, in part, changing cropping patterns, abundant aquifer water supplies, and producer responsiveness to changing precipitation levels during growing seasons. This chart was drawn from the USDA, Economic Research Service report Trends in U.S. Irrigated Agriculture: Increasing Resilience Under Water Supply Scarcity, published December 2021.