
U.S. population subgroups see changes in food insecurity from 2019 to 2020 while overall rate remains the same
- by Alisha Coleman-Jensen
- 12/8/2021
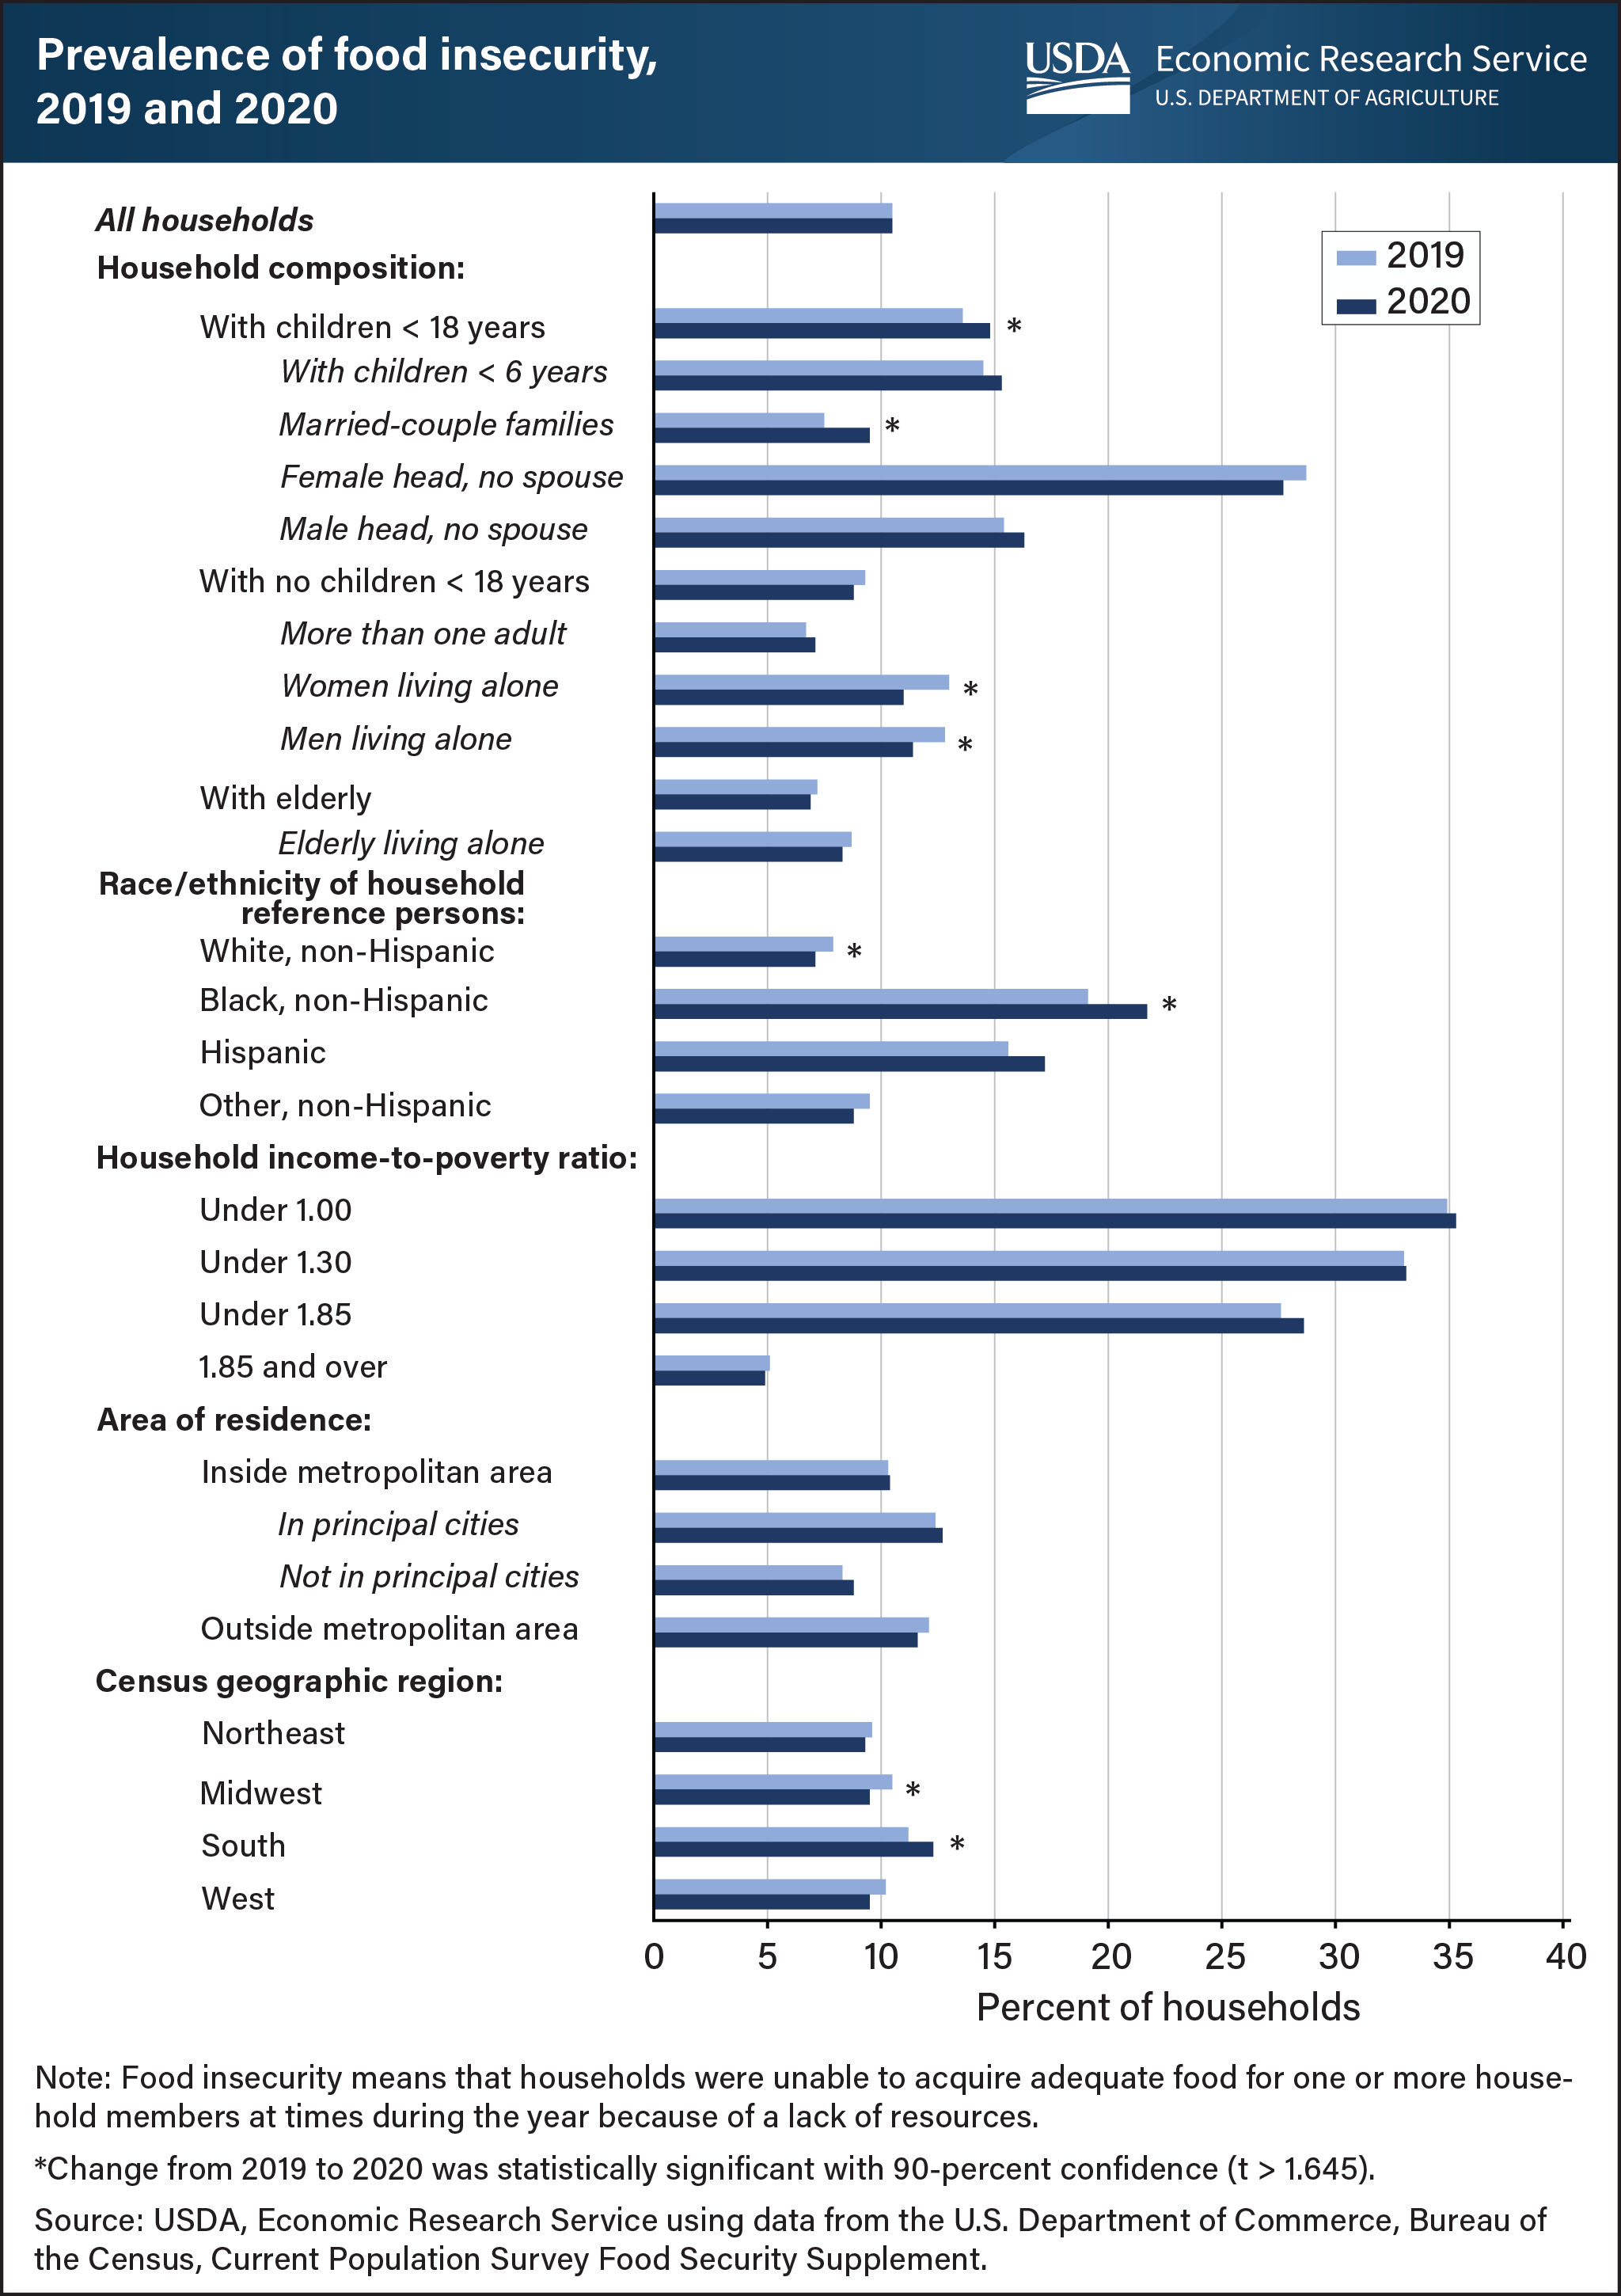
The USDA, Economic Research Service (ERS) monitors the incidence and severity of food insecurity in U.S. households annually. Food insecurity means that households were, at times, unable to acquire adequate food for one or more household members because of insufficient money and other resources. In 2020, the national prevalence of food insecurity was unchanged from 2019 at 10.5 percent. However, some population subgroups experienced changes in the prevalence of food insecurity from 2019 to 2020. For all households with children, the prevalence of food insecurity increased to 14.8 percent in 2020 from 13.6 percent in 2019. Households with Black, non-Hispanic reference persons (an adult household member in whose name the housing unit is owned or rented) saw an increase in the prevalence of food insecurity to 21.7 percent in 2020 from 19.1 percent in 2019. Married-couple families with children and households in the South also saw higher rates of food insecurity. However, a few population subgroups saw declines in the prevalence of food insecurity from 2019 to 2020, including women living alone; men living alone; households with White, non-Hispanic reference persons; and households in the Midwest. This chart appears in the ERS report, Household Food Security in the United States in 2020, released September 8, 2021.