
For 13 of the 15 main agricultural States, Chapter 12 bankruptcy rates in 2019 were higher than their 10-year averages
- by Nigel Key, Jonathan Law and Christine Whitt
- 11/30/2021
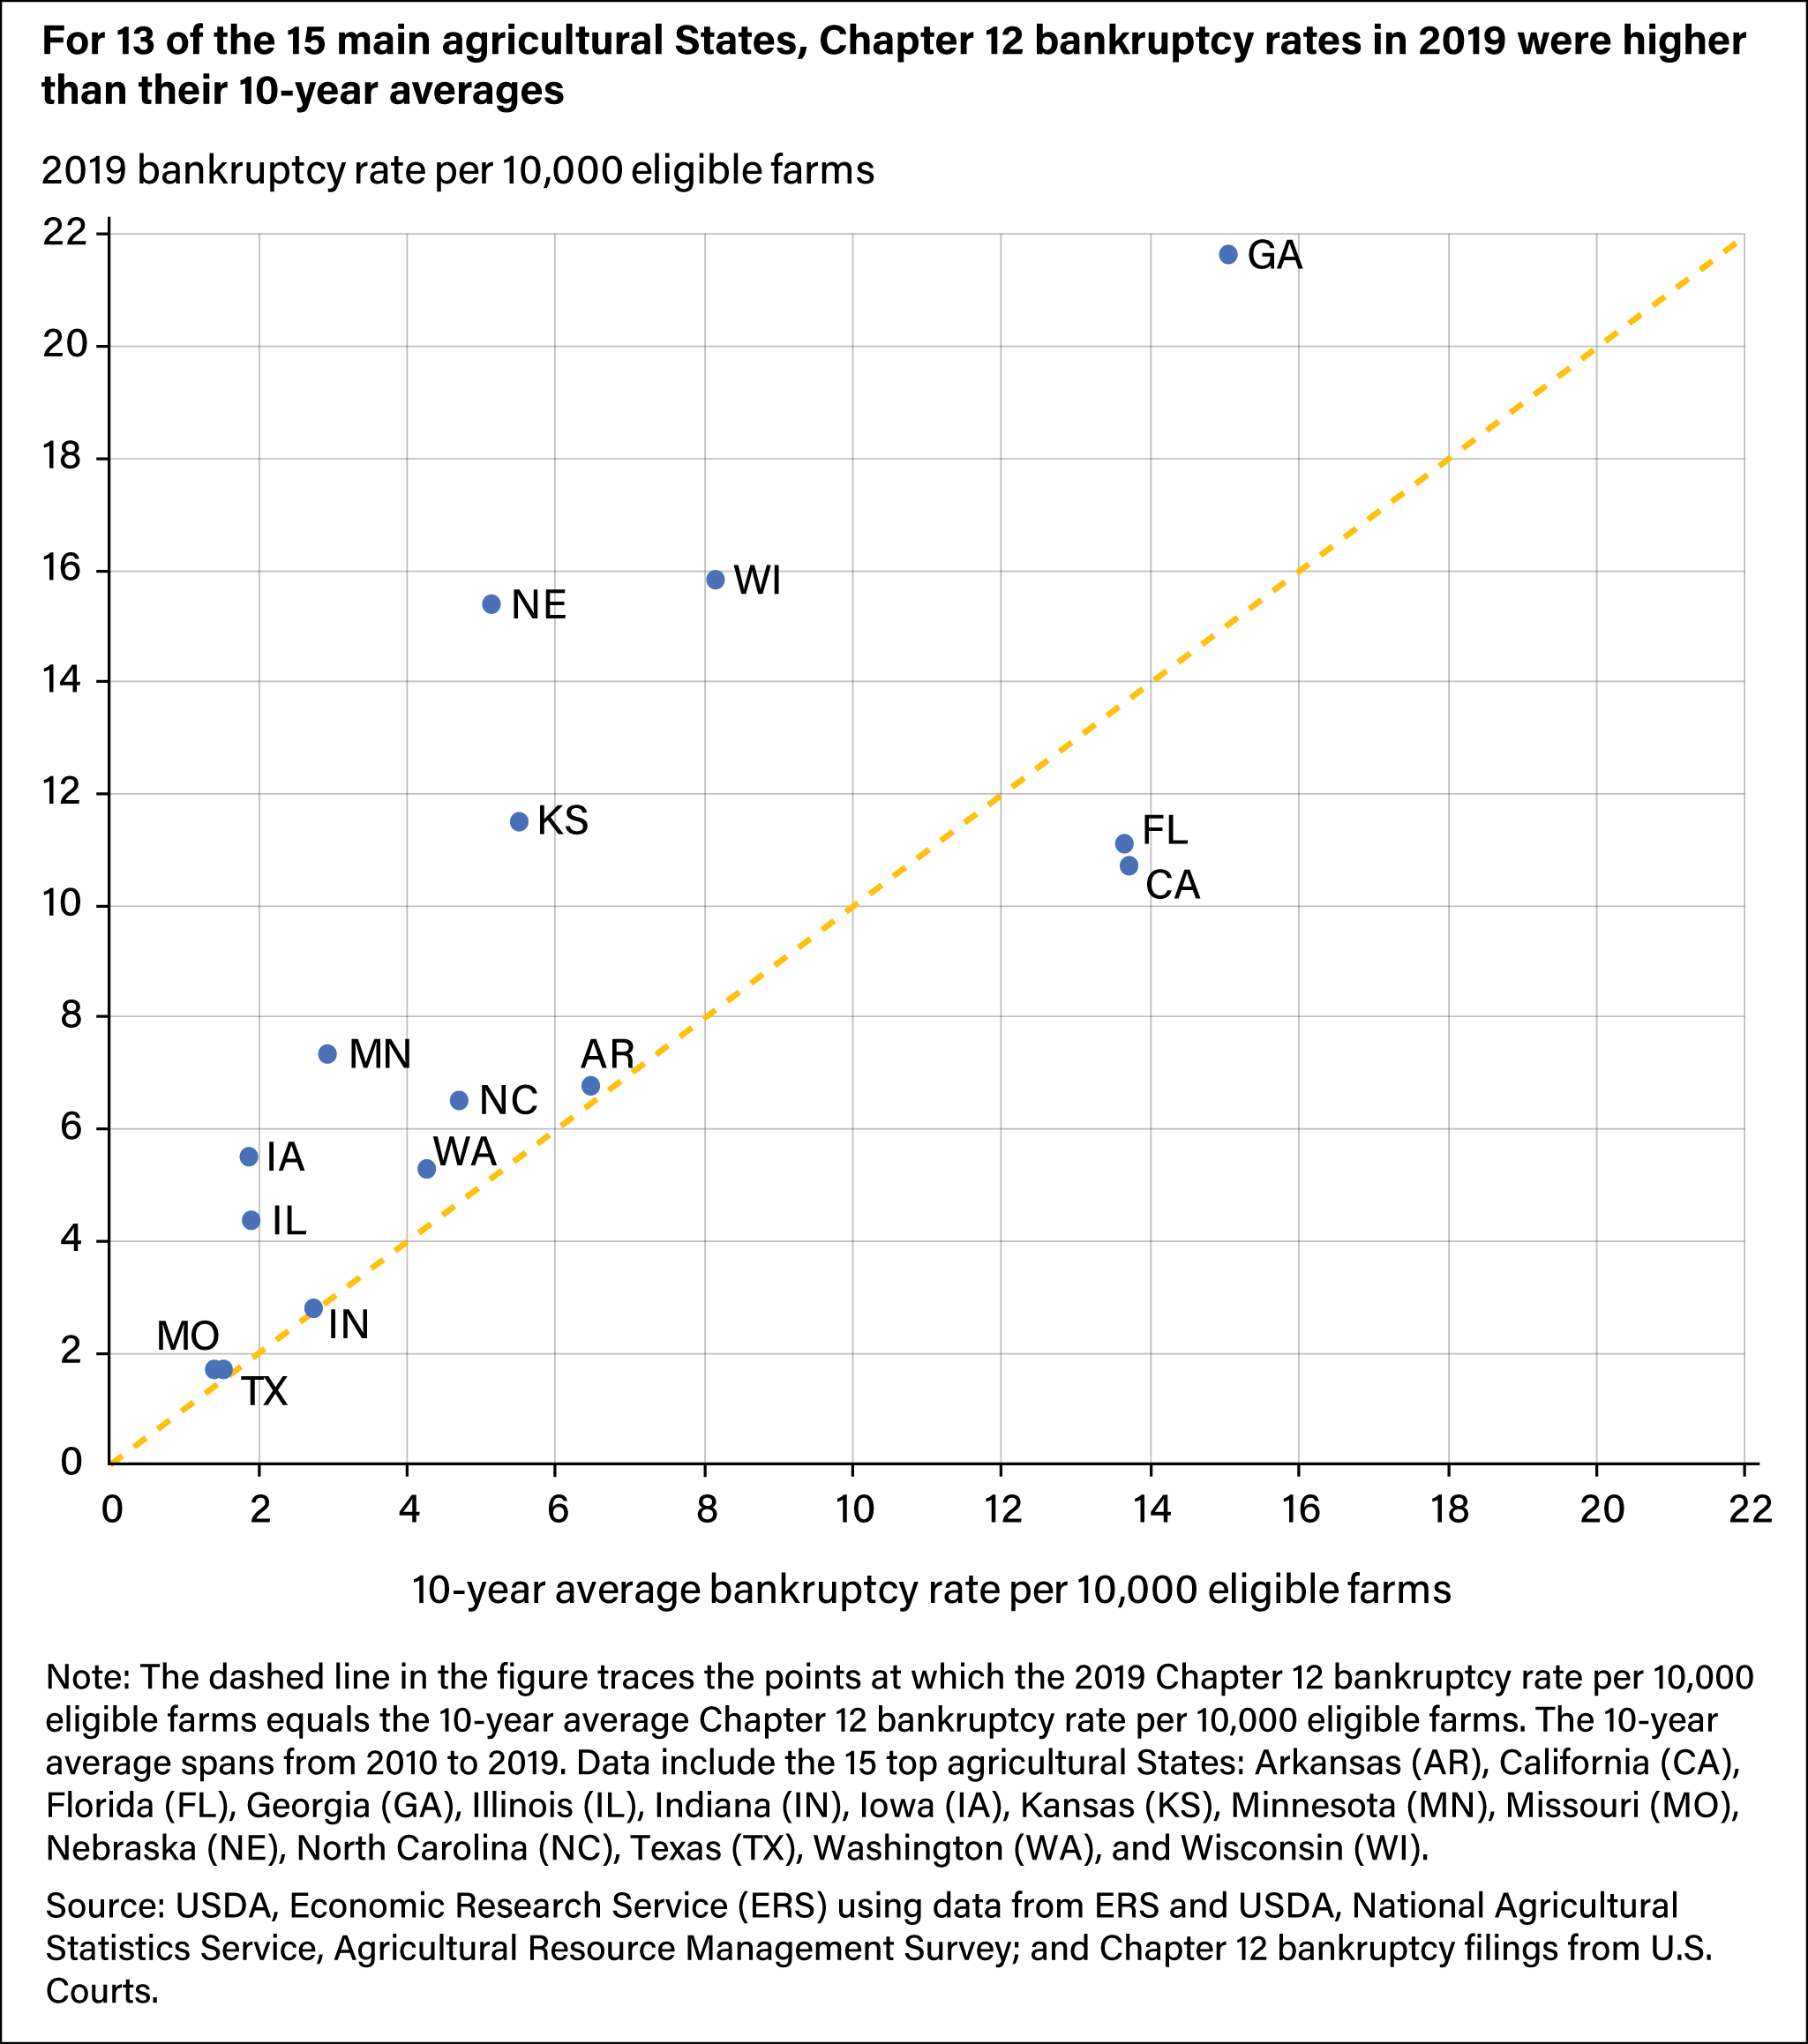
This is a dot plot chart showing the bankruptcy rate per 10,000 eligible farms in 2019 by State.