
School foods were the richest sources of the dairy food group in children's diets in 2017-18.
- by Joanne Guthrie and Biing-Hwan Lin
- 9/7/2021
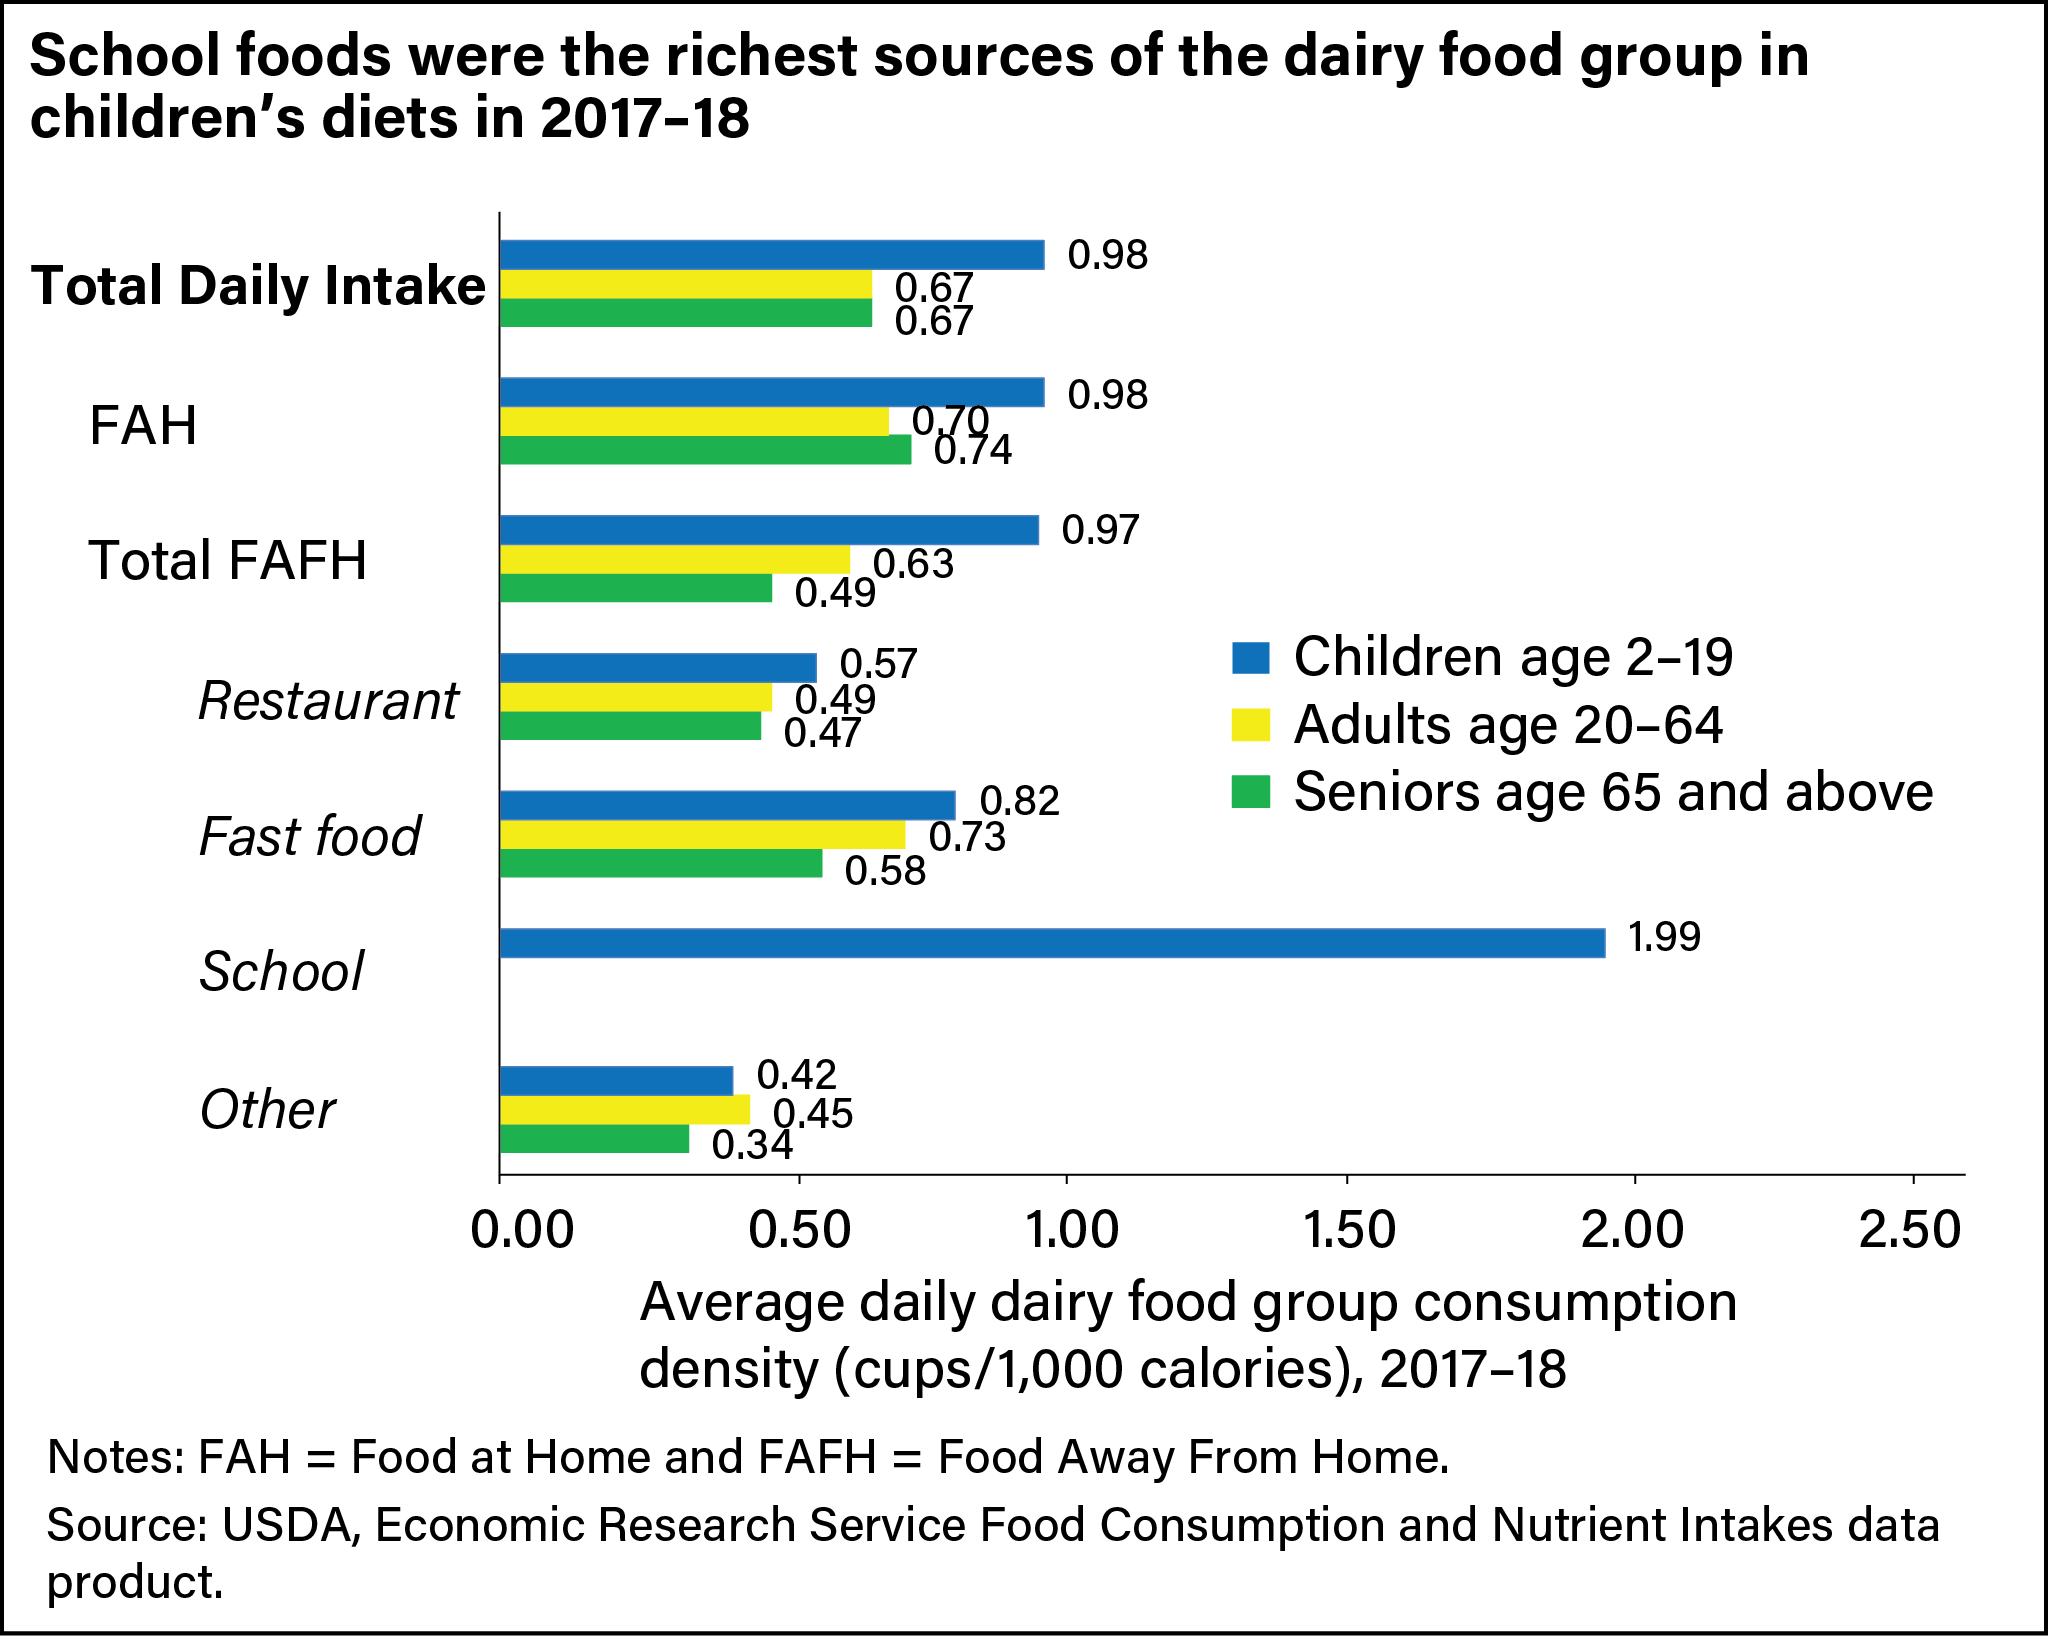
The new Food Consumption and Nutrient Intakes Data Product can provide a wealth of information about the food choices of U.S. consumers. This data can be categorized into foods prepared at home or foods prepared away from home, by age demographics, or on food groups and nutrients.