
Processed food and beverages account for more than three-fourths of China's food import refusals but less than a fifth of the value of China's food imports
- by Fred Gale
- 5/3/2021
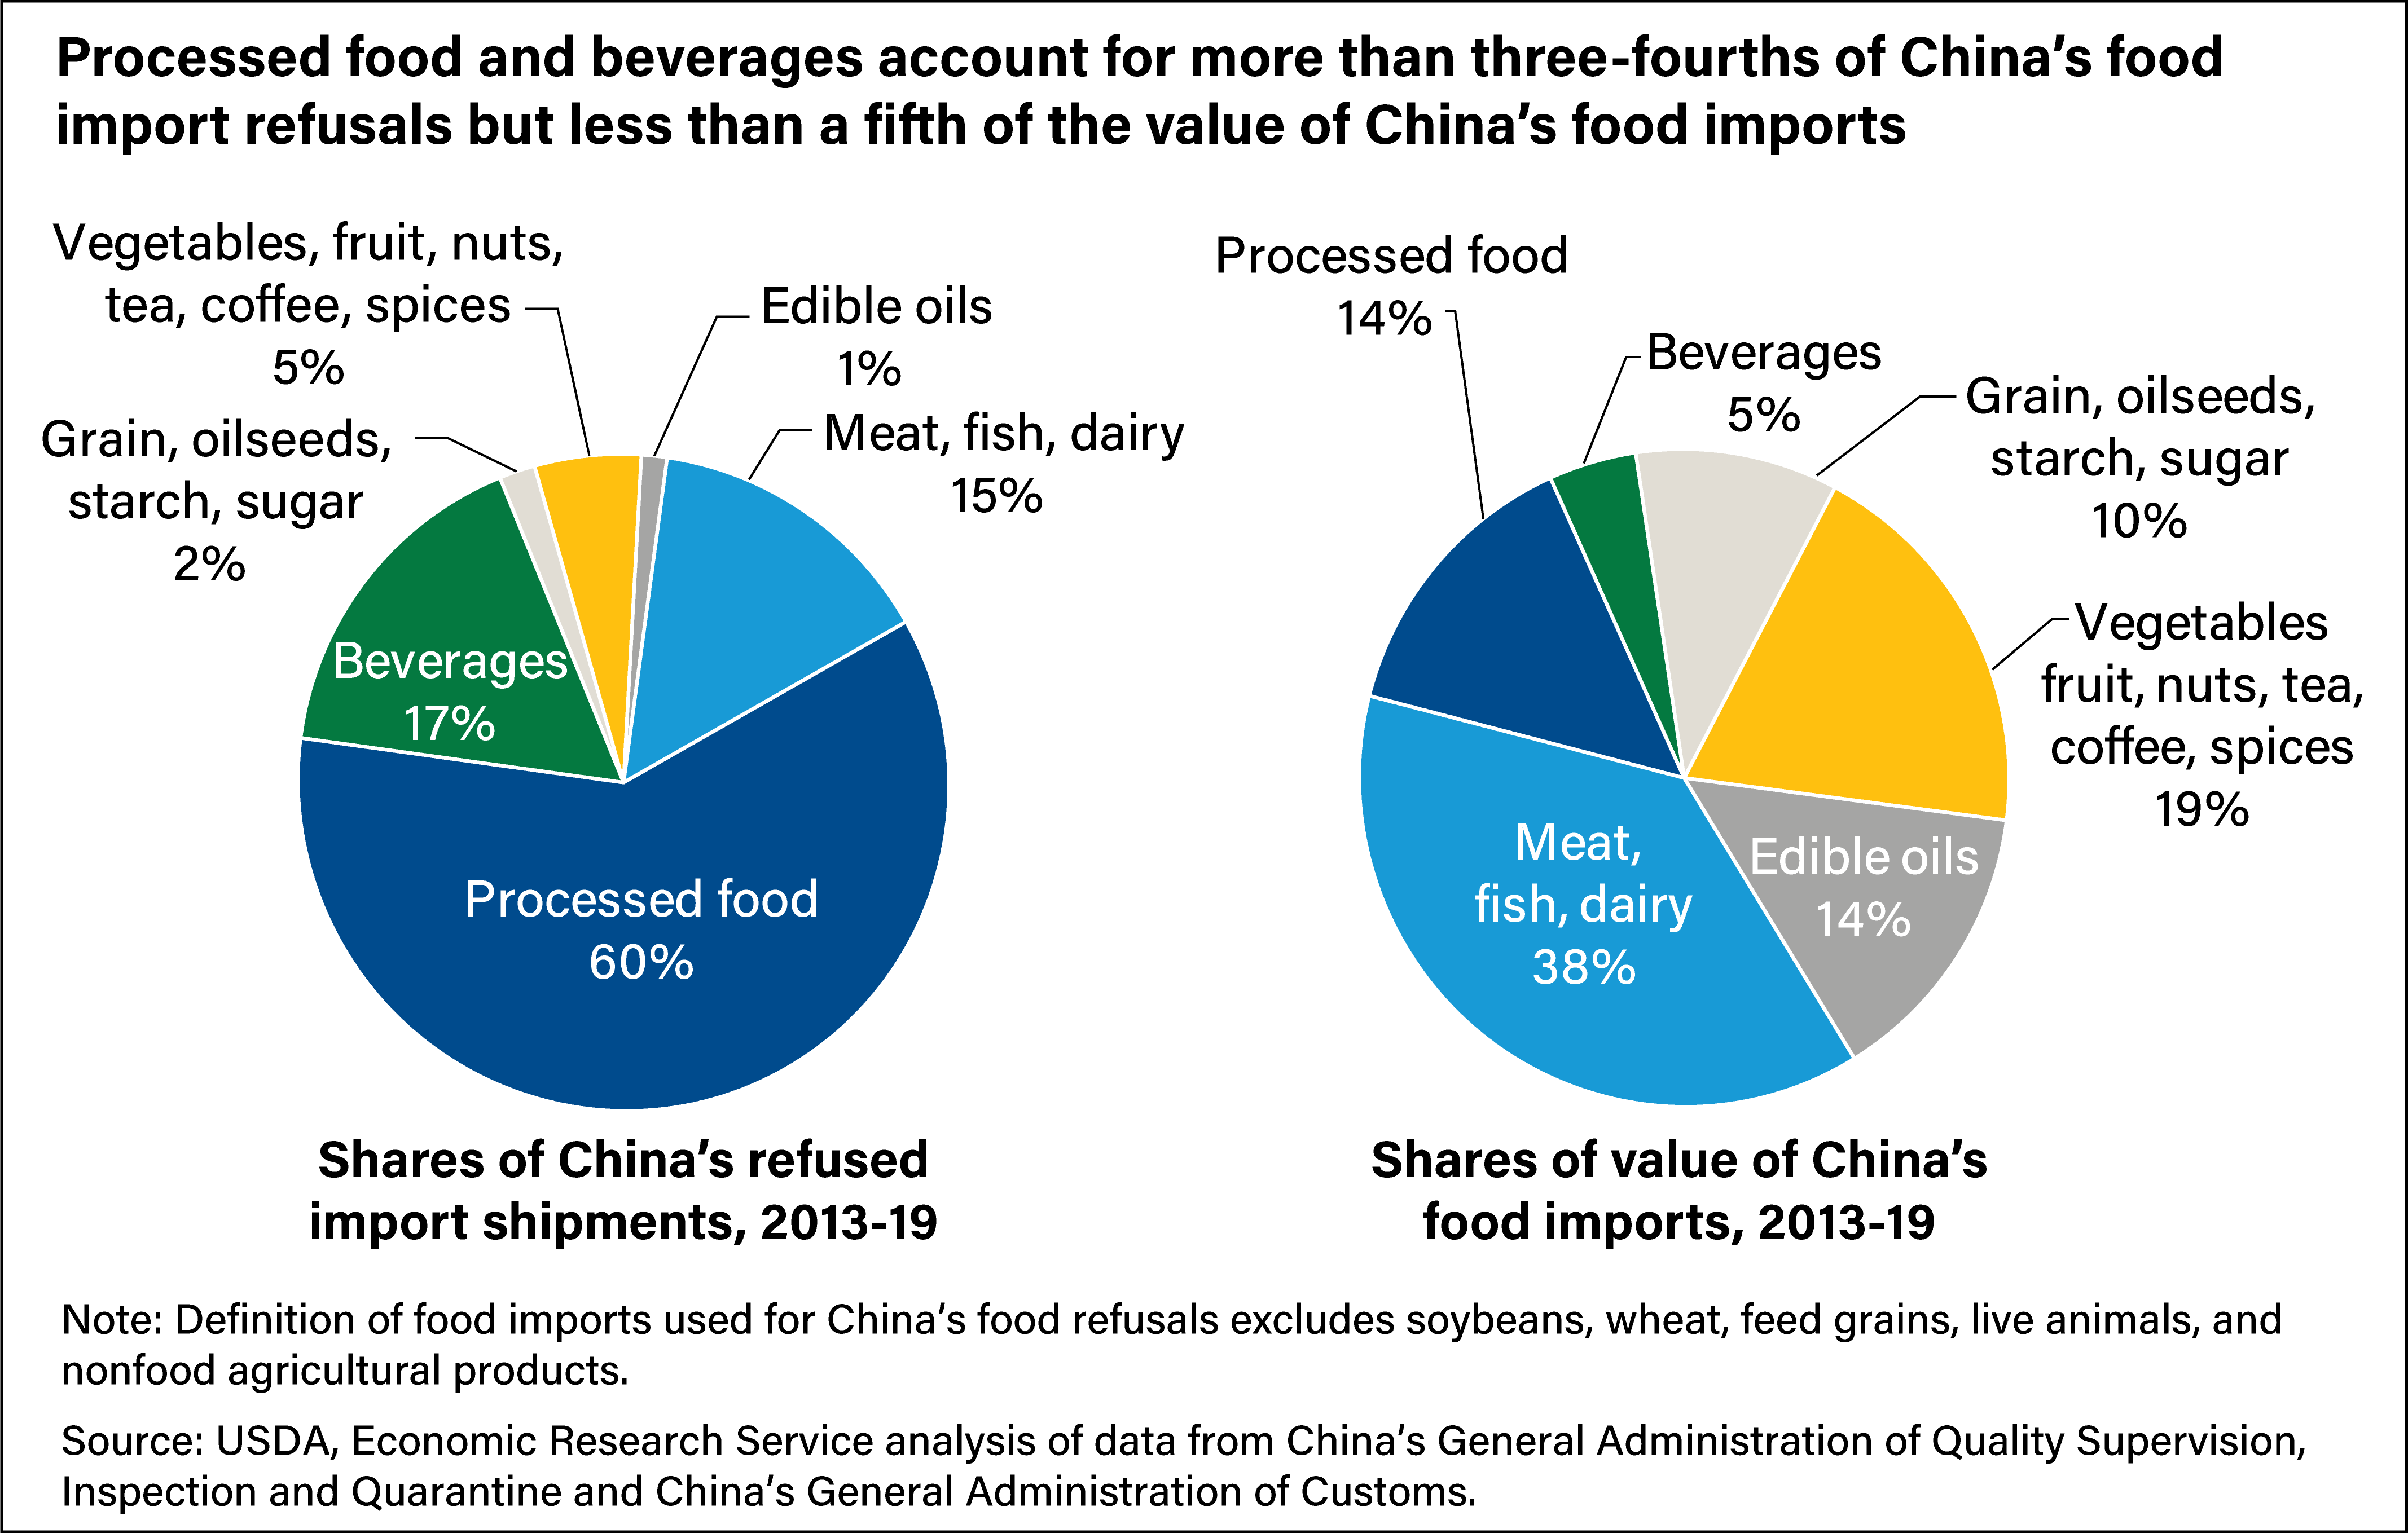
Two pie charts with the types of food imported by China from 2013-19 with one pie showing the frequency of types of foods rejected and the other pie showing the share by value of those types of food imports being rejected.
We’d welcome your feedback!
Would you be willing to answer a few quick questions about your experience?