
Women accounted for an increasing share of hired farm workforce from 2009 to 2018
- by Marcelo Castillo
- 3/8/2021
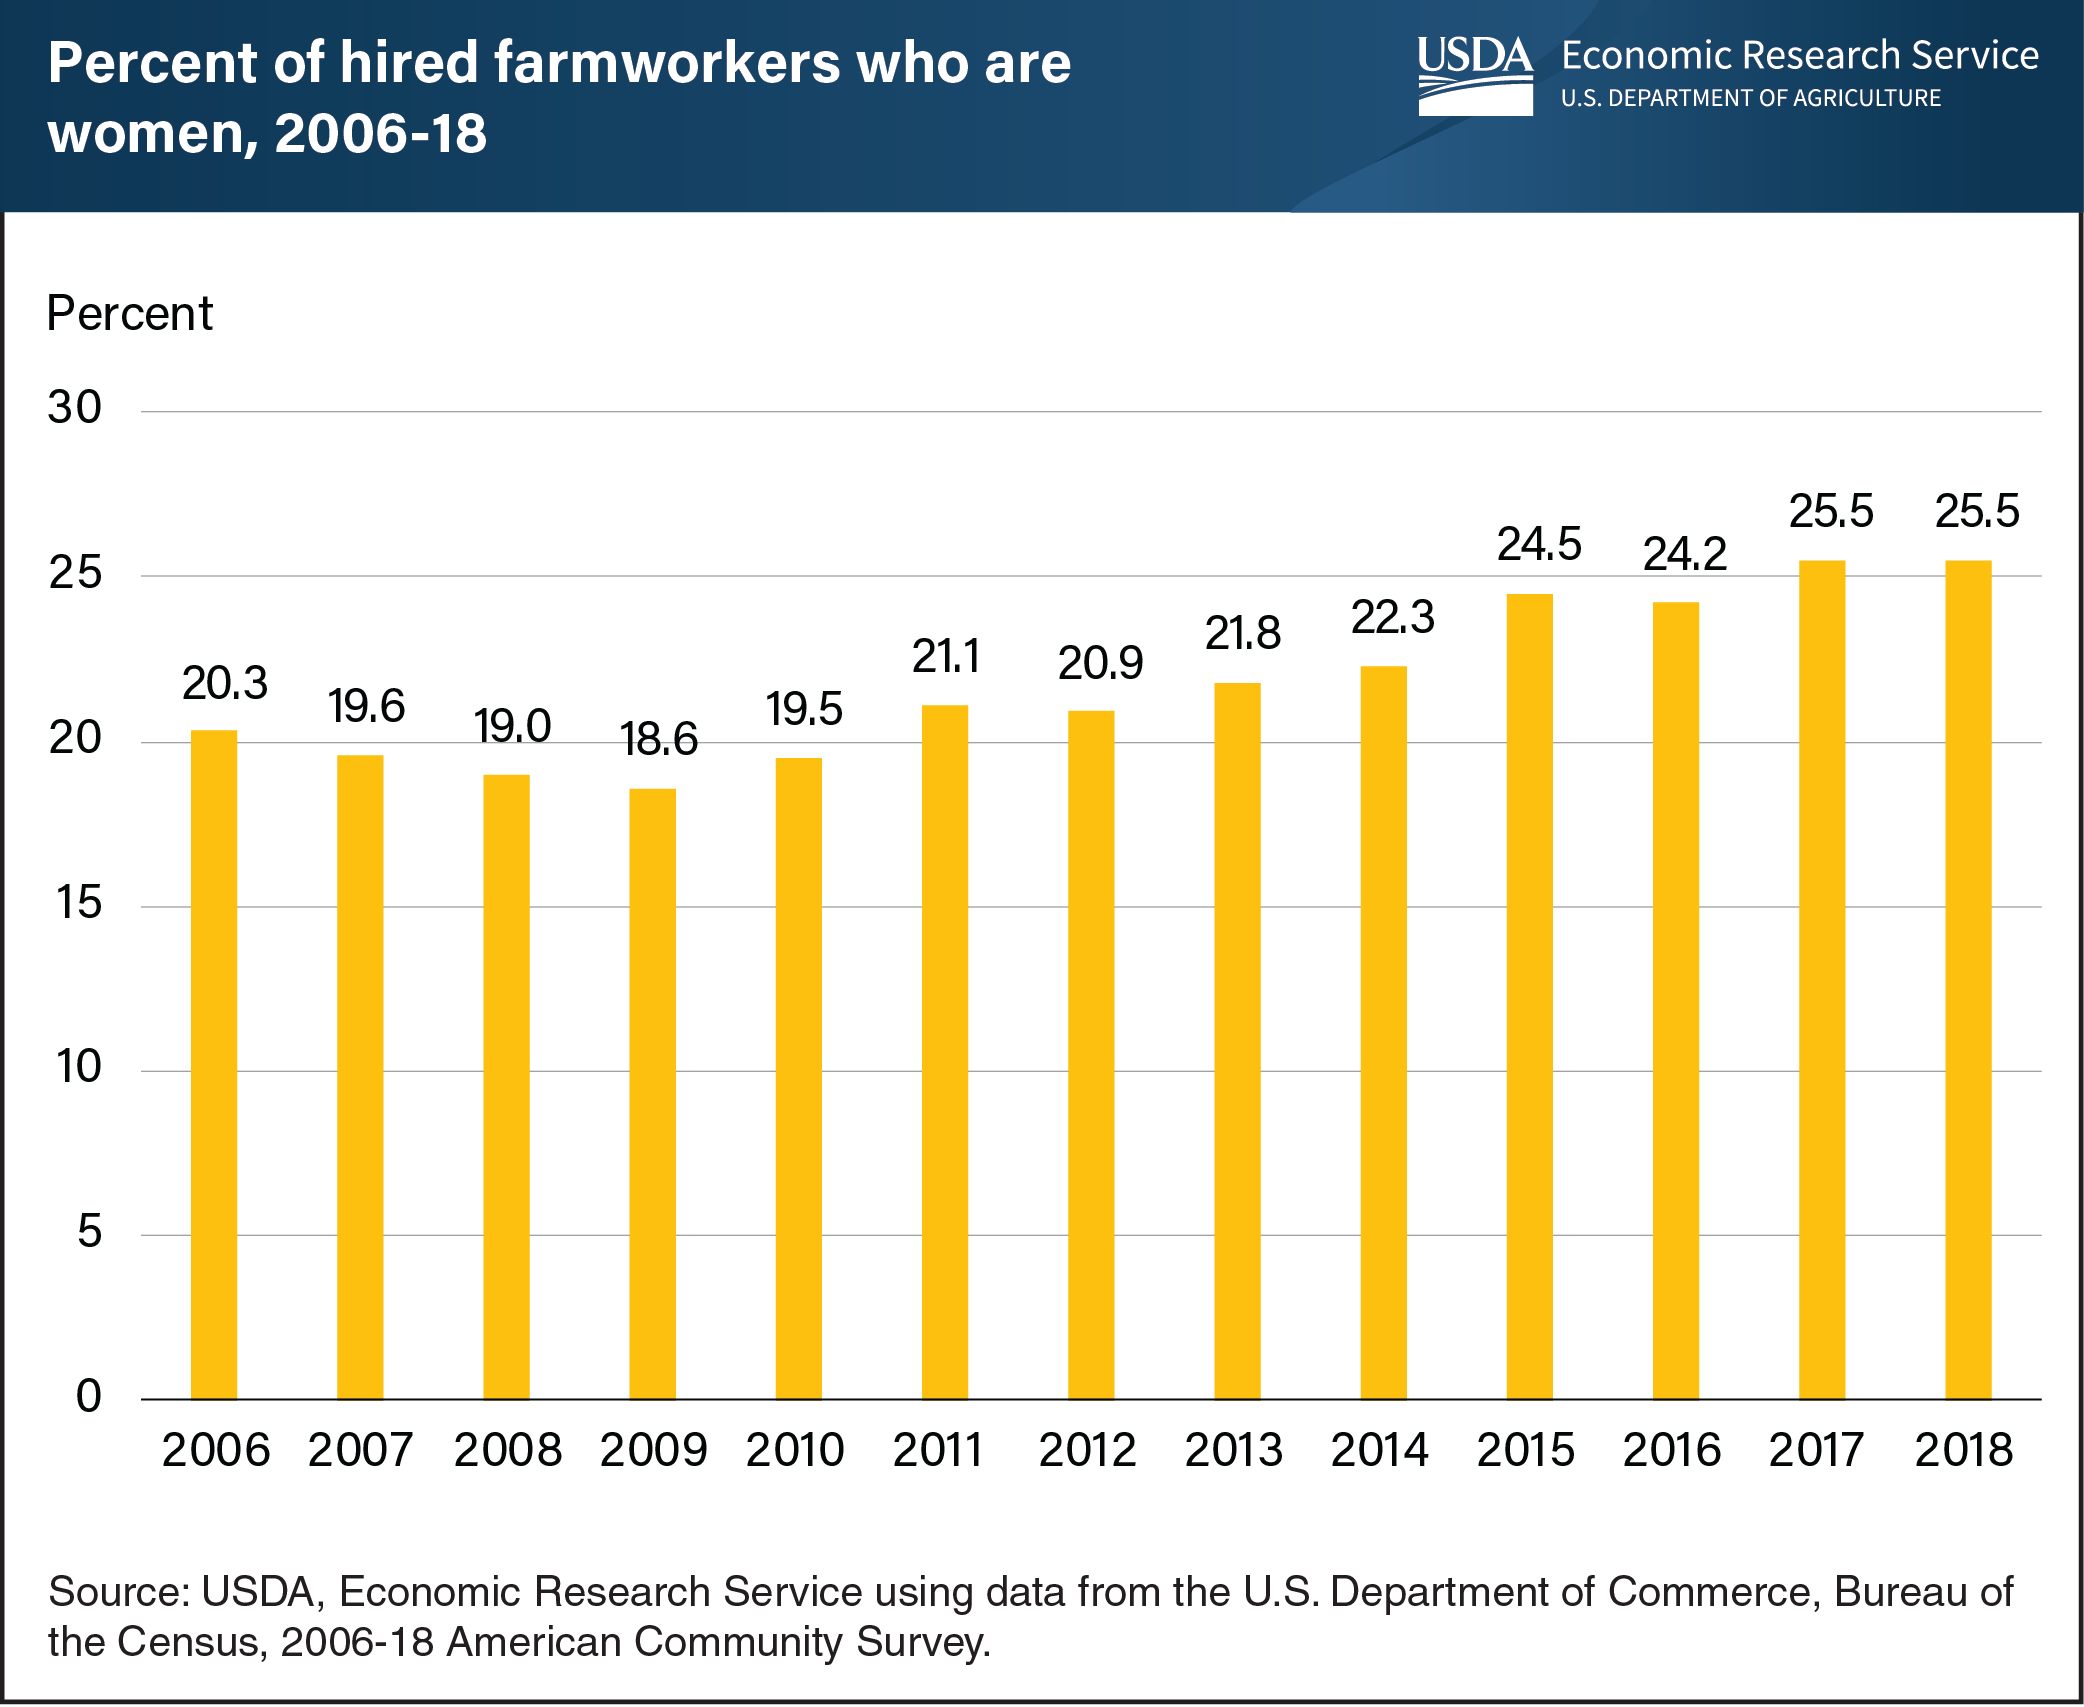
From 2006 to 2009, the share of women in the hired farm workforce decreased slightly, but then climbed from 18.6 percent in 2009 to 25.5 percent in 2018. Hired farmworkers (which exclude self-employed farmers and their families) make up less than 1 percent of all U.S. wage and salary workers, but the overall number of hired farmworkers has remained relatively unchanged over this same period. Hired farmworkers often work in the production of fruits, vegetables, melons, dairy, and nursery and greenhouse crops. As can be seen from the rise in percentage from 2009 to 2018, in recent years, more women have taken on farm work. Overall, farm wages have risen over this period along with changes in the mix of capital and labor farms use during production. These changes may have resulted in a gradual shift in the share of women who comprise the hired farm labor force. This chart appears in the October 2020 Amber Waves data feature, “U.S. Farm Employers Respond to Labor Market Changes With Higher Wages, Use of Visa Program, and More Women Workers.”