
Variety of vegetables available in United States expanded over last two decades
- by Andrzej Blazejczyk
- 2/22/2021
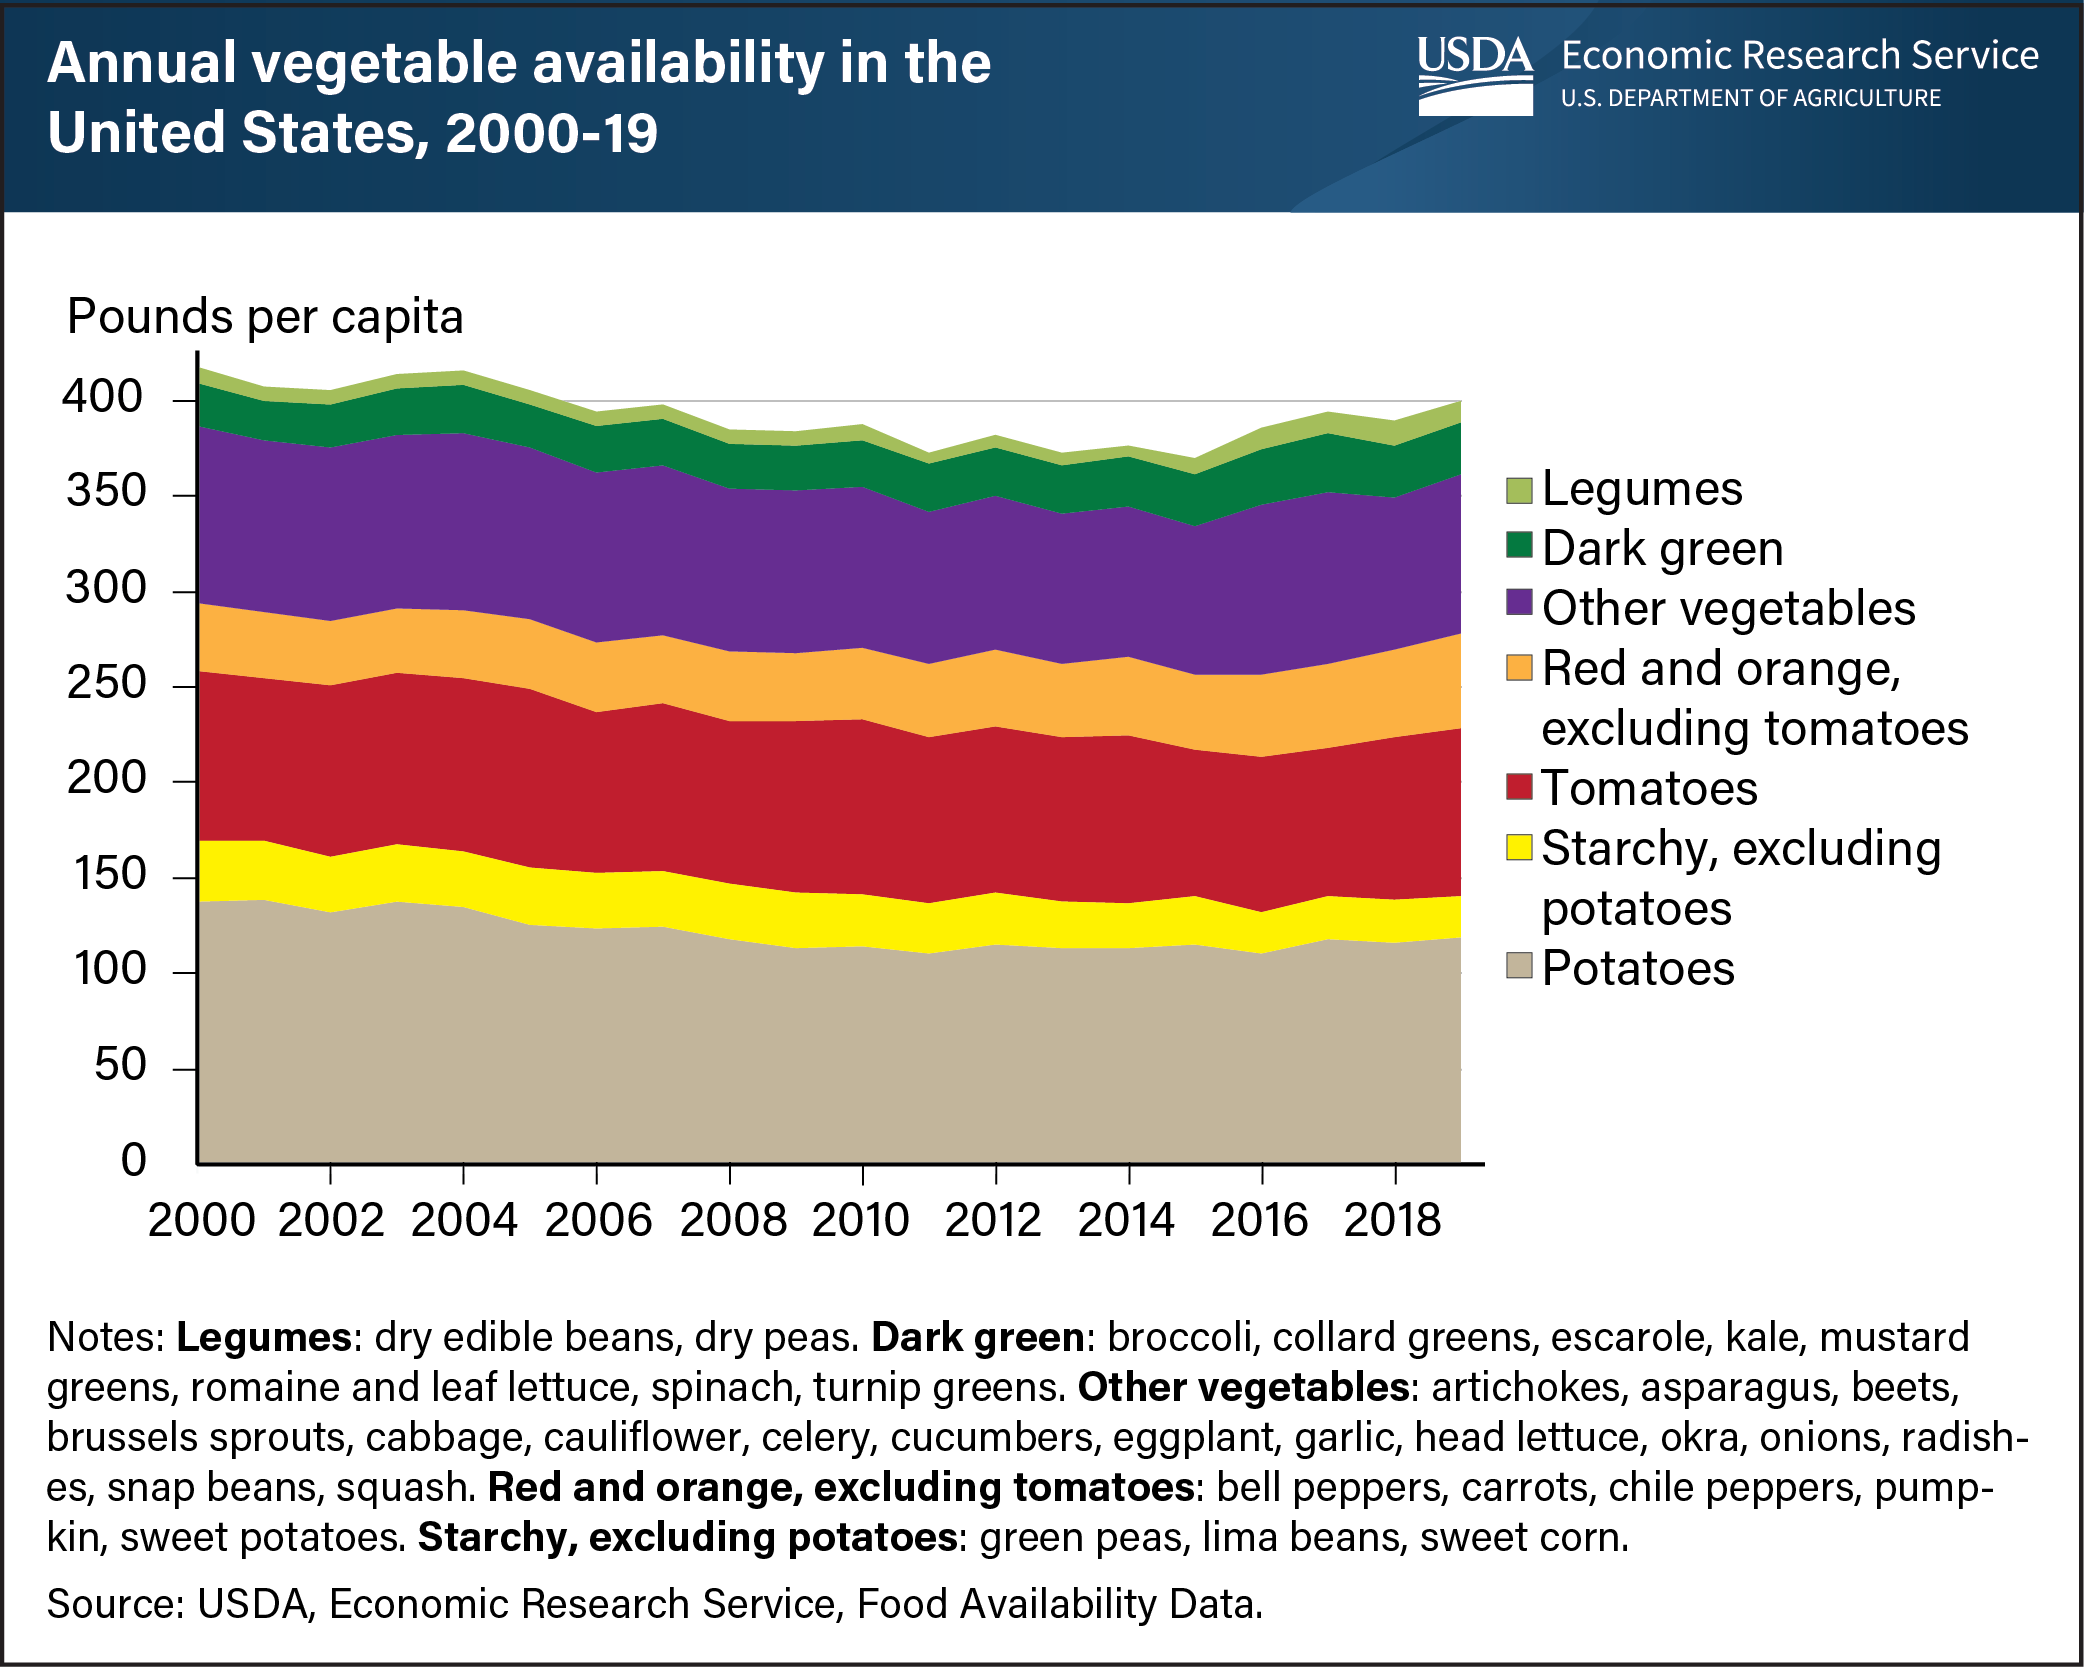
People in the United States are slowly expanding the variety of vegetables on their plates, data from the USDA, Economic Research Service (ERS) show. The vegetables food group is composed of five main subgroups: legumes, dark green, other vegetables, red and orange (including tomatoes), and starchy (including potatoes). Each offers an array of important vitamins, minerals, and dietary fiber. From 2000 to 2019, the combined share of dark green vegetables, red and orange vegetables (excluding tomatoes), and legumes available to eat in the United States increased from 16 percent to 22 percent. Increased availability of dark green vegetables over this period—led by a 47-percent jump in romaine and leaf lettuce—added additional variety for U.S. consumers. While the overall amount of vegetables available over the last two decades has decreased 4 percent, from 417.4 pounds per capita in 2000 to 400.1 pounds in 2019, there has been an increase in availability in recent years due in part to the expansion in varieties available for consumption. ERS’s Food Availability (Per Capita) Data System provides annual estimates of the per-capita availability for more than 200 food commodities consumed in the United States. This chart appears in the ERS Amber Waves article, “U.S. Supplies of Vegetables Available To Eat in 2019 Down Slightly From 2000, But Variety Has Grown,” February 2021.