
SNAP participation fell between 2013 and 2019 across United States
- by Laura Tiehen
- 1/21/2021
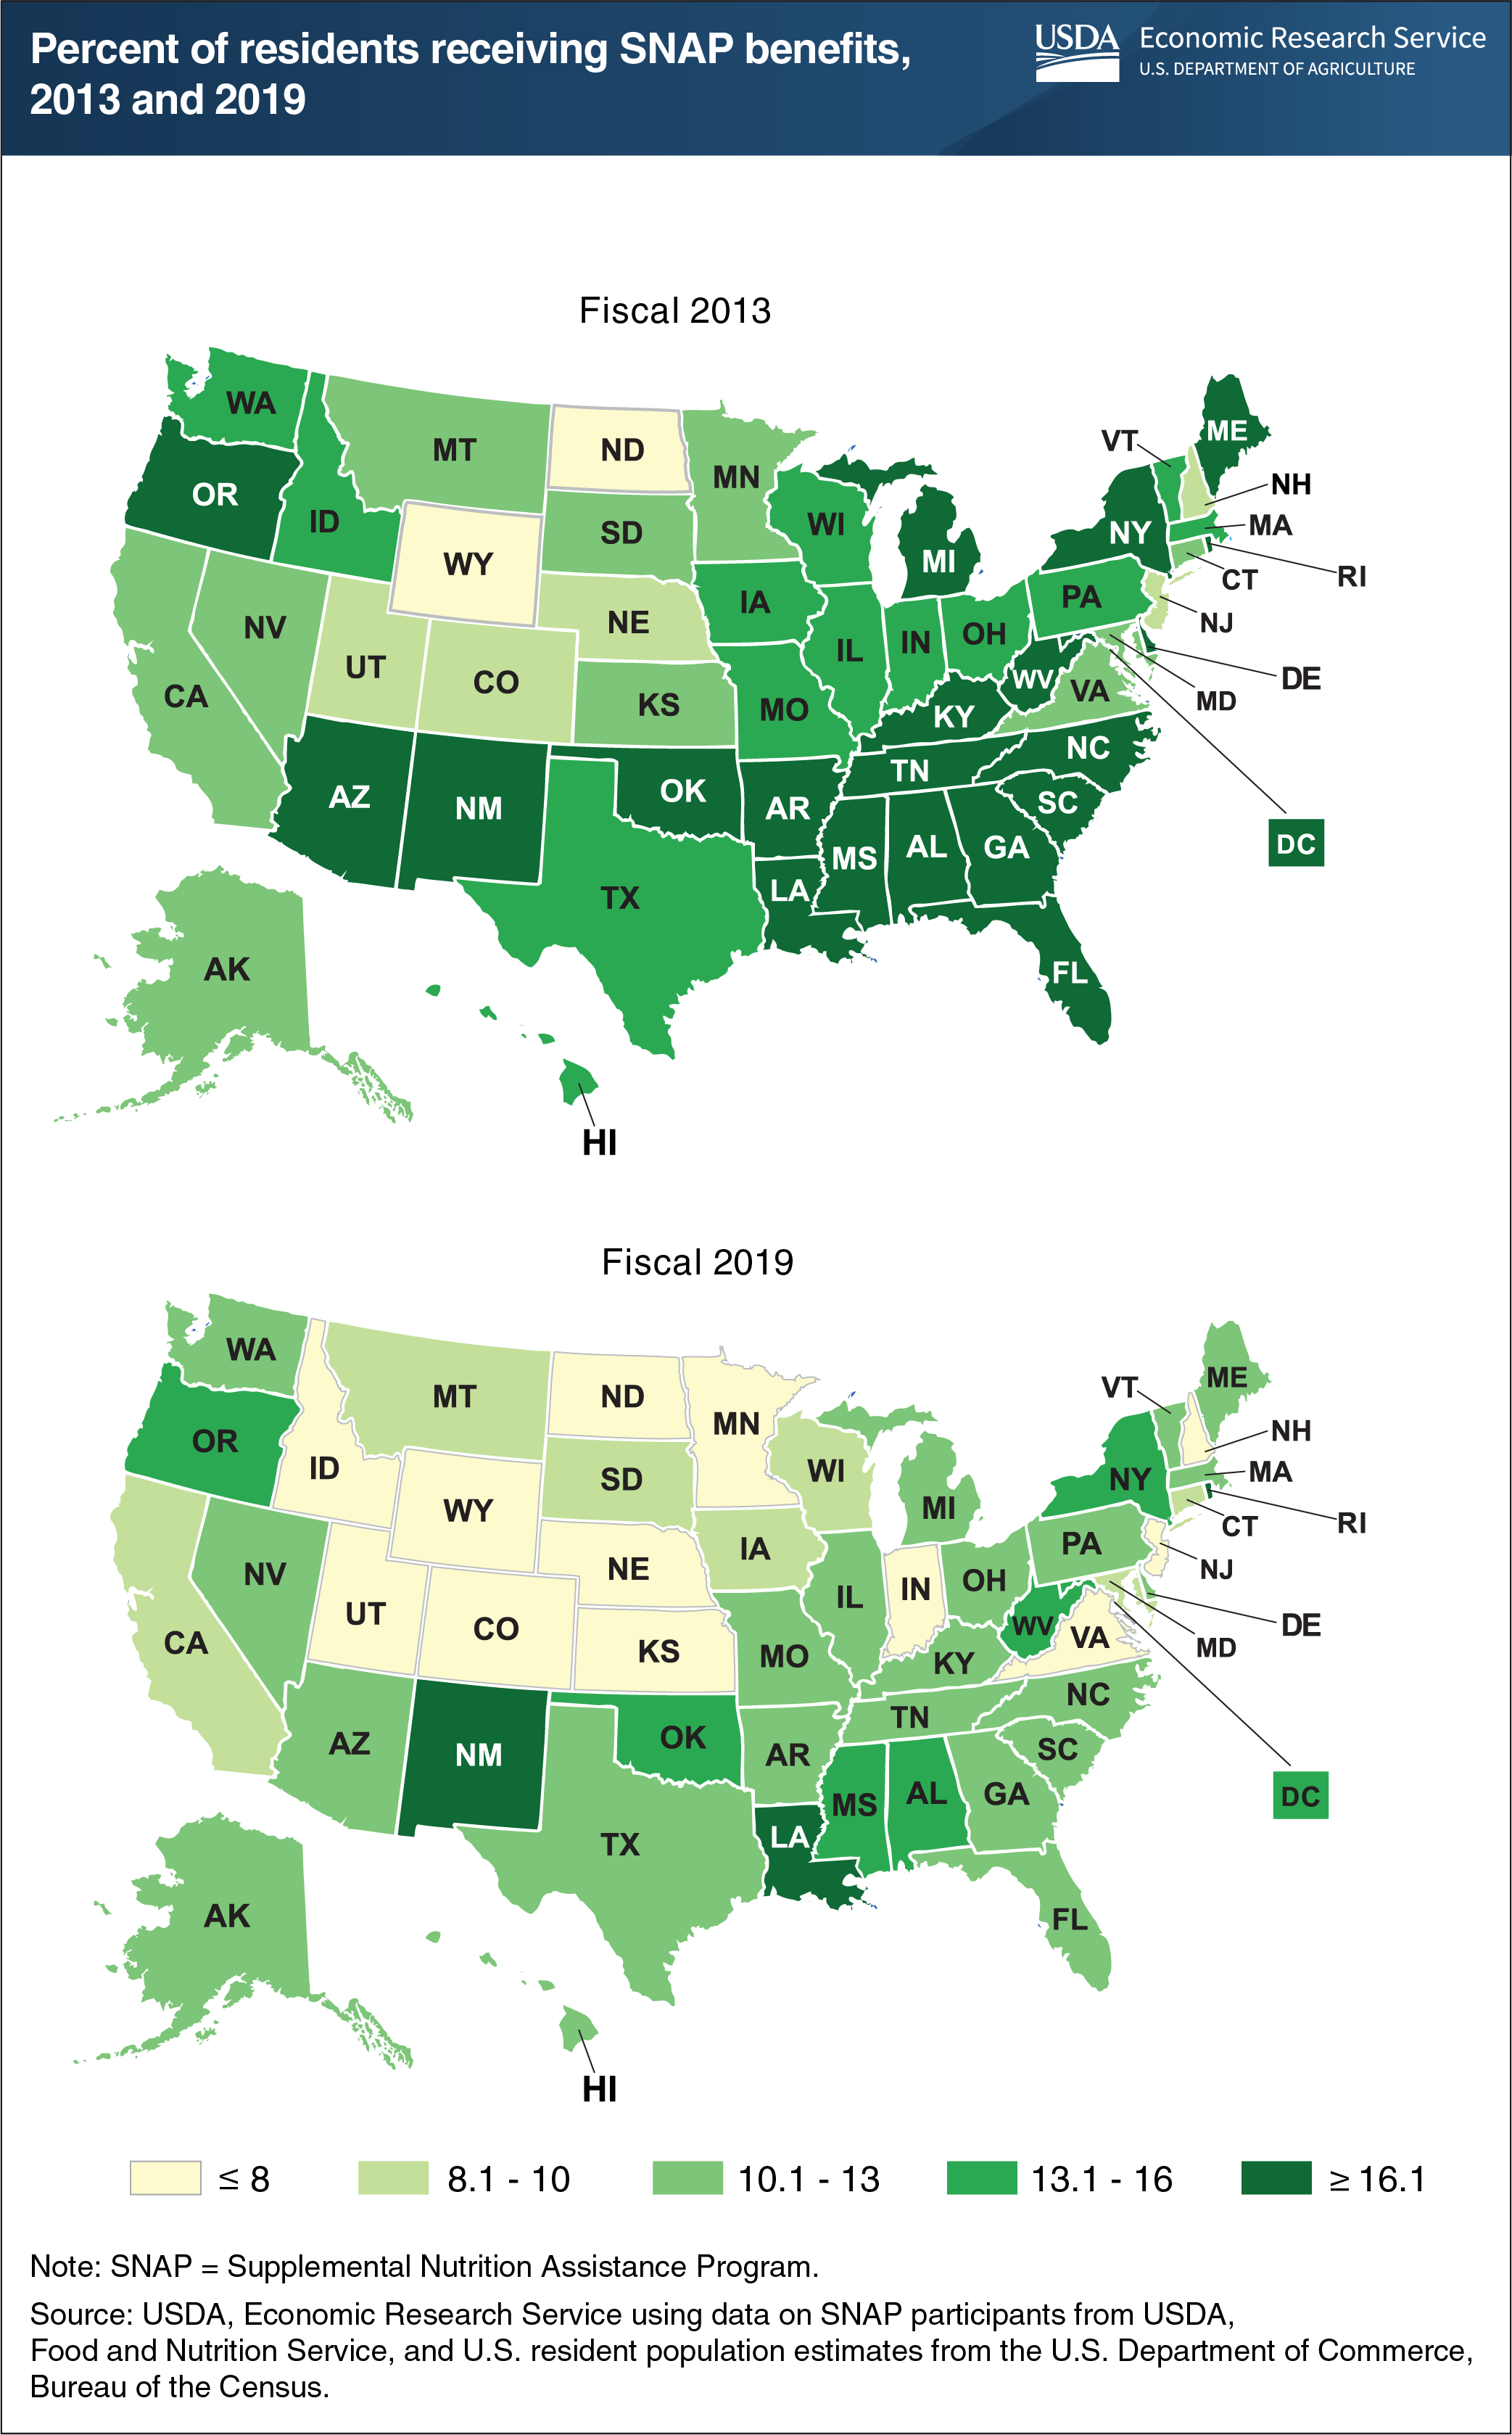
Federal spending on USDA’s Supplemental Nutrition Assistance Program (SNAP) in fiscal year 2019 totaled $60.4 billion and accounted for 65 percent of all USDA food and nutrition assistance spending. On average, 35.7 million people participated in the program each month in fiscal year 2019, or about 11 percent of the U.S. population. In 2013, when average monthly participation peaked at 47.6 million people in the aftermath of the 2007-09 recession, 15 percent of the population participated in SNAP. USDA’s Food and Nutrition Service (FNS) works with State partners to administer SNAP. States face different economic conditions and are allowed by Federal law and FNS regulations to exercise state-specific policy options that can affect participation as well. The percent of State residents receiving SNAP benefits in fiscal year 2019 ranged from 19.8 percent in New Mexico to 4.2 percent in Wyoming, partly reflecting the higher rates of unemployment and poverty in New Mexico compared with Wyoming. Between 2013 and 2019, all 50 States and the District of Columbia saw a decrease in the share of residents receiving SNAP benefits as economic conditions improved in the United States and job opportunities expanded. The data in these maps pre-date the COVID-19 pandemic and its impact on SNAP participation. Fiscal year 2020 data are expected to be released by summer 2021. This chart appears in the Economic Research Service’s Amber Waves article, “Taking a Closer Look at Supplemental Nutrition Assistance (SNAP) Participation and Expenditures,” August 2020.