
Child food insufficiency in mid-July 2020 varied by State
- by Christian A. Gregory
- 1/4/2021
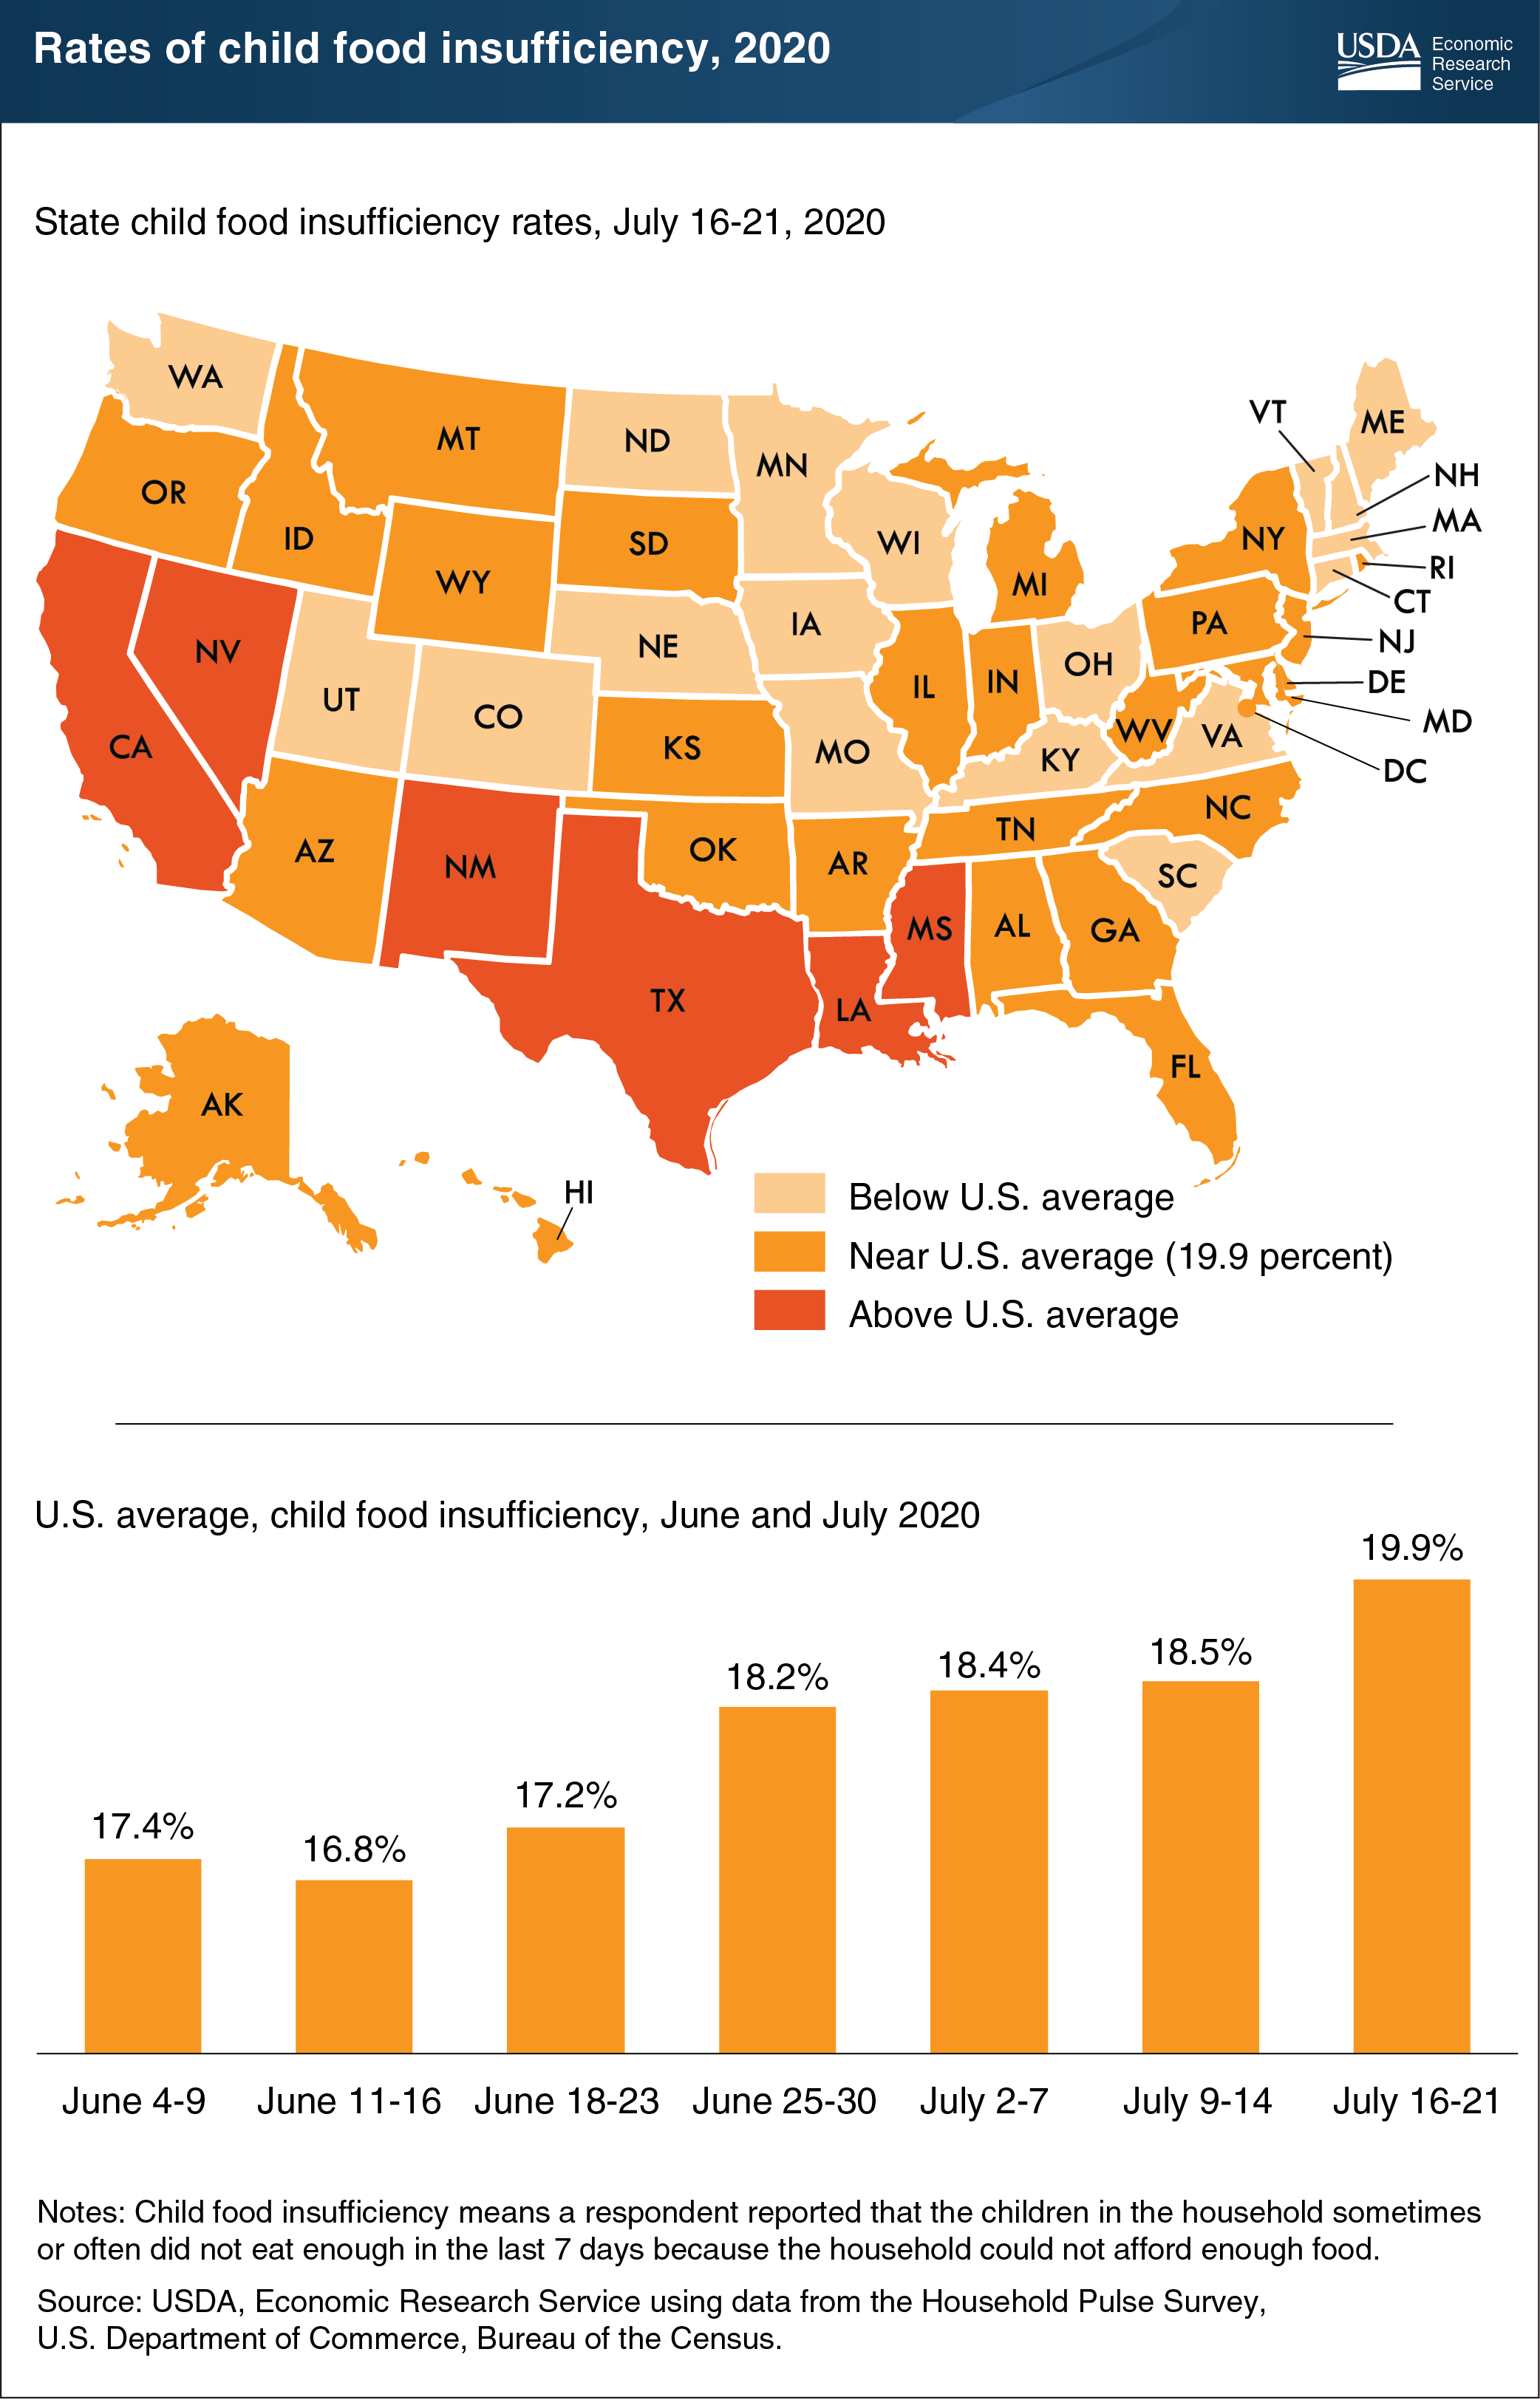
To track rapid changes in the U.S. economic landscape during the COVID-19 pandemic, researchers at the Economic Research Service (ERS) teamed up with the U.S. Department of Commerce, Bureau of the Census and five other Federal agencies to produce the Household Pulse Survey. The survey ran from the week of April 23-28 to the week of July 16-21 in 2020. ERS researchers used a survey question asked during weeks 6 through 12 of the survey period about disruptions in the quantity of foods consumed by children to examine child food insufficiency for U.S. households. Households were classified as having children with food insufficiency if the survey respondent said that the children in the household were not eating enough “sometimes” or “often” in the last 7 days because the household could not afford enough food. The rate of child food insufficiency grew from a national average of 17.4 percent of U.S. households during June 4-9 to 19.9 percent at the survey’s end. During the final week of the survey, July 16-21, 18 States had child food insufficiency rates below 19.9 percent and 6 States had rates above the national average for July 16-21. The remaining 26 States and the District of Columbia had rates of food insufficiency statistically comparable to the national average. Child food insufficiency is similar in concept to the more detailed measure of “food insecurity among children” used in USDA’s annual assessments of food security to describe households that were unable at times to provide adequate, nutritious food for their children. According to USDA’s latest food security statistics, children were food insecure at times during 2019 in 6.5 percent of U.S. households with children. For more information on ERS’s food security research, see the Food Security in the U.S. topic page on the ERS website.
This Chart of Note was originally published on Tuesday, August 25, 2020.