
All counties with extreme poverty in 2018 were rural (nonmetro) counties
- by Tracey Farrigan
- 12/24/2020
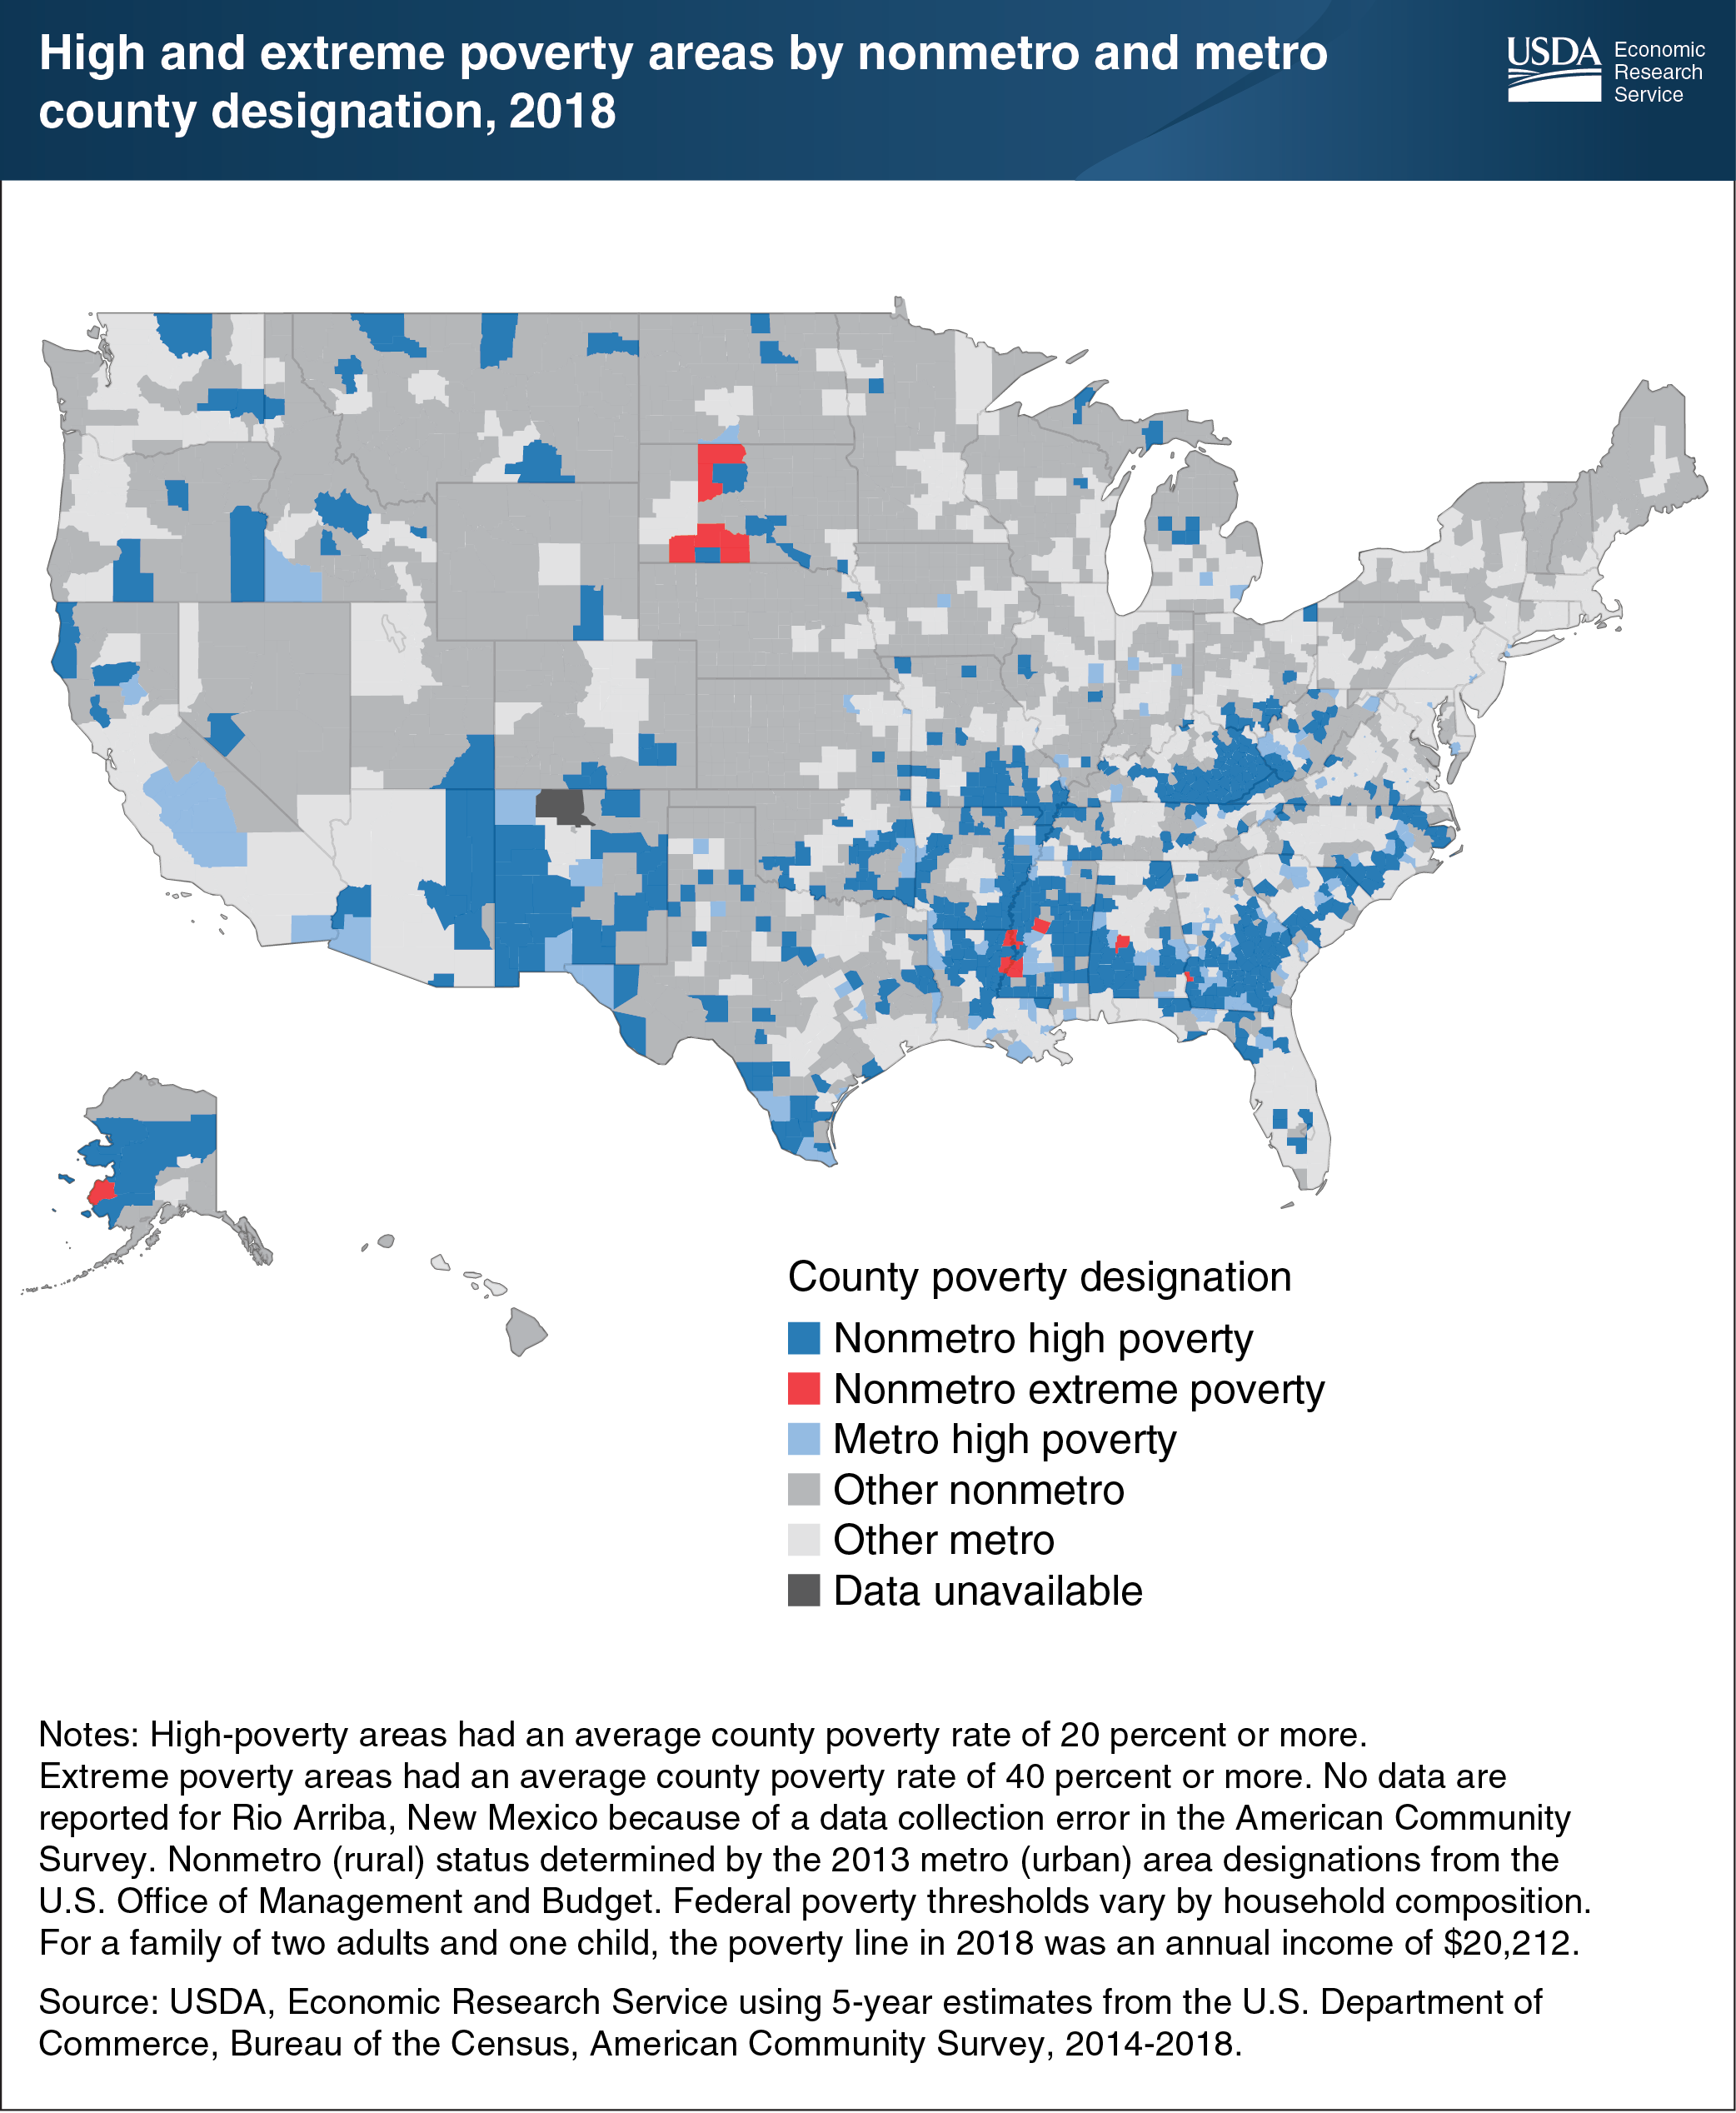
In 2018, the United States had 664 high-poverty counties, where an average of 20 percent or more of the population had lived below the Federal poverty level on average over 2014-18. The majority were rural (78.9 percent, or 524 counties). These high-poverty counties represented about one of every four rural counties, compared with about one of every ten urban counties. Fifteen of the 664 counties were extreme poverty areas, where the poverty rate was 40 percent or greater. The extreme poverty areas were also persistent poverty counties, with poverty rates of at least 20 percent over the past 30 years. In 2018, all of the extreme poverty counties were in rural America. These counties are not evenly distributed, but rather are geographically concentrated and disproportionately located in regions with above-average populations of racial minorities. Several extreme poverty counties, for instance, were found in Mississippi, including four counties where there has historically been a high incidence of poverty among the African-American population. These counties were also found in South Dakota, with six counties where Native Americans made up more than 50 percent of the population. This chart appears on the Economic Research Service topic page for Rural Poverty & Well-being, updated February 2020. It is also in the May 2020 Amber Waves article, “Extreme Poverty Counties Found Solely in Rural Areas in 2018.”
This Chart of Note was originally published on Tuesday, June 16, 2020.