
Time spent grocery shopping grew by 6 percent between 2004-07 and 2014-17
- by Eliana Zeballos
- 3/31/2020
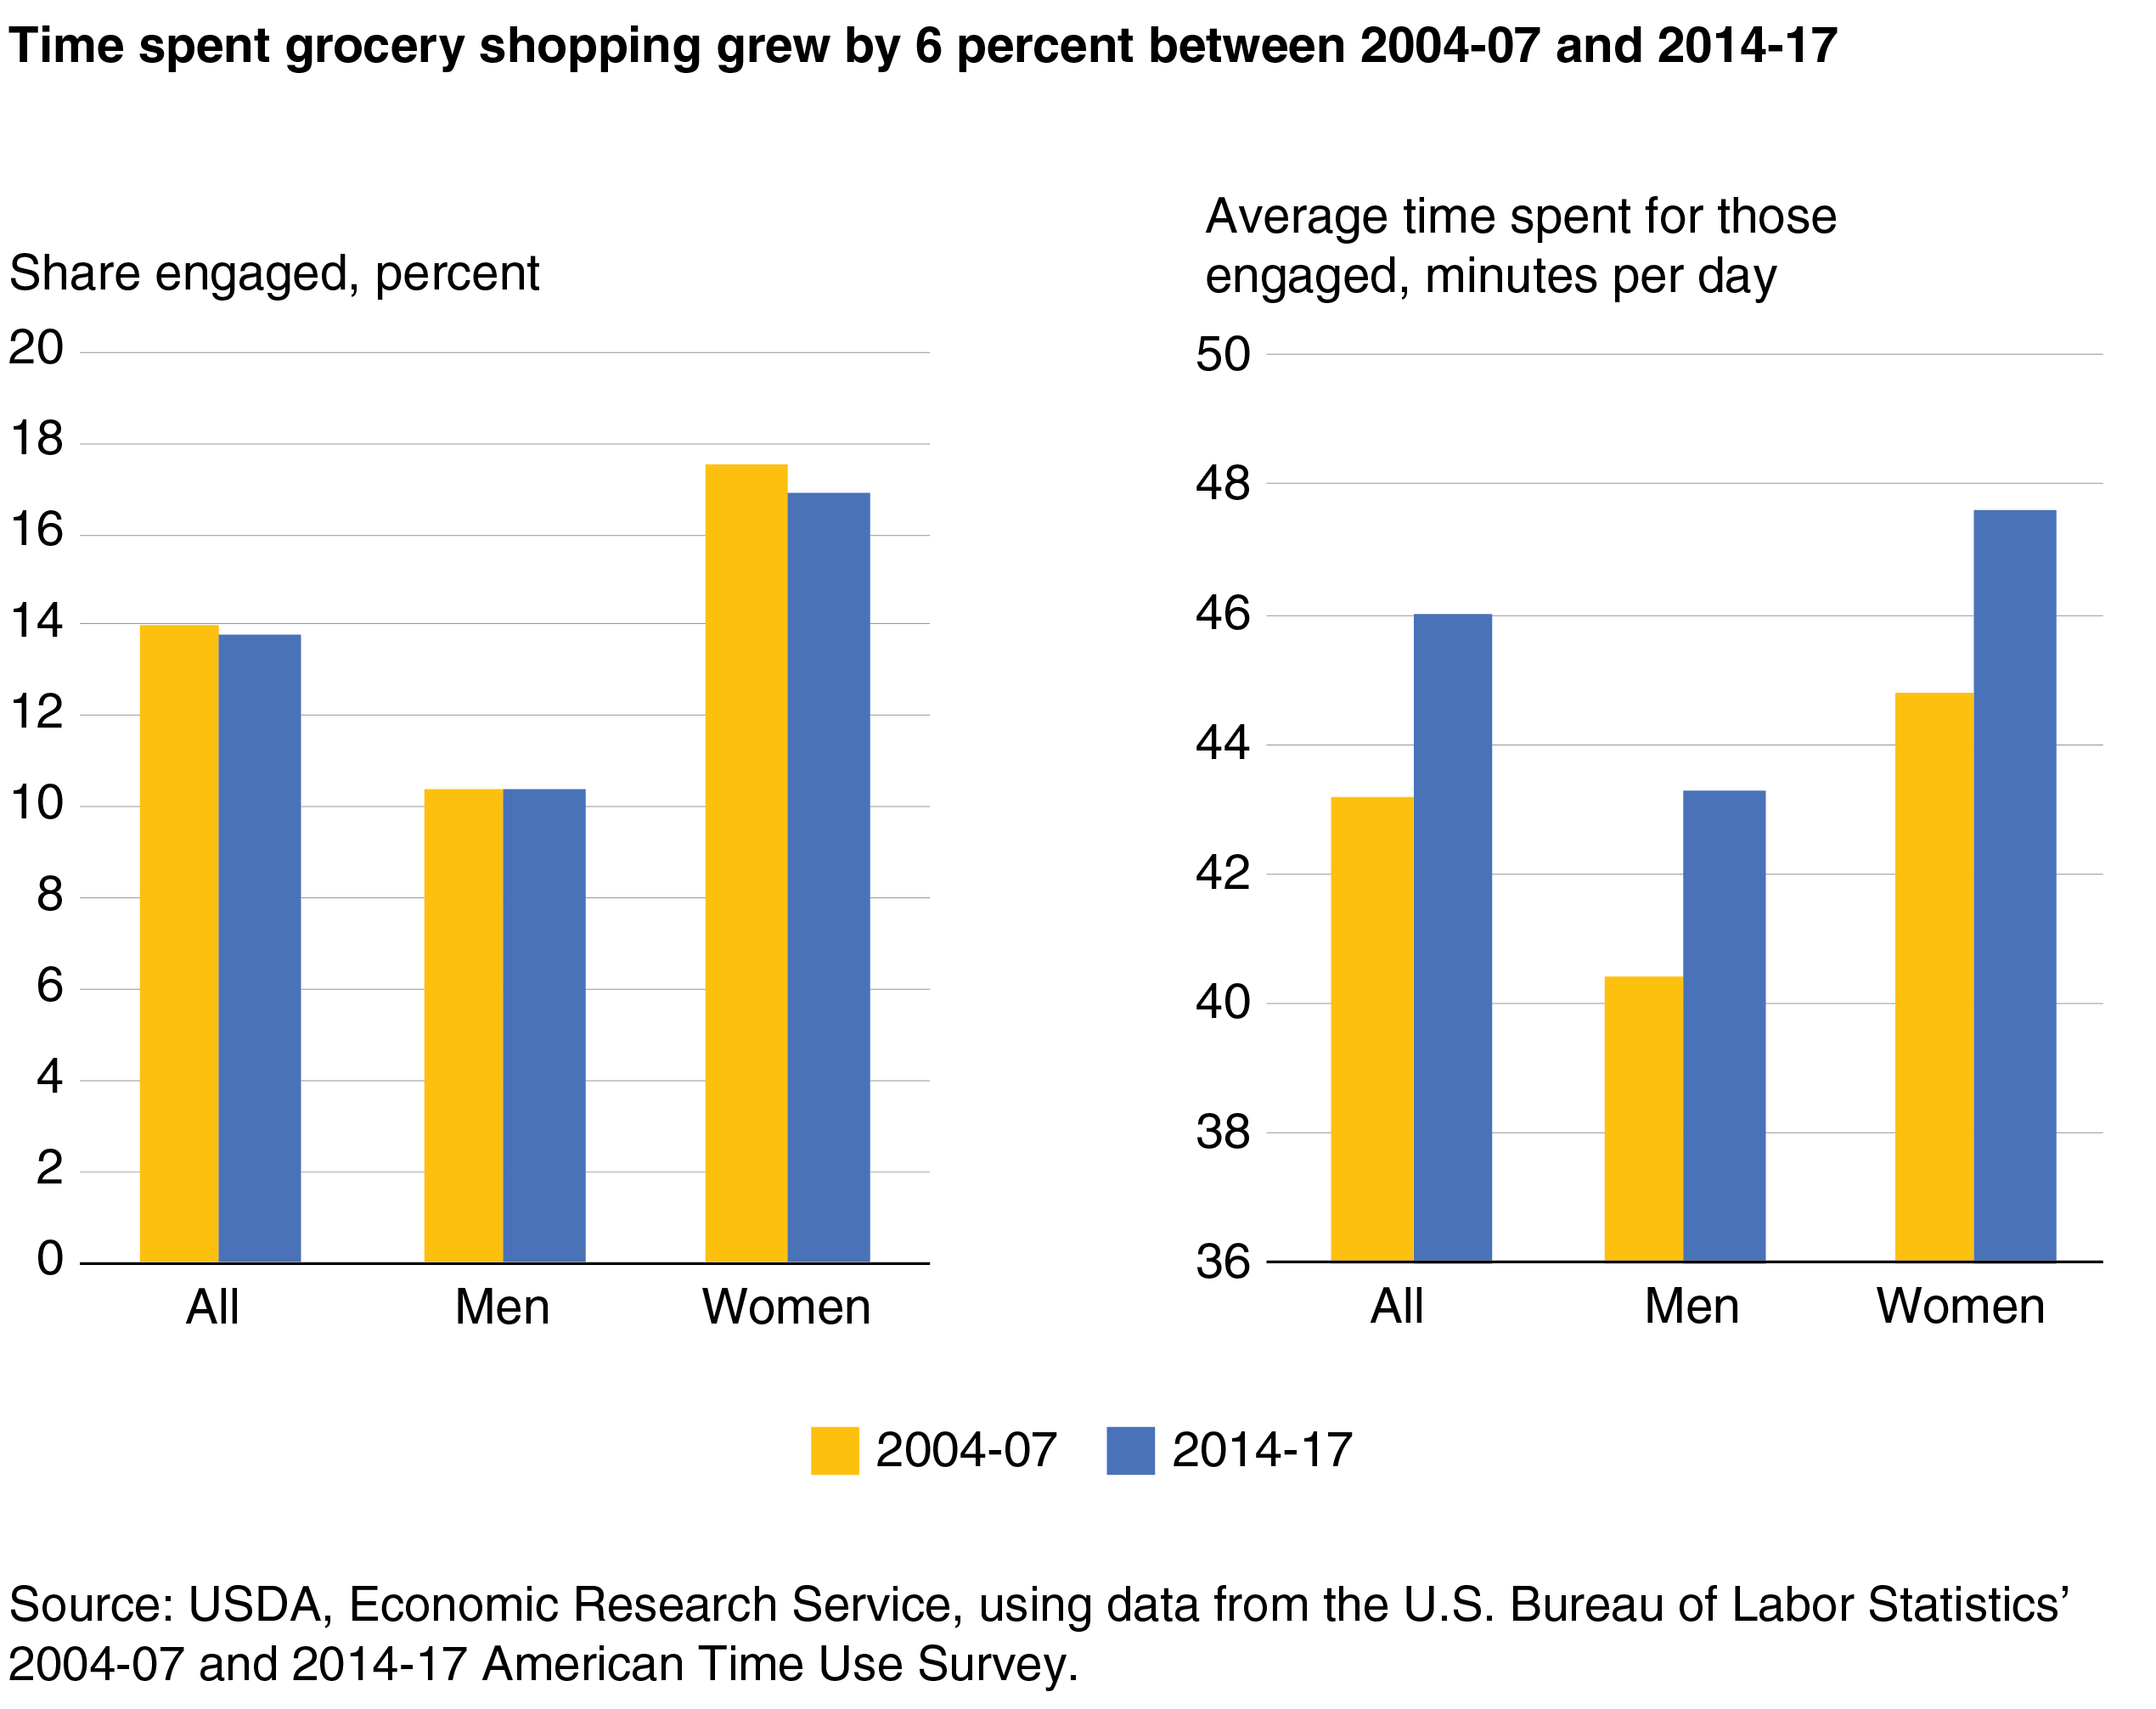
A pair of bar charts showing the percentage who engaged in grocery shopping and the average time spent for those engaged for all Americans age 15 and older, men, and women on an average day in 2004-07 and 2014-17