
Southeast Asia: Growing Potential for U.S. Agriculture
- by Ethan Sabala and Fred Gale
- 5/22/2025
Highlights
- With rising incomes and growing populations, the Southeast Asia region is a promising market for U.S. exports of food, feed, and fiber.
- The top U.S. agricultural exports to the region are soybeans and their derivatives, cotton, wheat, skim milk powder, and distillers’ dried grains.
- The United States faces competition from other top agricultural exporters to Southeast Asia, squeezing out some leading U.S. commodity exports.
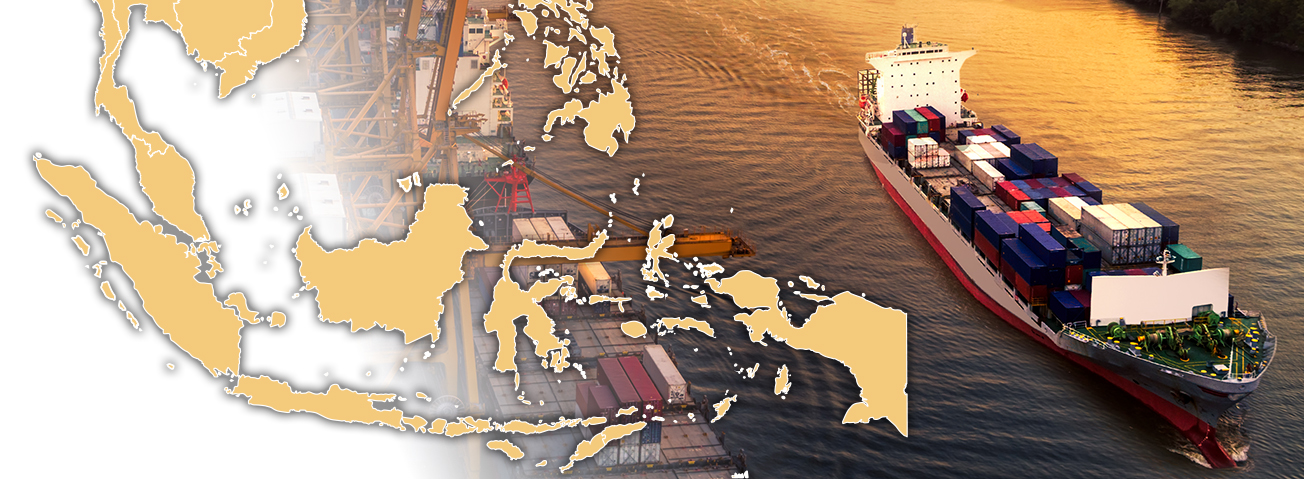
Southeast Asia offers growing export opportunities for U.S. agricultural products. The region (consisting of Brunei, Cambodia, Indonesia, Laos, Malaysia, Myanmar, the Philippines, Singapore, Thailand, Timor-Leste, and Vietnam) is the third-largest regional market for U.S. agricultural exports and is projected to expand in income and population. This growth comes when the populations of large export markets such as China, Japan, Taiwan, and South Korea have begun to plateau or decline. With an unsuitable climate for temperate crops, including many grown in the United States, Southeast Asia depends on foreign suppliers to meet its demand for these products. The region’s smaller, emerging markets offer potential as a growing overseas destination for U.S. exporters.
Southeast Asia Import Demand Increasing With Population and Income Growth
Increasing populations and higher incomes in Southeast Asia are driving up food demand and, therefore, the potential for U.S. food and fiber exports. The Southeast Asia population is projected to increase by 8 percent from 2023 to 2033, while per capita gross domestic product (GDP)—a proxy for income—is expected to increase by almost 26 percent (see table below). Within the region, these growth factors are most notable in Indonesia, the Philippines, and Vietnam. Projected population growth for these three countries ranges from 8.2 million people (8.0 percent) in Vietnam to 18.5 million people (6.8 percent) in Indonesia. GDP growth projections range from an additional $1,484 per person (39.8 percent) in the Philippines to $2,151 (50.2 percent) in Indonesia. Malaysia is expected to experience significant growth as well, with a projected population increase of 3.1 million people (9.3 percent) and per capita GDP growth of $4,434 (37.3 percent).
| Population | Per capita GDP (2015 U.S. dollars) | |||||
|---|---|---|---|---|---|---|
| 2023 | Growth (2023–33) | 2023 | Growth (2023–33) | |||
| Persons | Persons | Percent | Dollars | Dollars | Percent | |
| Southeast Asia | 685,544,355 | 54,837,910 | 8.0 | 12,357 | 3,180 | 25.7 |
| Indonesia | 274,286,094 | 18,539,629 | 6.8 | 4,284 | 2,151 | 50.2 |
| Philippines | 115,708,905 | 17,596,371 | 15.2 | 3,732 | 1,484 | 39.8 |
| Vietnam | 102,544,485 | 8,216,079 | 8.0 | 2,968 | 2,095 | 70.6 |
| Thailand | 69,645,864 | 454,291 | 0.7 | 6,690 | 2,494 | 37.3 |
| Myanmar | 57,970,218 | 3,838,893 | 6.6 | 1,293 | 250 | 19.3 |
| Malaysia | 33,465,965 | 3,119,765 | 9.3 | 11,892 | 4,434 | 37.3 |
| Cambodia | 17,475,727 | 1,587,360 | 9.1 | 1,504 | 1,007 | 67.0 |
| Laos | 7,766,208 | 919,104 | 11.8 | 2,662 | 1,041 | 39.1 |
| Singapore | 6,195,455 | 500,101 | 8.1 | 61,571 | 13,160 | 21.4 |
| Brunei | 485,433 | 66,318 | 13.7 | 26,972 | 3,687 | 13.7 |
Note: GDP = Gross Domestic Product. Values are in 2015 U.S. dollars. The USDA, Economic Research Service Macroeconomic dataset (2023) does not include Timor-Leste.
Source: USDA, Economic Research Service using data from Macroeconomic Dataset (2023).
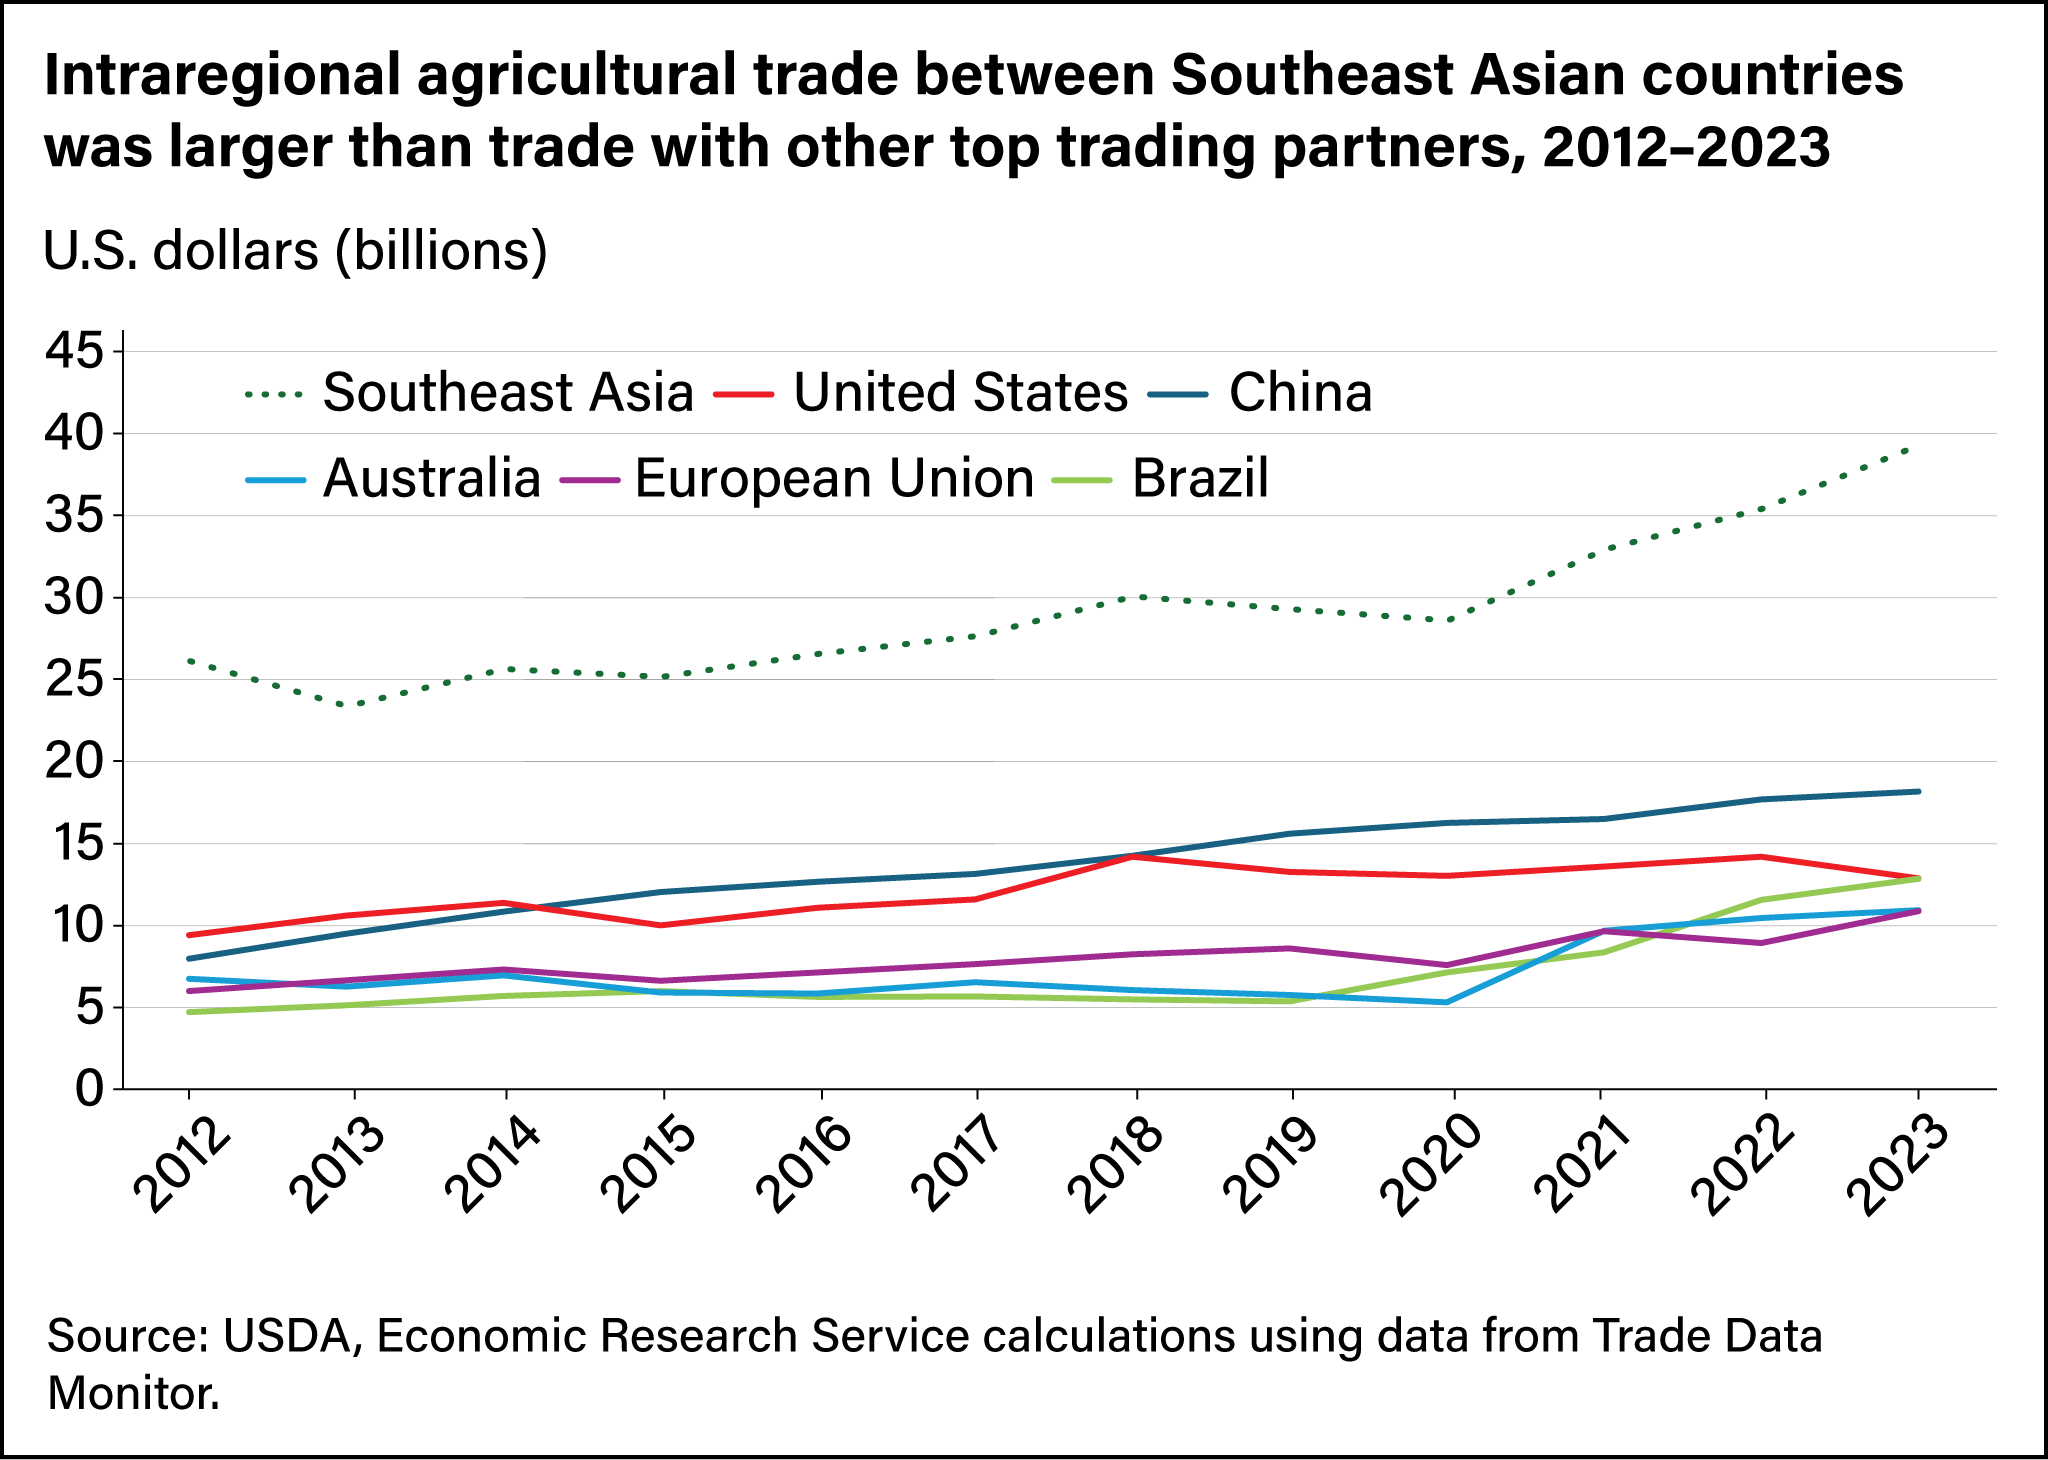
The United States was the largest foreign supplier of agricultural products to the Southeast Asia region until 2015, when China took over the top spot (see chart below). Brazil, Australia, and the European Union (EU) round out the rest of the top five foreign suppliers, with export values for Brazil and Australia accelerating from 2020 to 2023. This rapid increase in exports propelled Brazil and Australia past the EU, which fell from the third-largest foreign supplier of agricultural goods to Southeast Asia in 2021 to the fifth largest in 2023. Intraregional trade between countries within Southeast Asia made up the largest amount of Southeast Asia’s agricultural imports.
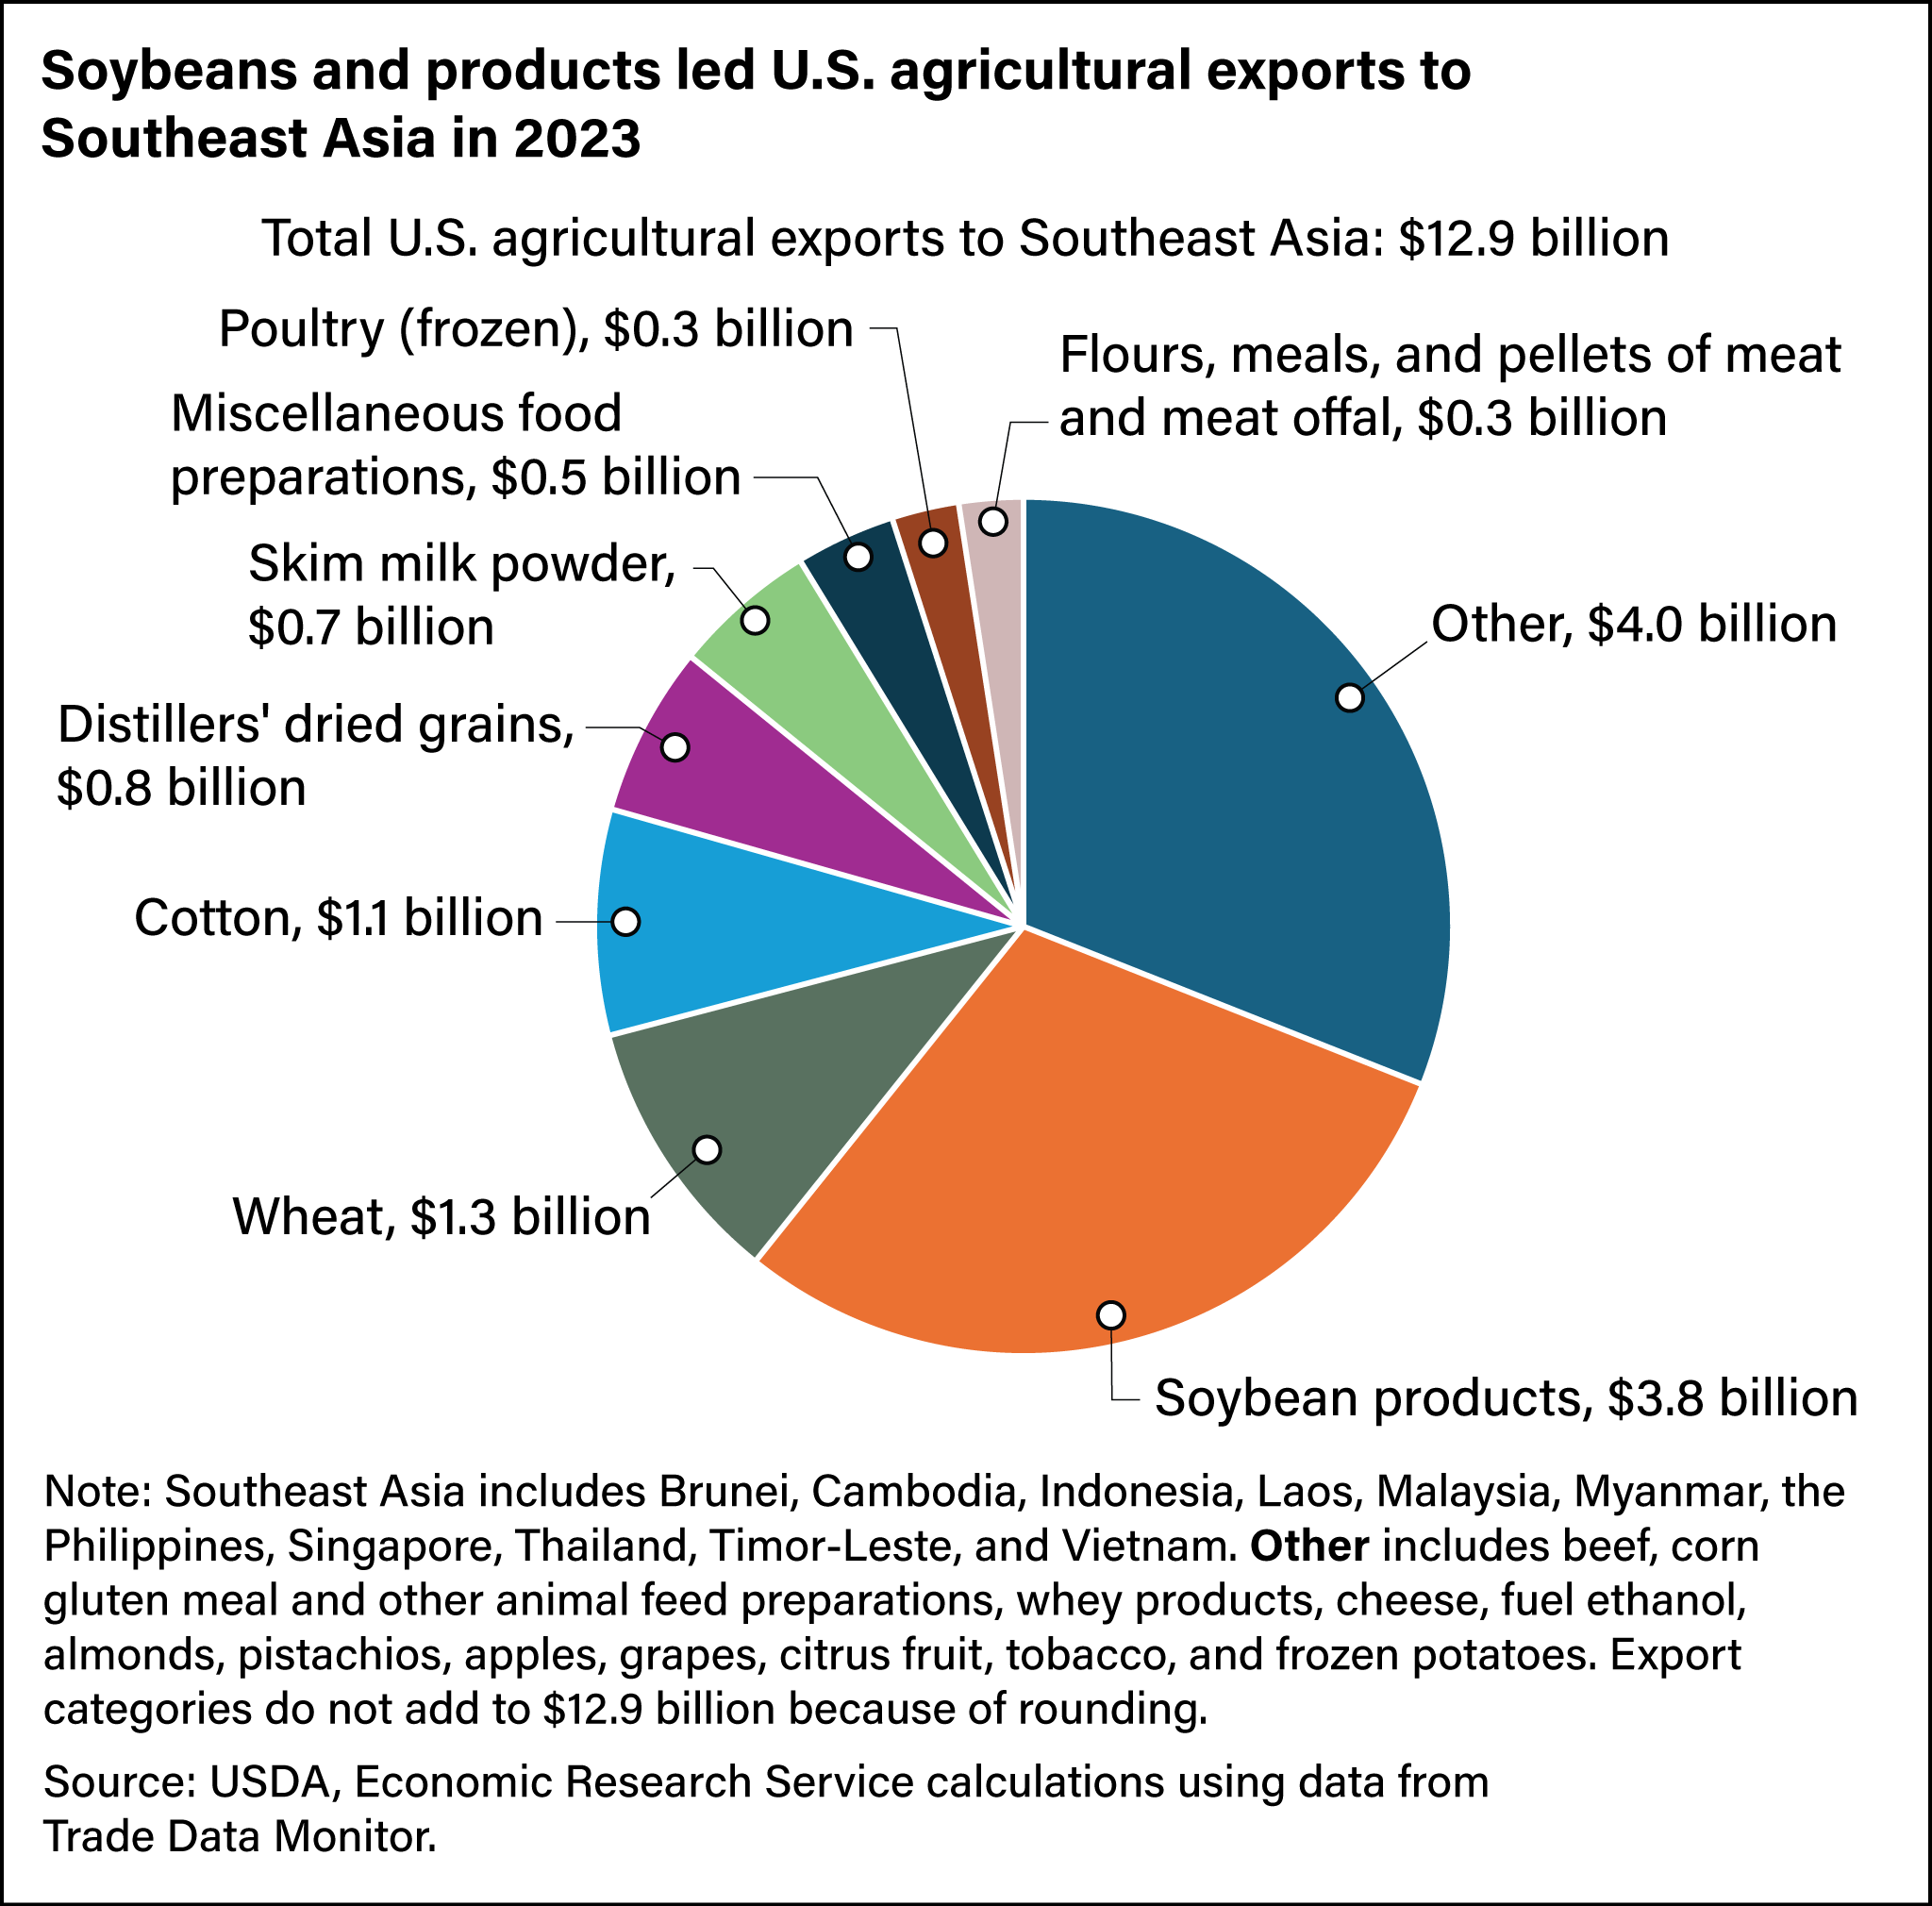
The top U.S. agricultural exports to Southeast Asia are soybeans and their derivatives, wheat, cotton, skim milk powder, and distillers’ dried grains, often referred to as DDGS. Combined U.S. exports of these products to Southeast Asia were valued at almost $7.8 billion in 2023, more than half the value of all U.S. agricultural exports to the region that year (see chart below). Another major agricultural product group the United States exports to Southeast Asia is miscellaneous food preparations, which includes nondairy creamer, coconut milk, bean curd, ice cream, as well as a variety of concentrates, syrups, extracts, and supplements. These items, along with poultry, flours, meals, and pellets of meat and meat offal, were all valued at $1.1 billion in 2023. Other products, including corn gluten meal and other animal feed preparations, whey products, cheese, fuel ethanol, almonds, pistachios, apples, grapes, citrus fruit, tobacco, and frozen potatoes, made up $4.0 billion.
A number of U.S. products face tough competition from other exporters. Among the top U.S. exports, soybeans and products, cotton, wheat, skim milk powder, DDGS, food preparations, poultry and beef compete most heavily. Corn, animal feed, and rice were not in the top 10 U.S. agricultural commodities exported to Southeast Asia in 2023 even though they were among the largest commodities the region imported. On the other hand, U.S. soybean flour made up nearly 99 percent of Southeast Asia’s soybean flour imports, and U.S. DDGS made up 95 percent of those imports from 2015 to 2023. Globally, the United States exports more than 90 percent of the world’s soybean flour and DDGS exports.
| Southeast Asia | Brazil | Australia | New Zealand | European Union | China | India | Canada | Argentina | |
|---|---|---|---|---|---|---|---|---|---|
| Soybeans | |||||||||
| Soybean flour | |||||||||
| Soybean meal | |||||||||
| Cotton | |||||||||
| Wheat | |||||||||
| Skim milk powder | |||||||||
| DDGS | |||||||||
| Food preparations | |||||||||
| Poultry | |||||||||
| Beef | |||||||||
| Corn | |||||||||
| Animal feed | |||||||||
| Rice |
Note: DDGS = distillers' dried grains with solubles. Green shading indicates country/region is major competitor of the United States for those products. A country/region is considered a “major competitor” if its volume of exports to Southeast Asia from 2015 to 2023 is among the top five and the export share is greater than 5 percent of the total. Note, however, the United States supplied more than 95 percent of the soybean flour and DDGS exported to Southeast Asia from 2015 to 2023, so the next two largest exporters were included as “major exporters” regardless of export share. While not in the top 10 U.S. exports to Southeast Asia, corn, animal feed, and rice are among the region’s largest commodities imported. Ukraine also is a major exporter of wheat to Southeast Asia, and Pakistan is a major exporter of rice to Southeast Asia.
Source: USDA, Economic Research Service calculations using data from Trade Data Monitor.
Competition and Opportunity for Southeast Asia’s Major Food and Feed Imports
Competitors to U.S. agricultural exports have gained market share in Southeast Asia for several reasons, including price, geography, and preferential treatment extended through trade agreements. Like the United States, other competitors face trade barriers and disruptions that present opportunities and challenges for U.S. exports.
All Southeast Asian countries except Timor-Leste are members of the Association of Southeast Asian Nations (ASEAN) and the ASEAN Free Trade Area in which intraregional trade is duty free. Moreover, ASEAN has trade agreements with several countries outside the region including Australia, New Zealand, China, and India. While Southeast Asian countries, along with the United States, are all members of the World Trade Organization (WTO), tariffs under the WTO often are higher than those negotiated under bilateral or other multilateral trade agreements. Currently, the United States has one bilateral trade agreement in the Southeast Asia region, the U.S.-Singapore Free Trade Agreement.
Southeast Asia: Intraregional Trade
Food preparations and poultry products traded between countries within Southeast Asia compete with U.S. agricultural exports to the region. Corn, animal feed preparations, and rice also are traded intraregionally, but the United States exports few of these commodities to Southeast Asia. Southeast Asian countries also sell a large amount of palm oil, tropical fruits, sugar, food and beverage ingredients, and specialty cigarettes and tobacco products to one another, all of which do not compete directly with U.S. products, making Southeast Asia a complementary agricultural trade partner.
Brazil and Argentina
Brazil is the primary U.S. competitor in the Southeast Asian market because it exports many of the same commodities as the United States. Brazil supplies soybeans, soybean meal, cotton, poultry, beef, and corn to Southeast Asia. Argentina exports large amounts of soybean meal, corn, and wheat to the region. Although the United States was the largest corn exporter globally from 2015 to 2022 and corn was the second-largest U.S. agricultural export, the Nation exports little corn to Southeast Asia. Brazil and Argentina supply most of the region’s corn imports. Neither Brazil nor Argentina has any trade agreements in Southeast Asia, so corn exported from Brazil and Argentina does not receive preferential treatment, in terms of import tariffs, compared with U.S. corn.
Australia and New Zealand
Australia and New Zealand sell cotton, wheat, dairy products, and beef to Southeast Asia. Since 2020, Australia’s cotton and wheat exports to Southeast Asia have surged to record highs, increasing by 1,651 percent and 233 percent, respectively, from 2020 to 2022. In 2020, China (Australia’s largest cotton importer in 2019) placed an import ban on Australian cotton, which caused a surge of Australian cotton onto the global market, making cotton prices attractive to prospective buyers in Southeast Asia. However, China did not restrict imports of Australian wheat. Moreover, Australian production of cotton and wheat both soared from 2020 to 2022 as the country recovered from a significant drought in 2019.
European Union (EU)
EU exports of dairy products, poultry, beef, and animal feed preparations compete with U.S. products in Southeast Asia. EU poultry exports to the region dropped after peaking in 2019 following outbreaks of highly pathogenic avian influenza (HPAI) in several of the EU’s largest poultry-exporting countries. After these outbreaks, the Philippines, Singapore, and Vietnam imposed restrictions on poultry products from the EU, opening the market for U.S. exports of poultry products to those countries.
India
India is the largest supplier of beef and rice to Southeast Asia and, in some years, has supplied a significant amount of cotton to the region. India is, by far, the world’s largest exporter of rice because of the sheer abundance produced in the country and relatively low export price. For these reasons, India is the largest foreign supplier of rice to Southeast Asia. India’s beef exports to Southeast Asia largely consist of low-cost water buffalo culled from India’s dairy herd. Indian exporters also can export halal-certified beef to the predominantly Muslim countries in Southeast Asia. However, because Indian beef products differ in price and quality from U.S. beef products, direct competition between the two is minimal.
Canada
Canada’s exports of wheat, distillers’ dried grains, and food preparations compete with U.S. goods in Southeast Asia. Canada’s DDGS exports are minor in comparison, however, as U.S.-origin DDGS on average made up 95 percent of the region’s DDGS imports from 2015 to 2022. Southeast Asia’s imports of Canadian food preparations products are generally minor when compared with U.S. products. Canadian wheat competes with U.S. wheat in Southeast Asia, but both countries have fallen behind Australia since 2020.
China
China is the top foreign supplier of agricultural goods to Southeast Asia, but the exports that compete most with the United States are food and animal feed preparations. Many of China’s agricultural exports to Southeast Asia include commodities the United States does not export in large quantities to the region, including vegetables and deciduous fruits such as apples and berries. China has a significant geographical advantage when exporting perishable products to Southeast Asia and is the leading supplier of all but one of Southeast Asia’s top seven fruit and vegetable imports with an average market share of 65 percent. Conversely, the United States falls out of the top 10 for several specialty crops and has an average market share of 2.6 percent in that category. China’s strong ties to several Southeast Asian nations (Cambodia, Laos, and Myanmar) and numerous trade agreements that include all ASEAN member countries favor trade with the region.
| China | United States | |||
|---|---|---|---|---|
| Share (percent) | Rank | Share (percent) | Rank | |
| Apples | 64.29 | 1 | 10.66 | 3 |
| Grapes | 60.86 | 1 | 7.28 | 3 |
| Garlic | 98.27 | 1 | 0.001 | 16 |
| Mandarins | 86.24 | 1 | 0.06 | 14 |
| Pears | 88.92 | 1 | 0.08 | 10 |
| Peanuts | 6.62 | 2 | 0.04 | 9 |
| Onions/shallots | 47.08 | 1 | 0.03 | 17 |
Source: USDA, Economic Research Service calculations using data from Trade Data Monitor.
The United States has increased its engagement in Southeast Asia in recent years with the Indo-Pacific Economic Framework for Prosperity (IPEF) in 2022 and the Regional Agricultural Promotion Program (RAPP) in 2023. IPEF includes seven Southeast Asian countries and offers an alternative to traditional trade agreements. The Southeast Asian countries not included in IPEF are Cambodia, Laos, and Myanmar, which all have strong ties to China. RAPP is focused on promoting U.S. agricultural products in nontraditional markets, such as Southeast Asia.
This article is drawn from:
- Sabala, E. & Gale, F. (2024). U.S. Agricultural Exports in Southeast Asia. U.S. Department of Agriculture, Economic Research Service. EIB-277.
You may also like:
- Davis, C.G. & Cessna, J. (2020). Prospects for Growth in U.S. Dairy Exports to Southeast Asia. U.S. Department of Agriculture, Economic Research Service. ERR-278.
- Padilla, S., Ufer, D.J., Morgan, S. & Link, N. (2023). U.S. Export Competitiveness in Select Crop Markets. U.S. Department of Agriculture, Economic Research Service. ERR-313.
- Ufer, D.J., Padilla, S. & Link, N. (2023). U.S. Trade Performance and Position in Global Meat, Poultry, and Dairy Exports. U.S. Department of Agriculture, Economic Research Service. ERR-312.
- Valdes, C., Gillespie, J. & Dohlman, E. (2023). Soybean Production, Marketing Costs, and Export Competitiveness in Brazil and the United States. U.S. Department of Agriculture, Economic Research Service. EIB-262.