
As Rural Populations Grow Older, Communities Increasingly Rely on Smaller Labor Force
- by Richelle L. Winkler
- 5/20/2025
Rural populations are shifting older as people live longer, birth rates decline, younger people move out of rural areas, and older people decide to spend their retirement years in rural settings. By the end of 2025, the youngest of the Baby Boom generation (born between 1946 and 1964)—a large generation in total numbers—will have turned 61 and the oldest reached age 79, meaning that many are now in or looking at retirement. Meanwhile, working-age (15–64 years) populations in rural counties are shrinking. As a result, rural populations are becoming more concentrated in younger and older age groups. These age groups tend to require more economic support and caregiving.
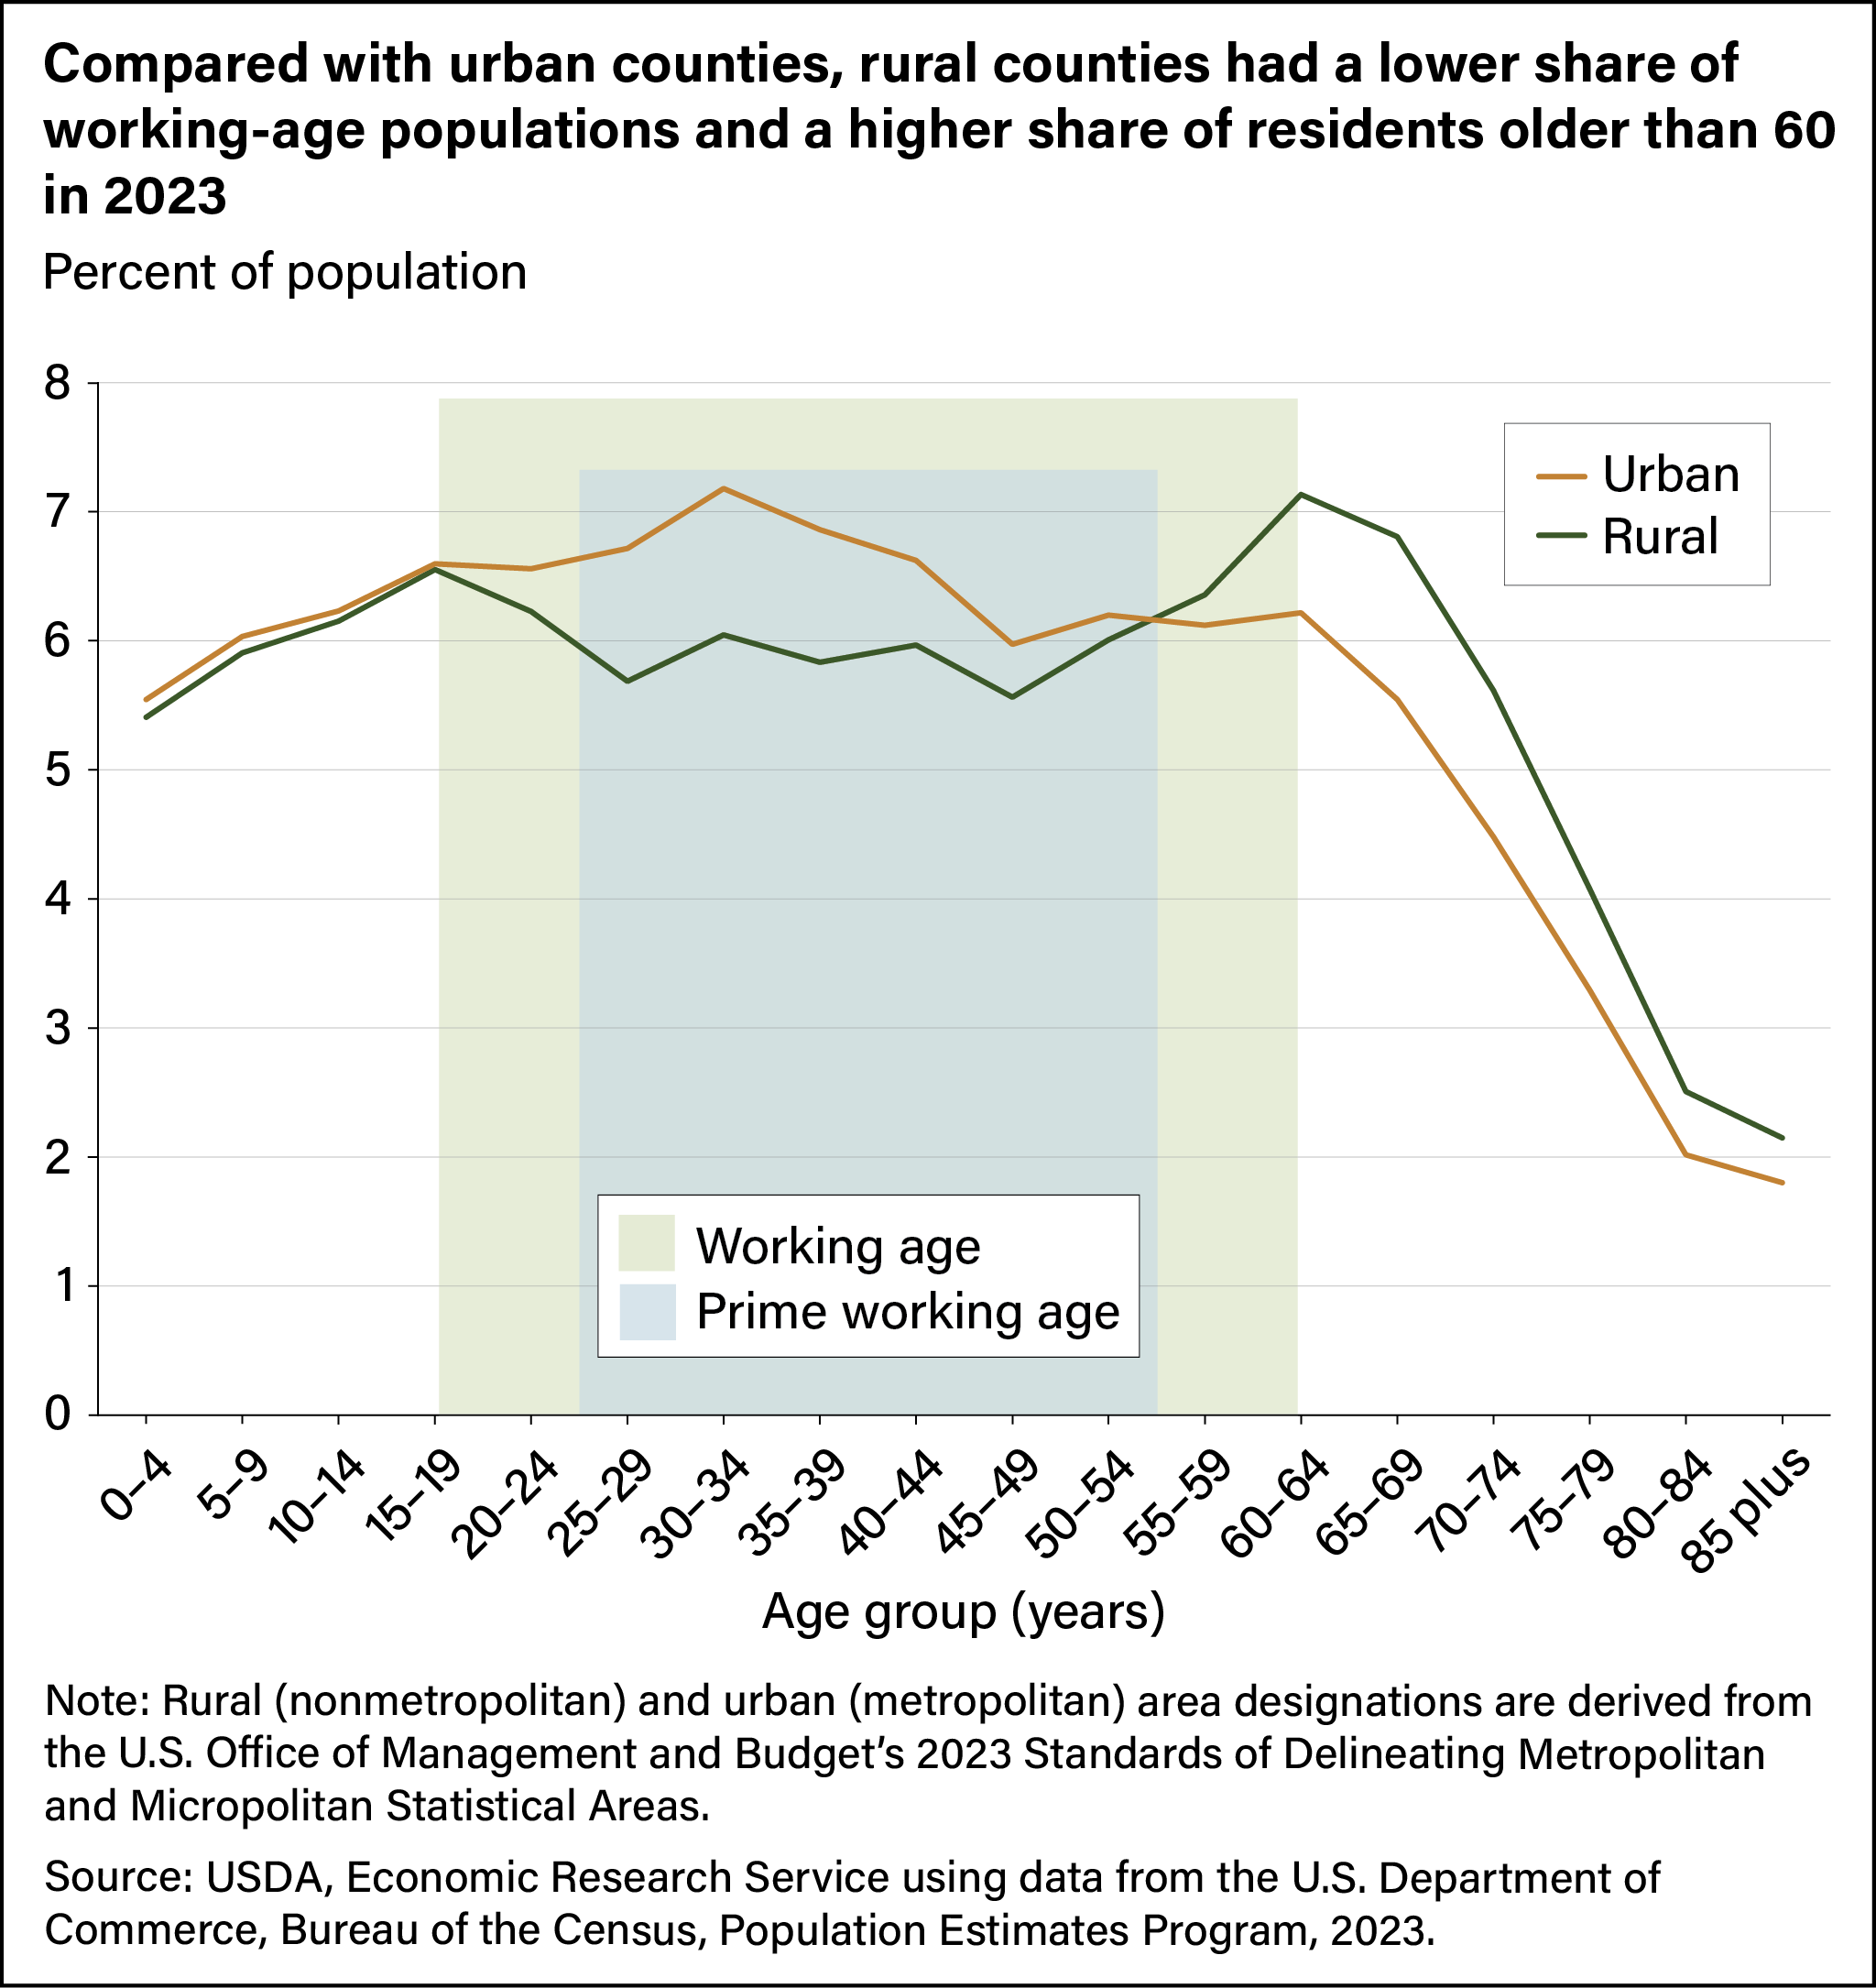
In 2023, older groups made up a larger share of the rural population than in urban areas, and rural counties had smaller proportions of people under age 55 (see chart below). The share of residents between the prime working ages of 25 to 54, when labor force participation rates are at their highest, was especially low for rural counties. The number of rural people between the ages of 15 and 64 (a broader working-age group) has fallen in recent years, dropping to 28 million in 2023 from more than 30 million in 2010. At the same time, the number of rural residents aged 65 and over grew from 7.4 million in 2010 to 9.7 million in 2023. This combination of shrinking working-age populations and growing older populations means communities are increasingly relying on a relatively small labor force to provide services and care for groups at the top and bottom of the age spectrum.
Dependency ratios are a common demographic measure for researchers to compare younger and older populations with working-age populations. Higher dependency ratios indicate more social needs for caregiving, while communities with lower ratios tend to see higher labor force participation and greater economic growth. A youth dependency ratio compares the population under age 15 to the working-age population (ages 15–64). A high youth dependency ratio indicates a greater need for childcare, schools, and other services and suggests parents’ caregiving needs limit labor force participation, especially when community services are lacking. Older age dependency ratios compare those age 65 and over to the working-age population. For that group, a high ratio indicates more need for eldercare, specialized healthcare, age-sensitive infrastructure design, and other senior services.
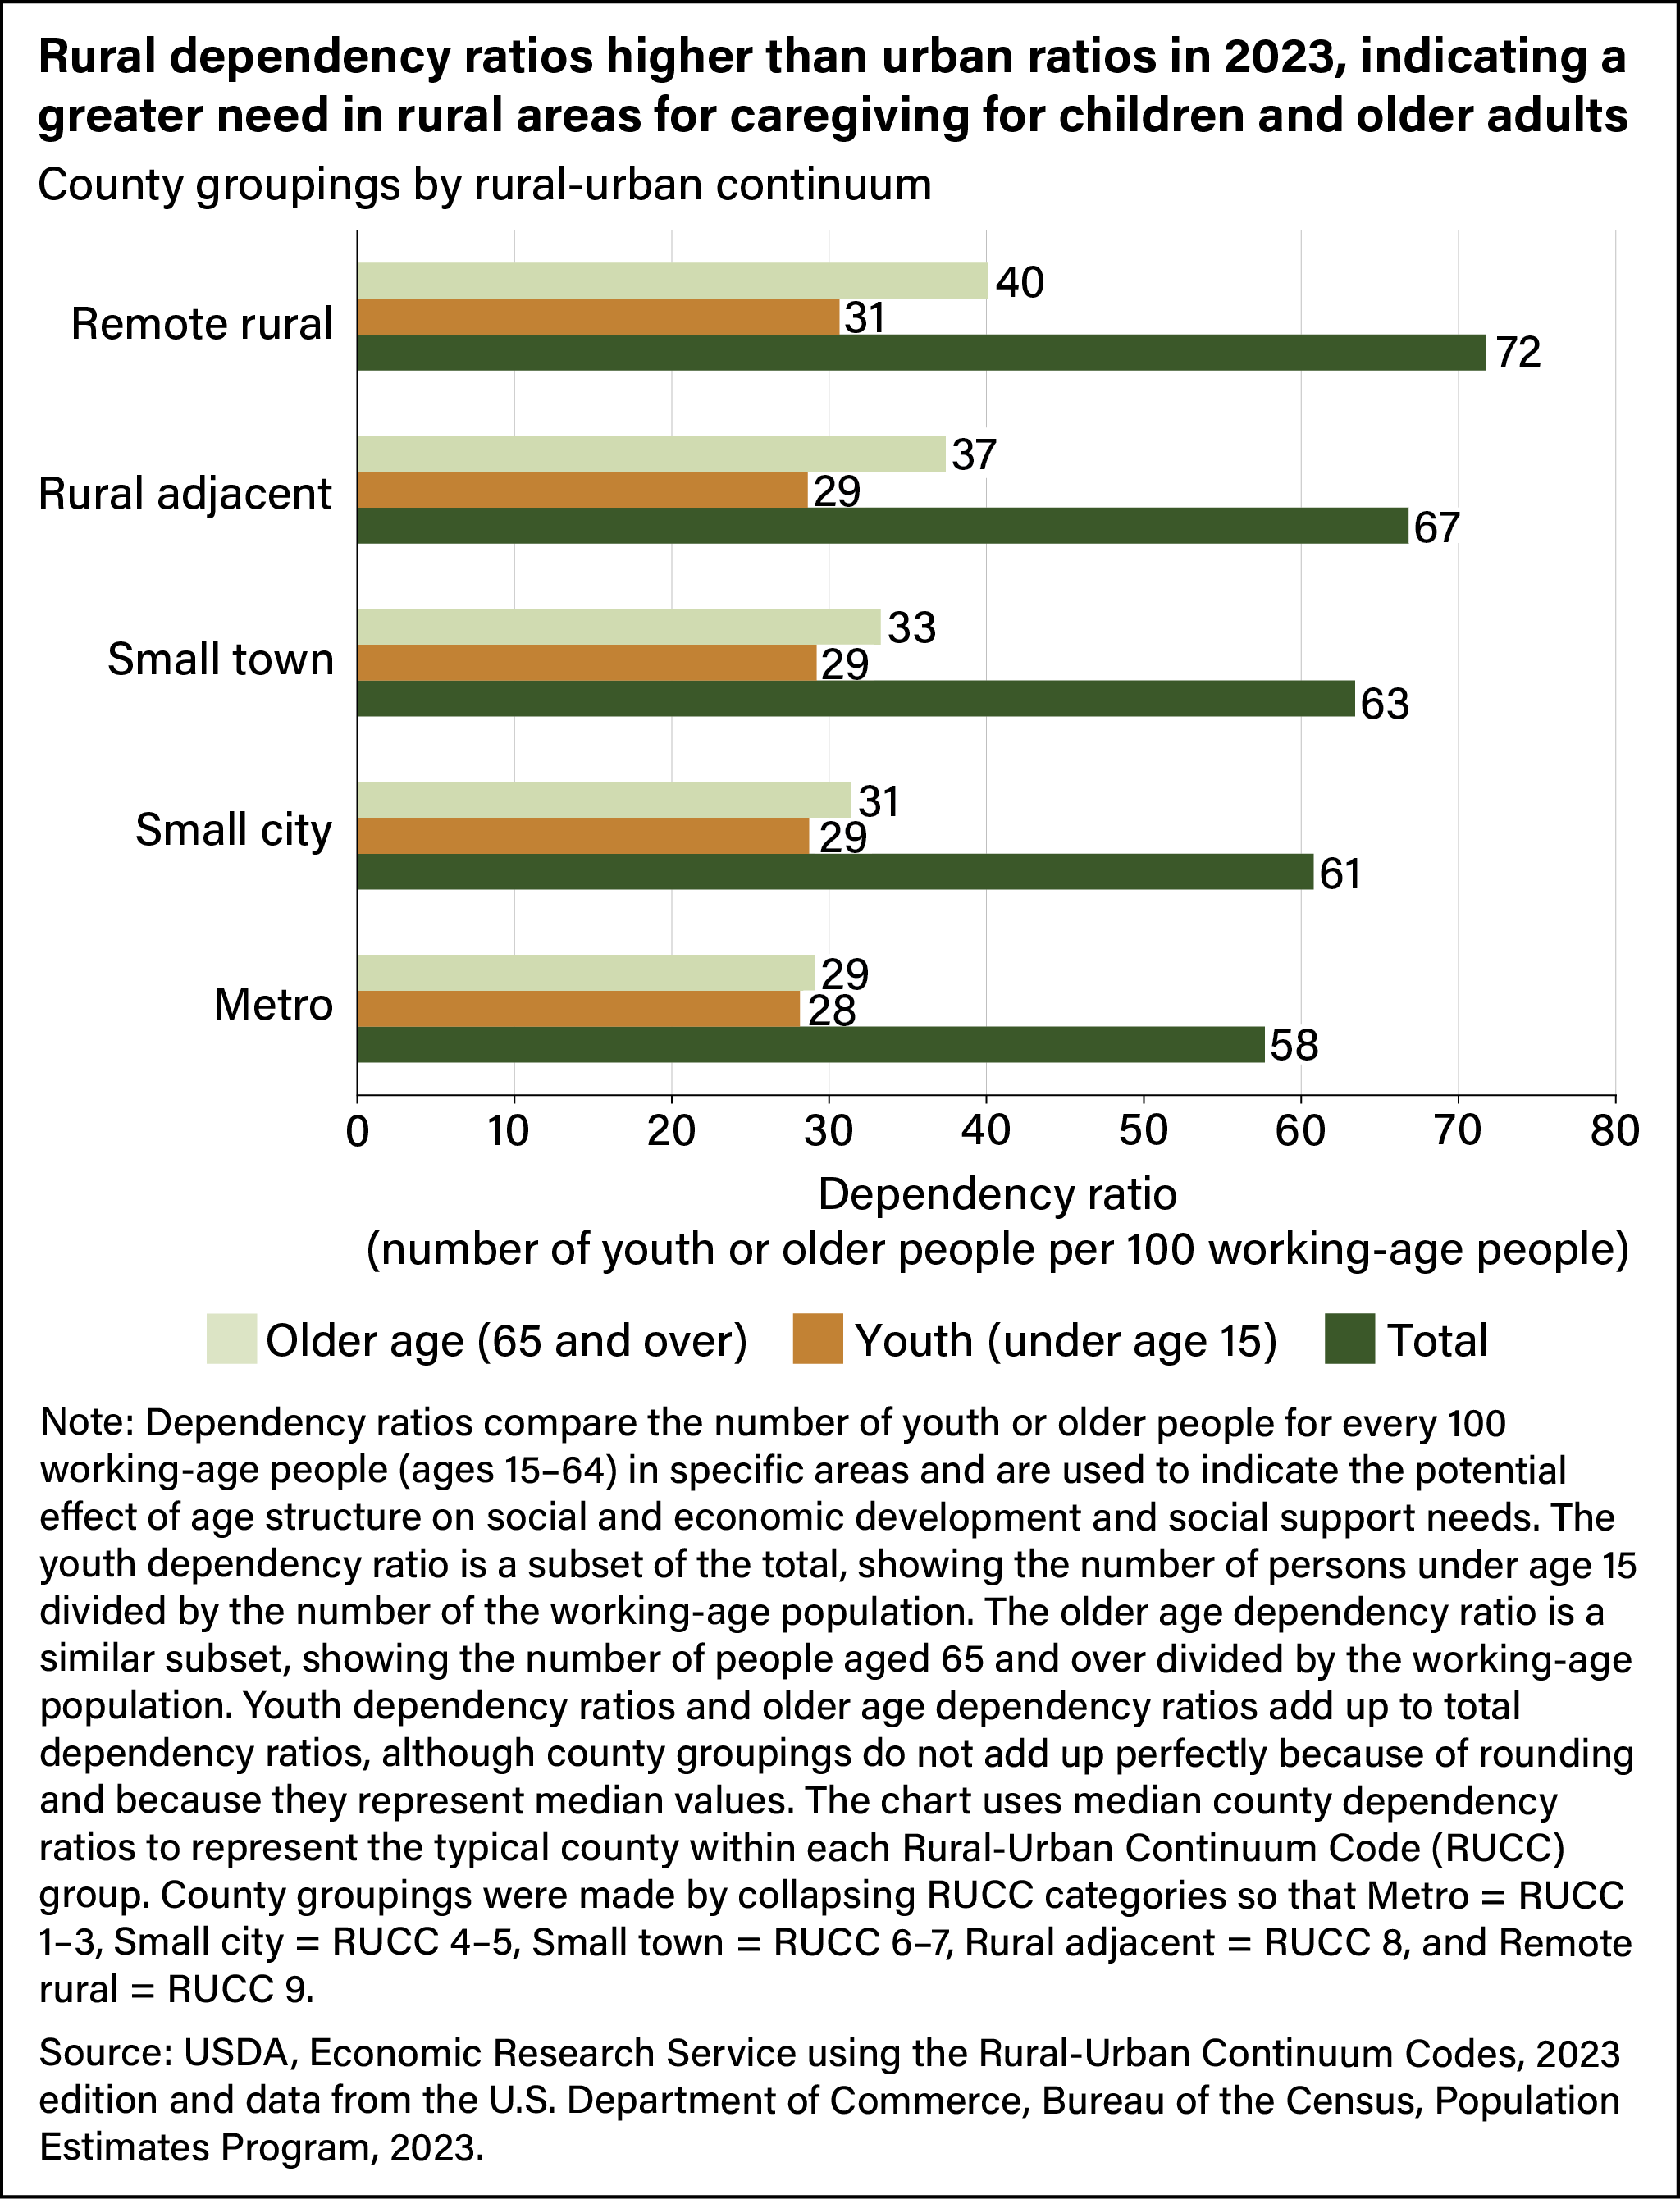
In 2023, urban counties had lower total dependency ratios than rural counties because their older age dependency ratio was lower (see chart above). However, not all rural counties are the same. Examining dependency ratios along a rural-urban continuum shows that counties with an urban population fewer than 5,000 (the classifications of “remote rural” and “rural adjacent to a metro area”) have especially high older age dependency ratios and, therefore, higher total dependency ratios. Youth dependency ratios, however, were similar across counties. This indicates that in remote and rural-adjacent counties, a relatively small working-age population must support a significant youth population and a relatively large older population. For example, the typical (median) remote rural county consisted of 40 older people and 31 youth per 100 working-age population. This means there was an average of 72 people at these younger and older ages per 100 working-aged people. This contrasts with a metro median of 28 younger and 29 older people per 100 working aged people.
Older people contribute to rural communities and economies through retirement income, benefits transfers, skills, social networks, and experience. However, high dependency ratios can pose challenges for maintaining the infrastructure and work force necessary to support younger and older age groups (such as childcare and eldercare services) while maintaining a healthy economy.
This article is drawn from:
- Farrigan, T., Genetin, B., Sanders, A., Pender, J., Thomas (Conley), K.L., Winkler, R.L. & Cromartie, J. (2024). Rural America at a Glance: 2024 Edition. U.S. Department of Agriculture, Economic Research Service. EIB-282.
You may also like:
- Atlas of Rural and Small-Town America. (n.d.). U.S. Department of Agriculture, Economic Research Service.
- County-level Data Sets. (n.d.). U.S. Department of Agriculture, Economic Research Service.
- Rural-Urban Continuum Codes. (n.d.). U.S. Department of Agriculture, Economic Research Service.