

Food Spending Shifted in Response to Pandemic; Changes for Food Away From Home Continued Through 2022
- by Keenan Marchesi and Patrick W. McLaughlin
- 1/29/2024
Highlights
- Food-at-home (FAH) spending rose quickly across categories after the pandemic began in 2020—with several categories over 15 percent — but as of the end of 2022, changes represented about a 4.0 percent decline on average from the same time in 2021.
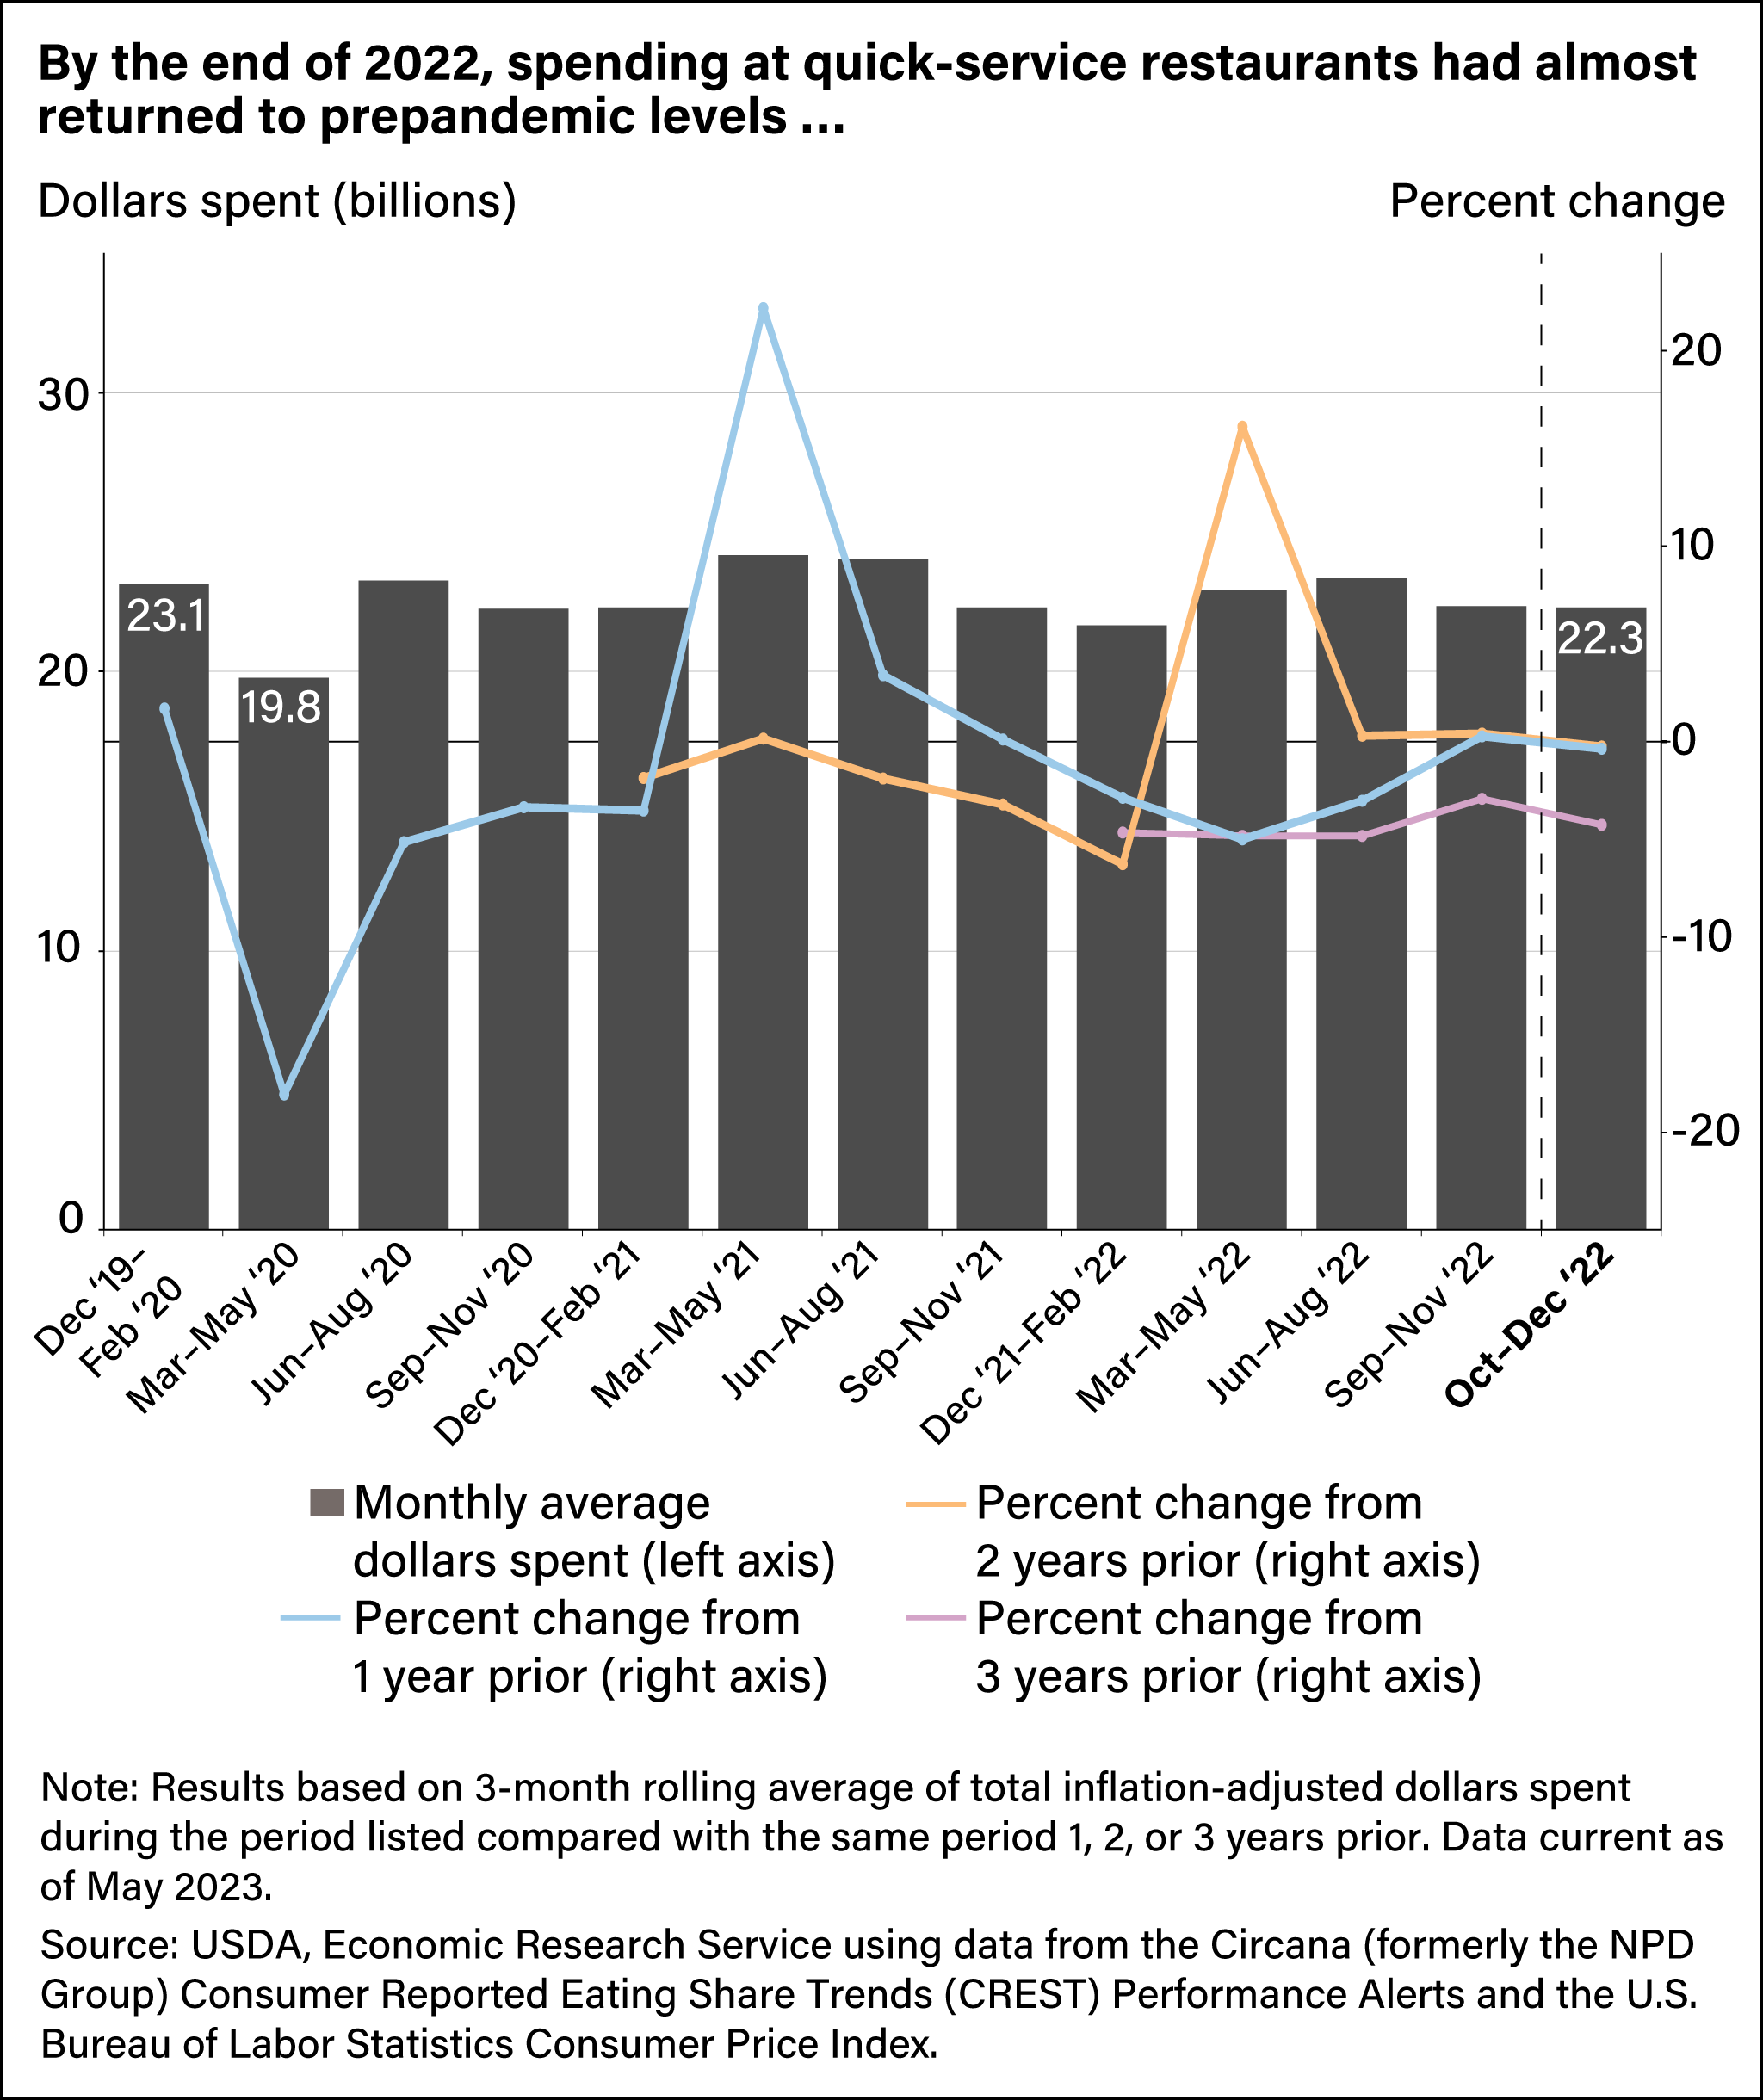
- As of October–December 2022, spending at quick-service restaurants remained about 4 percent lower than it was 3 years earlier, while full-service restaurant spending was still down about 20 percent.
- Restaurant spending via delivery services became far more common early in the pandemic and continued to be popular throughout 2022, while on-premises spending remained sluggish compared with prepandemic levels.
The Coronavirus (COVID-19) pandemic widely disrupted daily life, including which foods people bought and where they bought them. Following the pandemic declaration in March 2020, States and local governments across the country implemented public safety measures that limited access to in-person activities, closed or restricted businesses such as restaurants, and often invoked stay-at-home orders. At the same time, the United States experienced an economic downturn marked by an increase in unemployment rates. Supply-chain issues affected transportation of food from producers, consumers found it more difficult to safely access adequate food, and State and Federal Governments implemented multifaceted changes in food assistance. All these consequences of the pandemic meant unprecedented changes to spending on and acquisition of food at home (FAH) and food away from home (FAFH).
USDA, Economic Research Service (ERS) researchers used several proprietary datasets to document the shifts in food spending and acquisition behavior throughout the pandemic. They tracked changes in FAH and FAFH expenditures by comparing year-over-year percent changes in the inflation-adjusted dollars spent at food retailers such as grocery stores with year-over-year percent changes in FAFH transactions at restaurants on a weekly basis. While total annual food spending levels had recovered from pandemic-related shocks as of 2021, three ERS working papers documented that some pandemic-induced changes in what people were buying for food at home and where and how they were purchasing food away from home continued throughout 2022.
Food-at-Home Spending Differed by Food Category
U.S. consumers shifted their food purchases to food at home (FAH) during the first year of the pandemic, as evidenced by large increases in FAH sales. During the first year of the pandemic (March 15, 2020–March 7, 2021), average weekly FAH spending grew about 12.6 percent from the year earlier (March 16, 2019–March 8, 2020). While sales of all FAH categories rose at least 6 percent, some categories saw higher-than-average changes in sales, including vegetables (15.2 percent), sugar and sweeteners (14.9 percent), grains (14.7 percent), fats and oils (20.2 percent), and alcohol (15.3 percent).
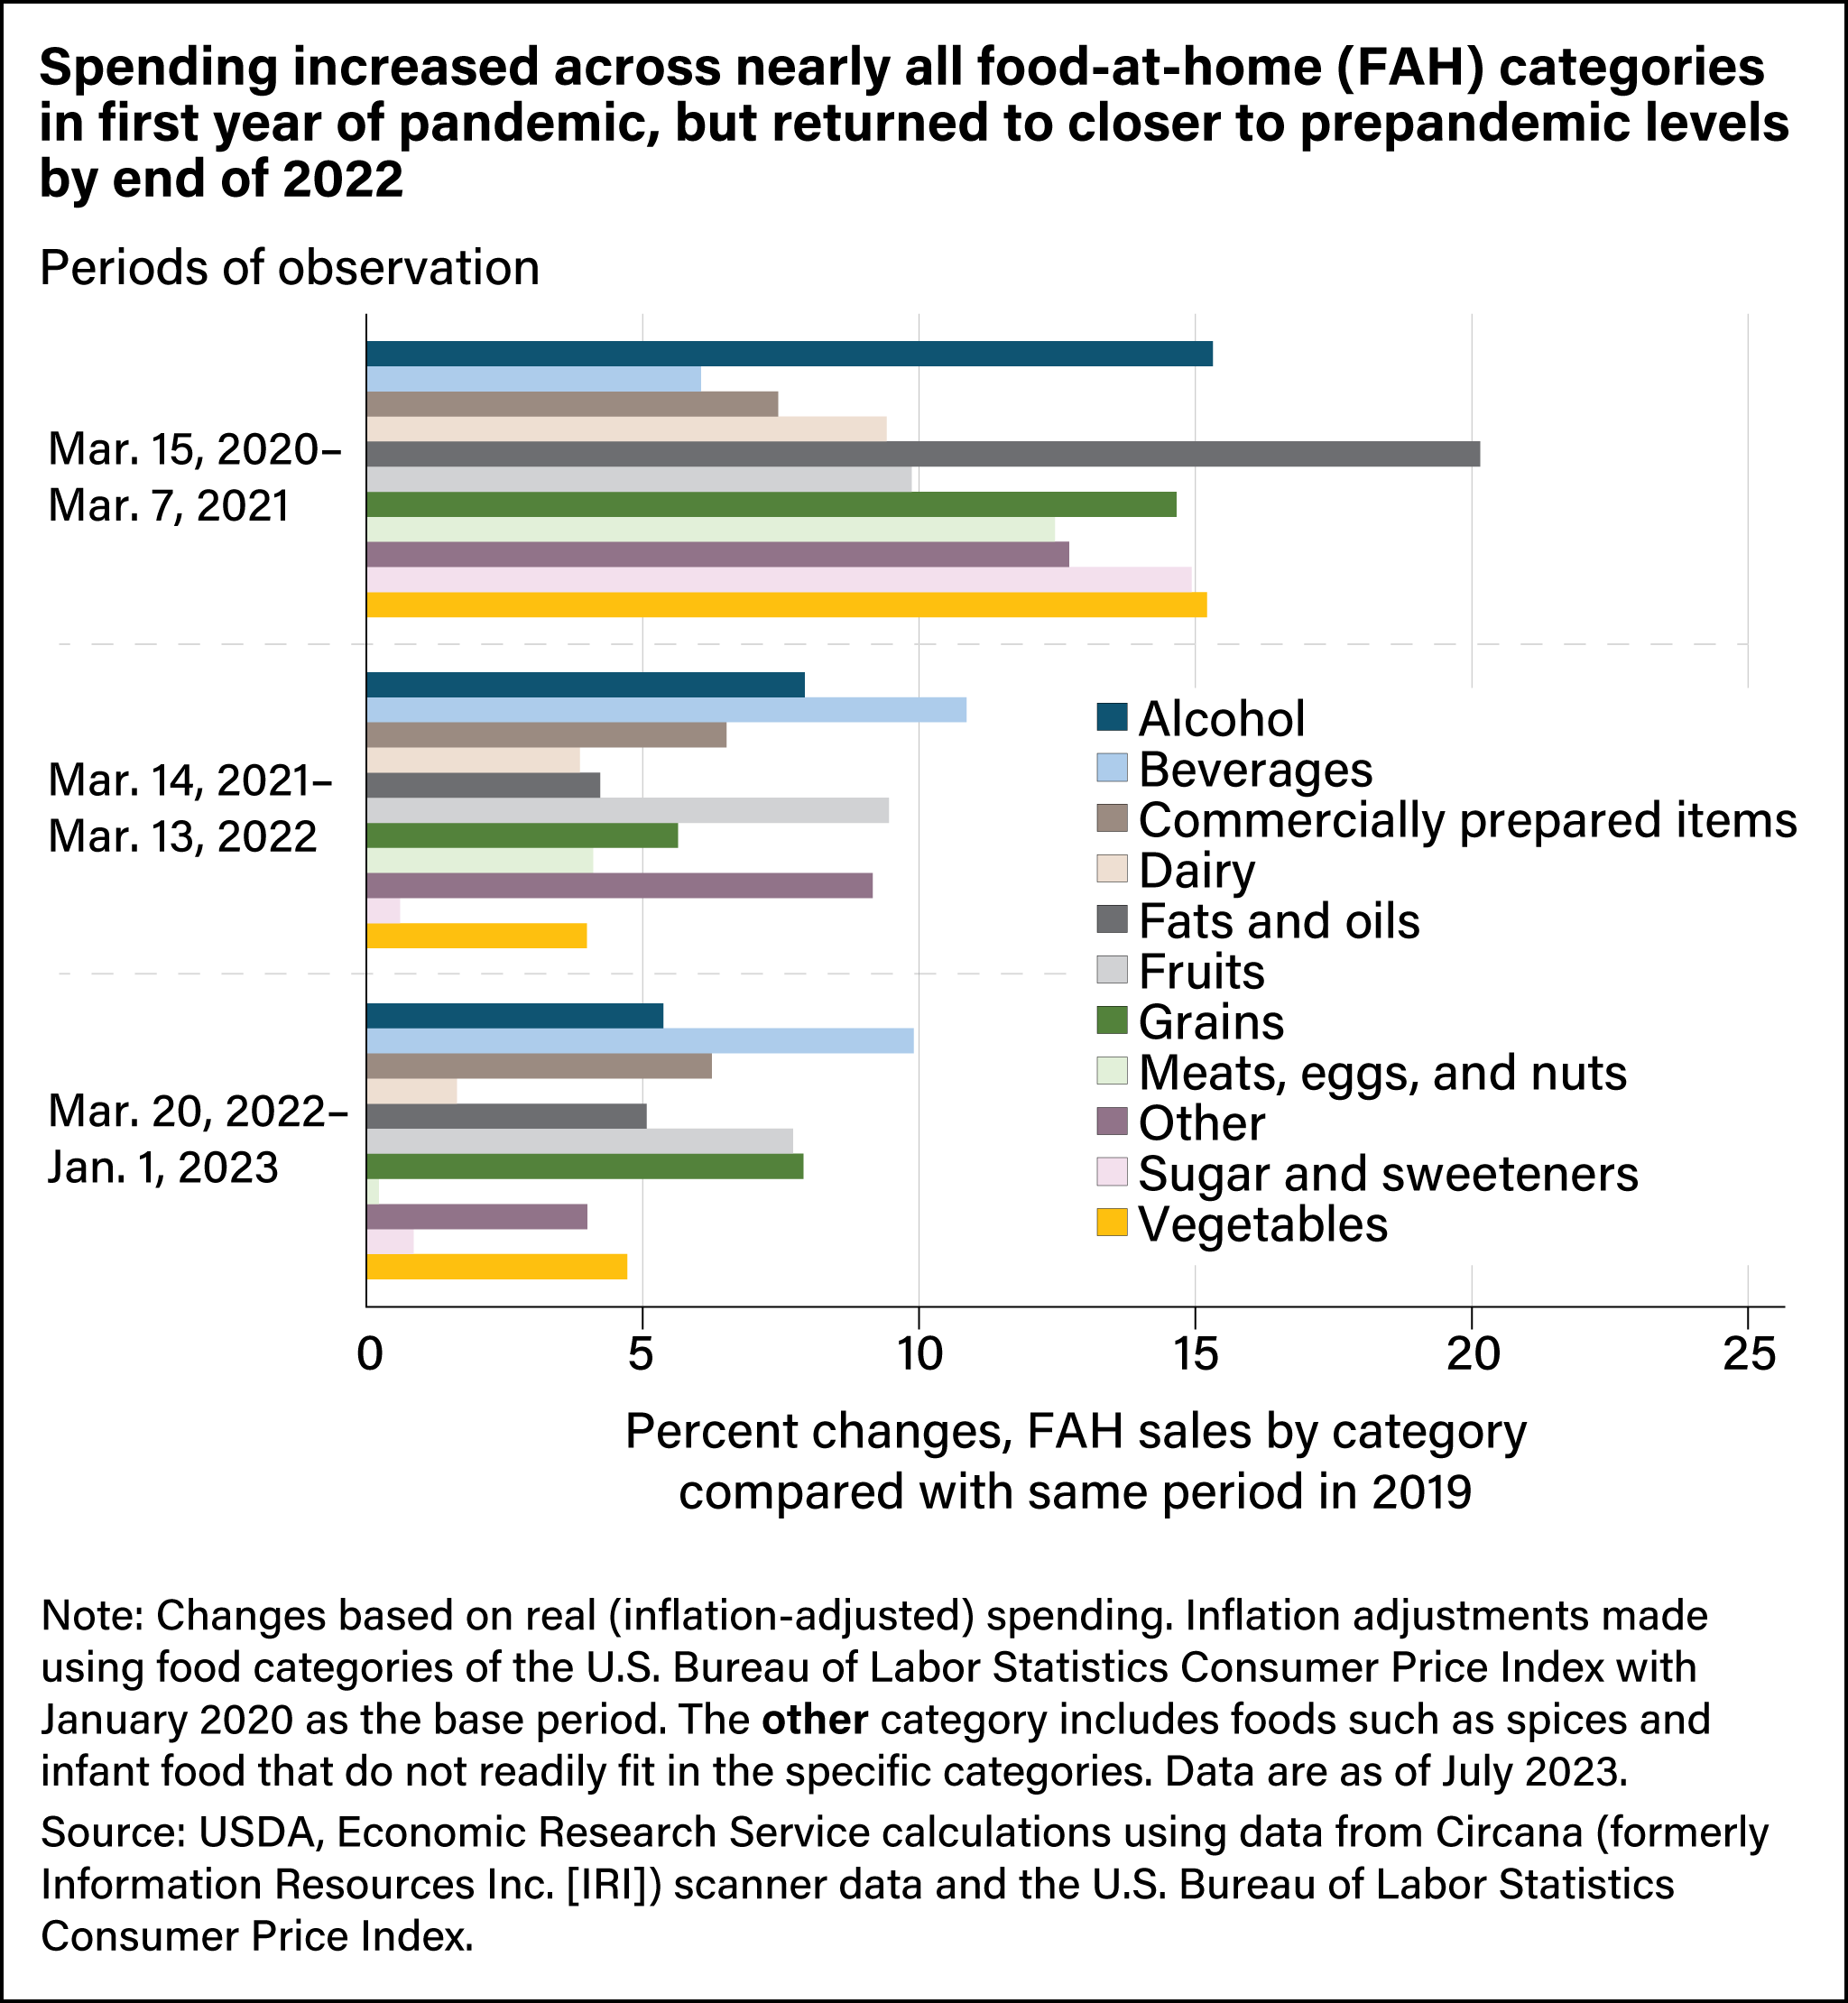
The changes in sales from March 14, 2021, to March 13, 2022, compared with 2 years before (prepandemic, March 16, 2019, to March 15, 2020) continued to show elevated inflation-adjusted spending at an average of about 6 percent. This shows that while some of the early pandemic-related changes had continued, overall FAH spending started to decrease after the first year of the pandemic. Most recently, comparing sales from March 20, 2022–January 1, 2023, to March 16, 2019–December 28, 2019, sales remain elevated, although less so than the changes observed from 2019 to 2020 (an average 4.9 percent compared with an average 12.5 percent). These changes reflect two phenomena. First, during this time, both the level and share of FAH expenditures increased compared with 2020 levels. Second, the composition of FAH spending returned to its prepandemic makeup. For example, each category’s share of FAH sales (adjusted for inflation) in March–May 2022 was within 0.5 percentage point of the observed value in March–May 2020 except for beverages.
Changes in Food-Away-From-Home Transactions and Food-at-Home Sales
In addition to changing the type of food at home they bought in response to the pandemic, consumers changed how much they spent at and how frequently they visited restaurants and other food service outlets. For the first year of the pandemic (March 15, 2020, through March 14, 2021), year-over-year changes in FAFH transactions moved in the opposite direction of year-over-year changes in FAH sales (inflation-adjusted). The increases in FAH sales also occurred sooner than the decreases in FAFH transactions following the onset of the pandemic. For example, during the week ending March 15, 2020, food retail sales were 55.3 percent higher than they were the year before, but the change in restaurant transactions was only 10 percent lower than the previous year. This difference may reflect consumers stocking up on food in addition to shifting more day-to-day food consumption to FAH. The levels of change in weekly restaurant transactions continued until April 12, 2020 (compared with the week ending April 14, 2019), when restaurant transactions were about 45 percent lower than the year before. At the same time, FAH sales were still about 17.8 percent higher than a year prior.
The changes in FAH sales and FAFH transactions were short-lived. By July 5, 2020, FAFH transactions were only about 13 percent lower than the year before, and FAH sales were about 7.7 percent higher. Each stayed relatively stable through March 7, 2021, with the average weekly year-over-year change in FAFH transactions around 12 percent lower, and FAH sales about 6.7 percent higher.

Even 2 years after the official onset of the pandemic, changes in FAH sales and FAFH transactions relative to prepandemic levels continued to move in opposite directions. As of March 20, 2022, there were still 11.6 percent fewer restaurant transactions than at the same time in 2019, and FAH sales were 9 percent higher. As of the last week of 2022, restaurant transactions remained about 6 percent lower than they were the last week of 2019. As of the last week of 2022, FAH sales were 23.6 percent higher than the last week of 2019. This indicates the moderate shifts away from FAFH transactions in favor of increased FAH spending may be more long term. However, there was variation in the type of restaurants at which consumers spent money and how they acquired those meals.
Consumer Spending Varied at Quick- and Full-Service Restaurants
At the end of 2022, FAFH transactions were below prepandemic levels, but changes in spending (inflation-adjusted) differed by restaurant type. For instance, during the first year of the pandemic, total consumer spending at restaurants was down from the year before, but the drop was smaller at quick-service establishments, where customers order and pay at a counter before eating, than at full-service restaurants, which typically offer table service to a room full of seated diners. During the pandemic, health policies across the country restricted sit-down restaurant service, which was the primary service mode for full-service restaurants, but quick-service restaurants could offer other options, such as drive-thru or carryout, for ordering food.
In the first observable period during the pandemic (March–May 2020), spending at quick-service restaurants dropped roughly 18 percent below that of the year before. However, spending began to increase the following period and generally stayed the same during the October–December periods of 2020, 2021, and 2022: about 4 percent lower than the same period in 2019. That continuity showed persistent demand for quick-service meals.
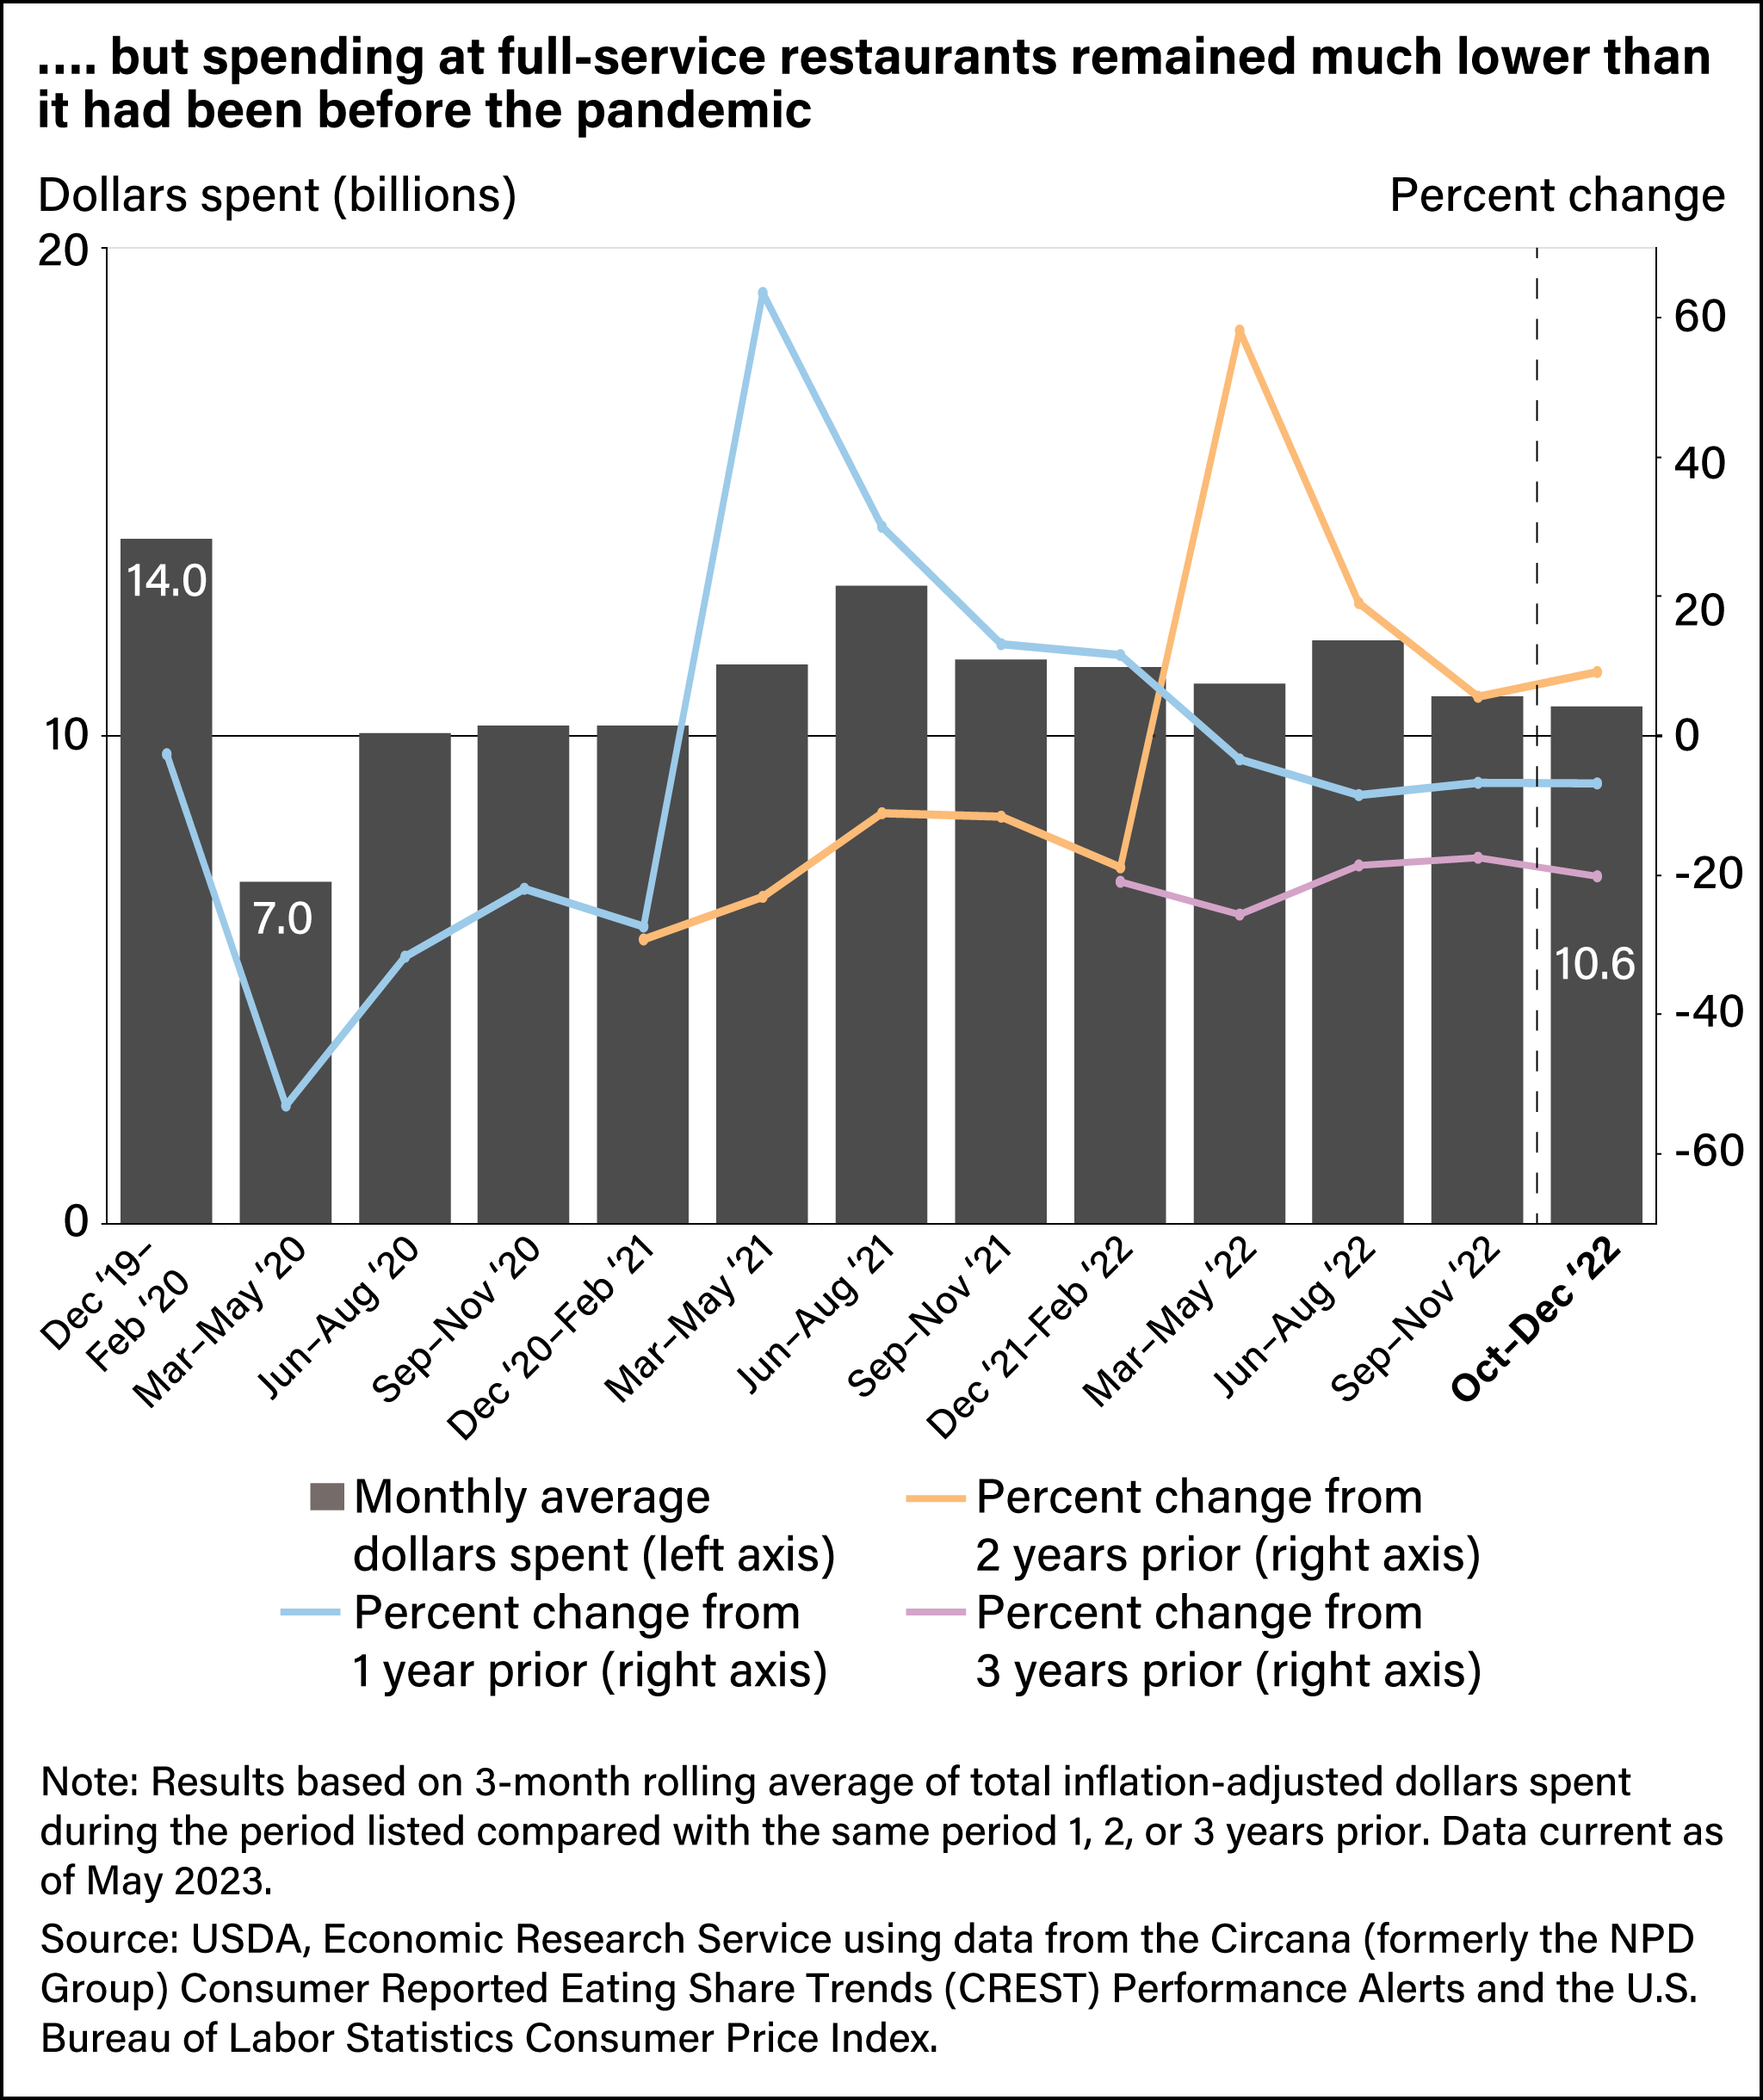
While spending at quick-service restaurants was quicker to rebound to near prepandemic levels and generally remained there throughout 2022, spending at full-service restaurants continued to lag at the end of 2022. From December 2019 to February 2020, consumers spent an average of $14 billion at full-service restaurants; by the first full period of the pandemic (March–May 2020), average spending had dropped to $7 billion. While consumer spending at full-service restaurants has increased since the initial drop, it has yet to return to prepandemic levels. As of October–December 2022, average spending totaled about $10.6 billion. This was 9 percent higher than October–December 2020 but 20 percent lower than it was in October–December 2019.
How People Acquired Their Food
The decrease in total FAFH spending and the shift toward quick-service restaurants at the beginning of the pandemic coincided with major changes in how consumers acquired food away from home. For instance, before the pandemic (December 2019–February 2020), spending at quick-service restaurants at the drive-thru, for carryout, and for eating in the restaurant was nearly equal, with the total inflation-adjusted 3-month average spending ranging between $5.9 billion and $8.5 billion. Delivery was the least popular method of acquiring restaurant food at quick-service restaurants, with $1.6 billion in spending. For full-service restaurants in the same period, consumers spent $12.1 billion eating on the premises (86 percent of all spending at full-service restaurants), compared with $1.6 billion for carry-out.
Dining methods involving face-to-face interactions became increasingly less common after the pandemic was declared, from March–May 2020, and spending for on-premises dining at full-service restaurants dropped to $2.4 billion. Carryout rose to only about $3.6 billion, not compensating for the nearly $10 billion loss in on-premises spending. At quick-service establishments, spending for on-premises dining and for carryout declined $1.5 billion and $5.4 billion, respectively, over the same period, while spending at drive-thrus and for delivery rose $9.8 billion and $3.0 billion, offsetting more of the losses for that type of restaurant.
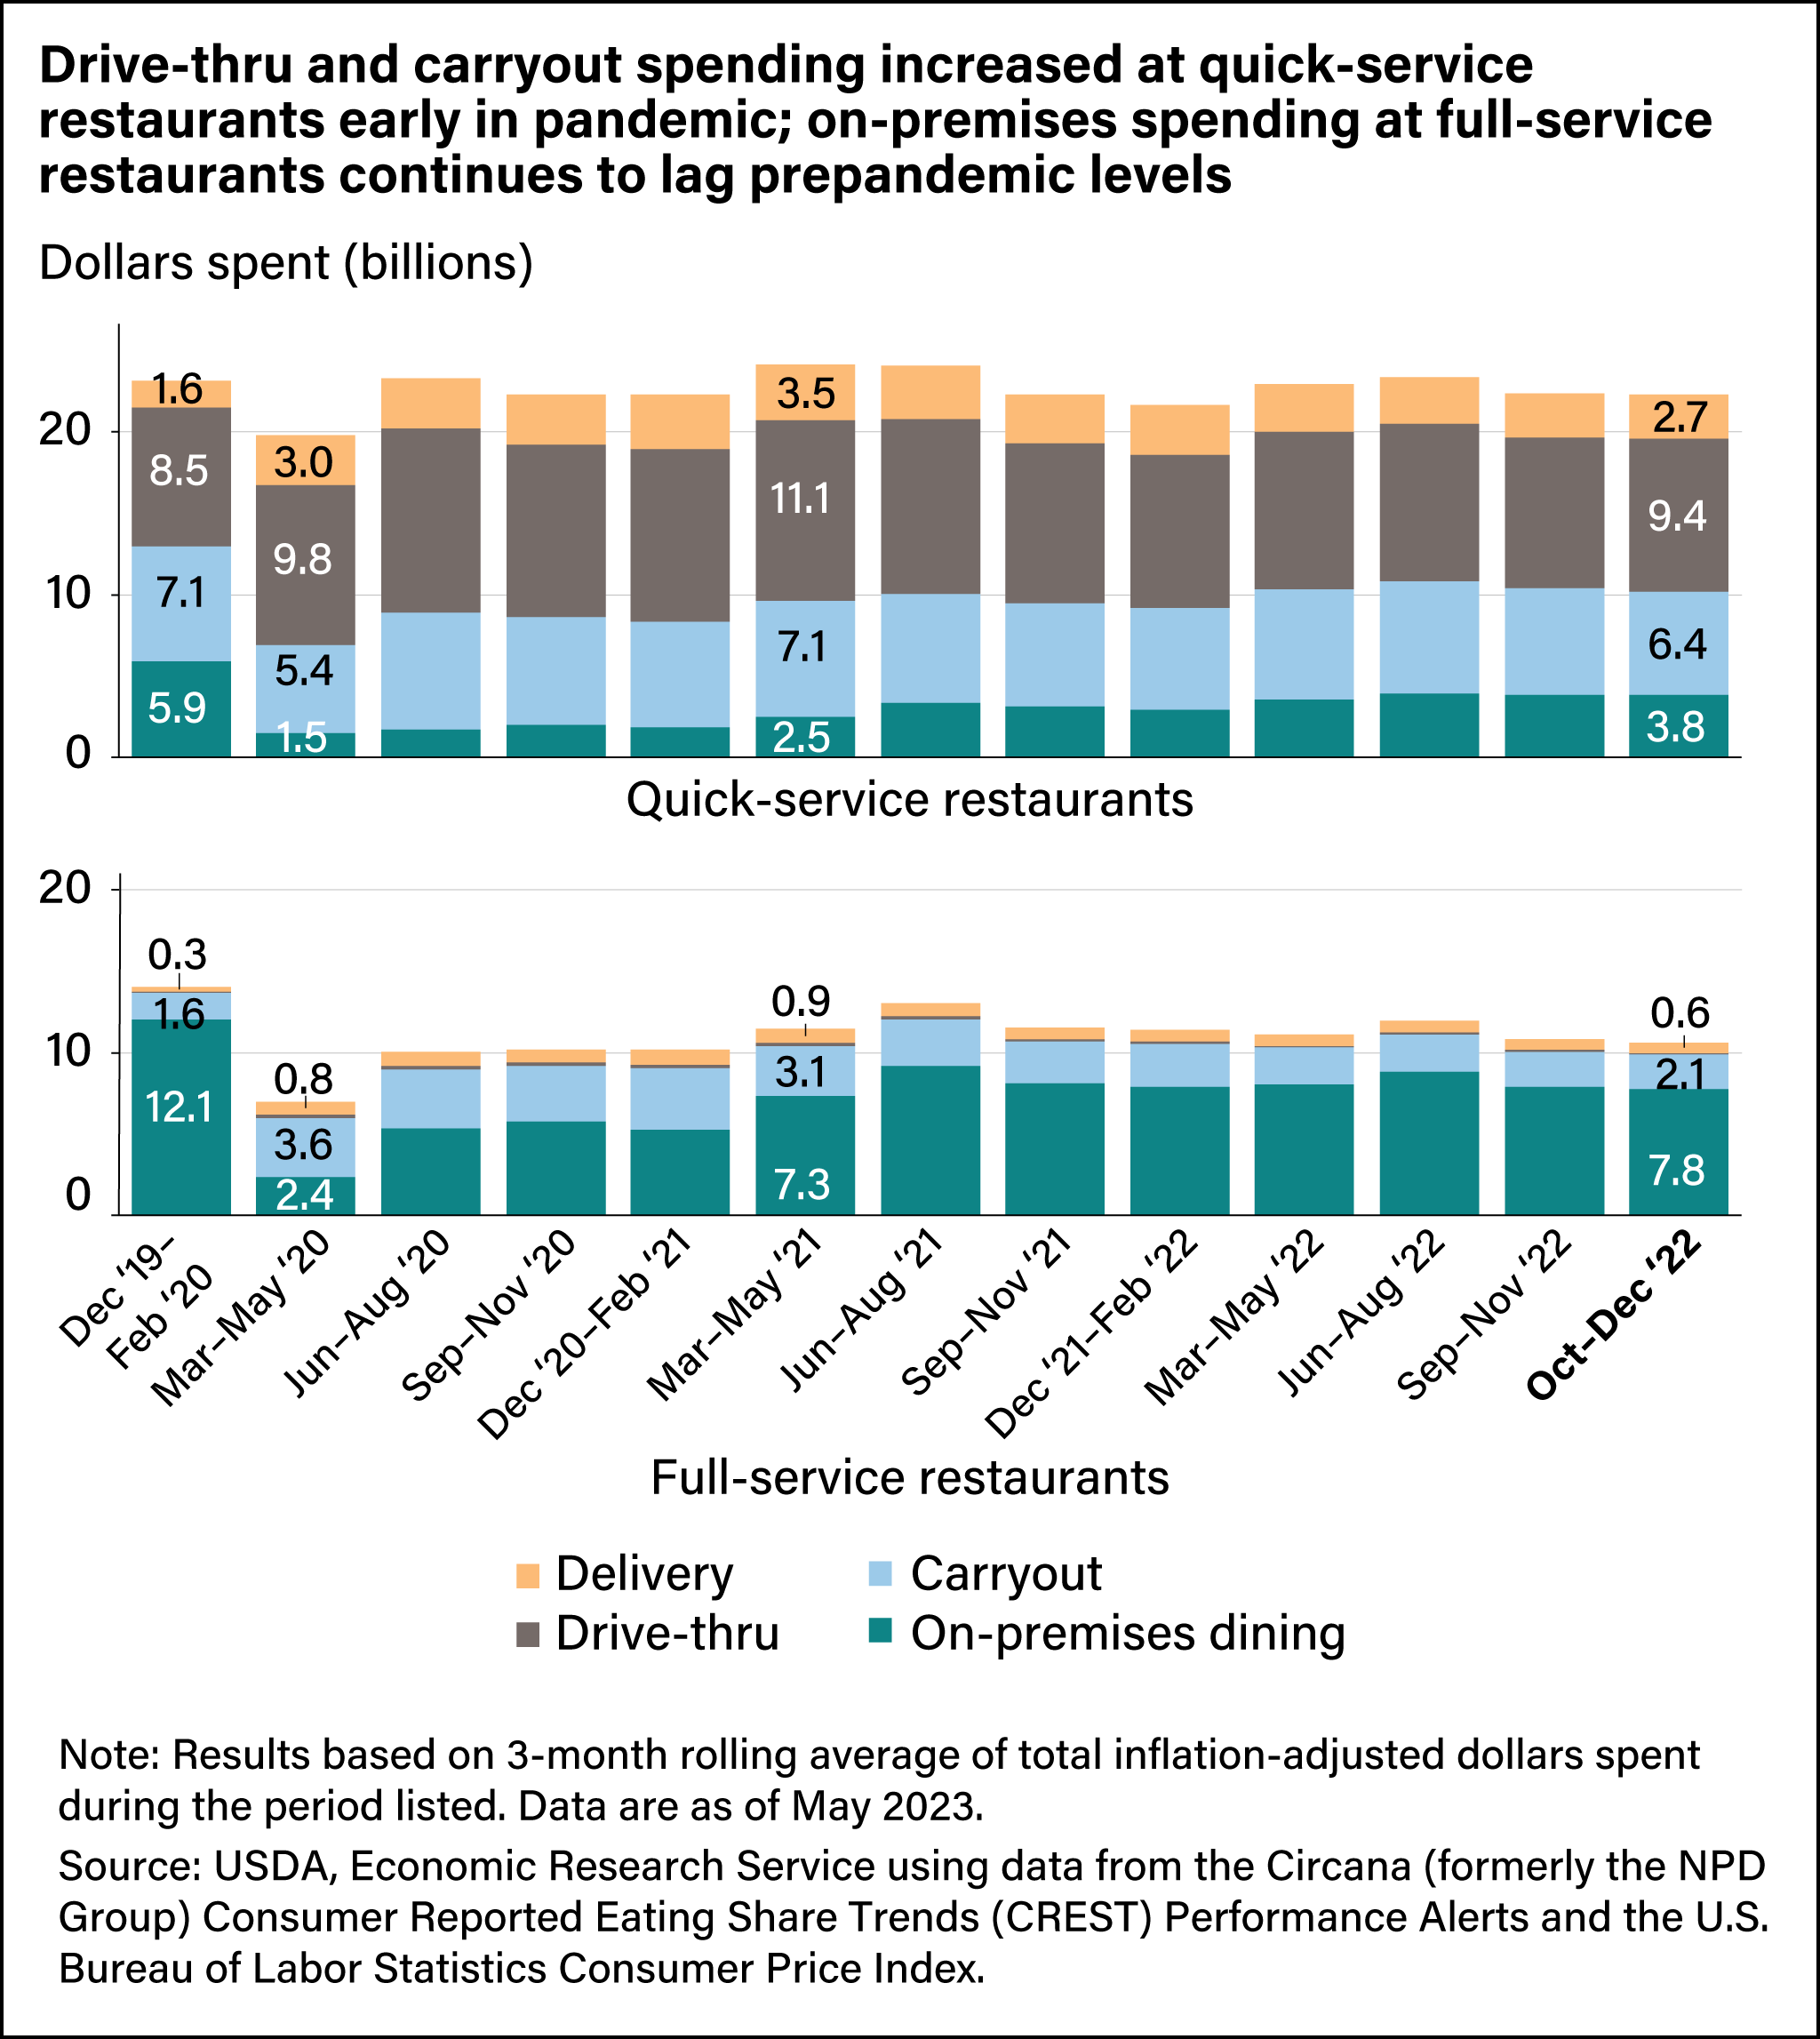
From the beginning of the pandemic in 2020 through the end 2022, how people acquired food, measured by dollars spent per service mode, at quick-service restaurants did not fluctuate much. By May–July 2021, on-premises quick-service spending nearly matched spending on delivery and eventually surpassed it around January–March 2022. As of October–December 2022, drive-thru spending continued to be the dominant way to buy food at quick-service restaurants ($9.4 billion) and remained higher than prepandemic spending levels. Delivery spending, although declining, was also higher than prepandemic at $2.7 billion during the same period. On-premises spending remained about a third lower than prepandemic levels, highlighting the slow return to this choice by consumers.
At full-service restaurants, on-premises spending was clearly the preferred method throughout the pandemic and into 2022. However, it remained lower than prepandemic levels as of the end of 2022. As of October–December 2022, on-premises spending averaged about $7.8 billion, which was much higher than it was early in the pandemic (March–May 2020) at $2.4 billion, but lower than prepandemic levels ($12.1 billion). Although the average total spending on delivery from full-service restaurants typically is not more than 6 percent of total full-service spending, the $0.6 billion observed as of October–December 2022 was double prepandemic levels and consistent for most of 2022. The expansion of delivery and carryout options during the pandemic led to shifts in how consumers bought food away from home, which lasted longer than the policies that initiated them.
As in-person restrictions were lifted and vaccinations became available, consumers returned to a more familiar way of life. Even so, changes in food spending persist. New trends emerged in the way consumers purchased food at home and food away from home, but the FAFH changes were more pronounced. For instance, consumer spending by service mode at restaurants remained slightly more diverse than before the pandemic. While on-premises spending remained the most common spending method at full-service restaurants, it was lower than prepandemic levels and continued to contribute to the lower overall full-service spending.
This article is drawn from:
- Marchesi, K. & McLaughlin, P.W. (2023). COVID-19 Working Paper: Food-Away-From-Home Acquisition Trends Throughout the COVID-19 Pandemic. U.S. Department of Agriculture, Economic Research Service. AP-113.
- McLaughlin, P.W., Stevens, A., Dong, X., Chelius, C., Marchesi, K. & MacLachlan, M. (2022). COVID-19 Working Paper: National Trends in Food Retail Sales During the COVID-19 Pandemic: Findings from Information Resources, Inc. (IRI) Retail-Based Scanner Data. U.S. Department of Agriculture, Economic Research Service. AP-108.
- Marchesi, K. & McLaughlin, P.W. (2022). COVID-19 Working Paper: The Impact of COVID-19 Pandemic on Food-Away-From-Home Spending. U.S. Department of Agriculture, Economic Research Service. AP-100.
You may also like:
- Marchesi, K. (2022, April 4). Spending Gap Between Full-Service and Quick-Service Restaurants Widened During Coronavirus (COVID-19) Pandemic. Amber Waves, U.S. Department of Agriculture, Economic Research Service.
- Marchesi, K. (2024, January 23). Pandemic-Related Increase in Consumer Restaurant Spending Using Mobile Apps Continued Through 2022. Amber Waves, U.S. Department of Agriculture, Economic Research Service.
- Food Prices, Expenditures, and Establishments - Using Proprietary Data. (n.d.). U.S. Department of Agriculture, Economic Research Service.
- Zeballos , E. & Sinclair, W. (2023, September 25). U.S. Consumers Spent More on Food in 2022 Than Ever Before, Even After Adjusting for Inflation. Amber Waves, U.S. Department of Agriculture, Economic Research Service.