
ERS Introduces Two New Measures Characterizing Rugged Terrain in the United States
- by John Cromartie and Elizabeth A. Dobis
- 1/16/2024
Highlights
- USDA, Economic Research Service researchers developed two nationwide classifications of census tracts: the Area Ruggedness Scale (ARS) and the Road Ruggedness Scale (RRS). These are thought to be the first detailed ruggedness measures with full coverage for the United States and the first to provide a roads-only version to help study the impact of rugged terrain on travel by car.
- In 2010, the rural portion of residents living in level census tracts was 16.1 percent, while the rural portion living in highly rugged tracts was nearly double that amount at 29.7 percent. However, even in highly rugged census tracts, the majority of residents lived in urbanized areas.
- Nearly 60 percent of residents in highly rugged rural locations lived in low-income census tracts compared with about 42 percent of rural residents in level census tracts.
For all its beauty, rugged terrain can have complex and contradictory effects on communities. Whether made up of mountains, canyons, or other landscape features, rugged terrain (defined here as any location with significant variation in elevation) is appreciated by long-term residents and may spur economic growth through tourism and migration. It may also be a barrier to settlement and travel, limiting the amount of land available for development and making it more time-consuming for residents living in or traveling through rugged terrain to access needed goods and services. However, the intersection of rugged terrain and economic activity remains understudied, in part because of the lack of a geographically detailed measure of ruggedness.
To understand rugged terrain as both a benefit and a hindrance, researchers with USDA, Economic Research Service developed two nationwide classifications of U.S. census tracts: the six-level Area Ruggedness Scale (ARS) and the five-level Road Ruggedness Scale (RRS). These scales were created using two versions of a Terrain Ruggedness Index (TRI), a measure of variation in elevation among geographic areas. Using grid cells that average 0.15 square mile in size, the TRIs measure the difference in elevation between each grid cell and its neighboring grid cells. These measures provide a continuum of topographic variation at a very localized scale, ranging from flat to extremely rugged. The researchers calculated the Area TRI using all grid cells nationwide. The Road TRI was created using only the grid cells that contain roads.
Because it is difficult to use grid cell data in many research and program applications, the researchers created data for census tracts using the mean TRI. Each land-based census tract from the 2010 decennial census was classified into a category within the two ruggedness scales based on the average change in elevation for all terrain (for the Area Ruggedness Scale) and the average change in elevation beneath roads (for the Road Ruggedness Scale). Although the ARS and RRS categories have similar names describing the relative relationship among census tracts, the mean Road TRI values are lower than those for the Area TRI. For example, a census tract with a mean Area and Road TRI value of 70 meters would be considered a highly rugged census tract for the road scale but a slightly rugged tract for the area scale. In other words, the values are comparable within the scales but not between them (see blue box below, “How the Area Ruggedness Scale and the Road Ruggedness Scale Were Created”).
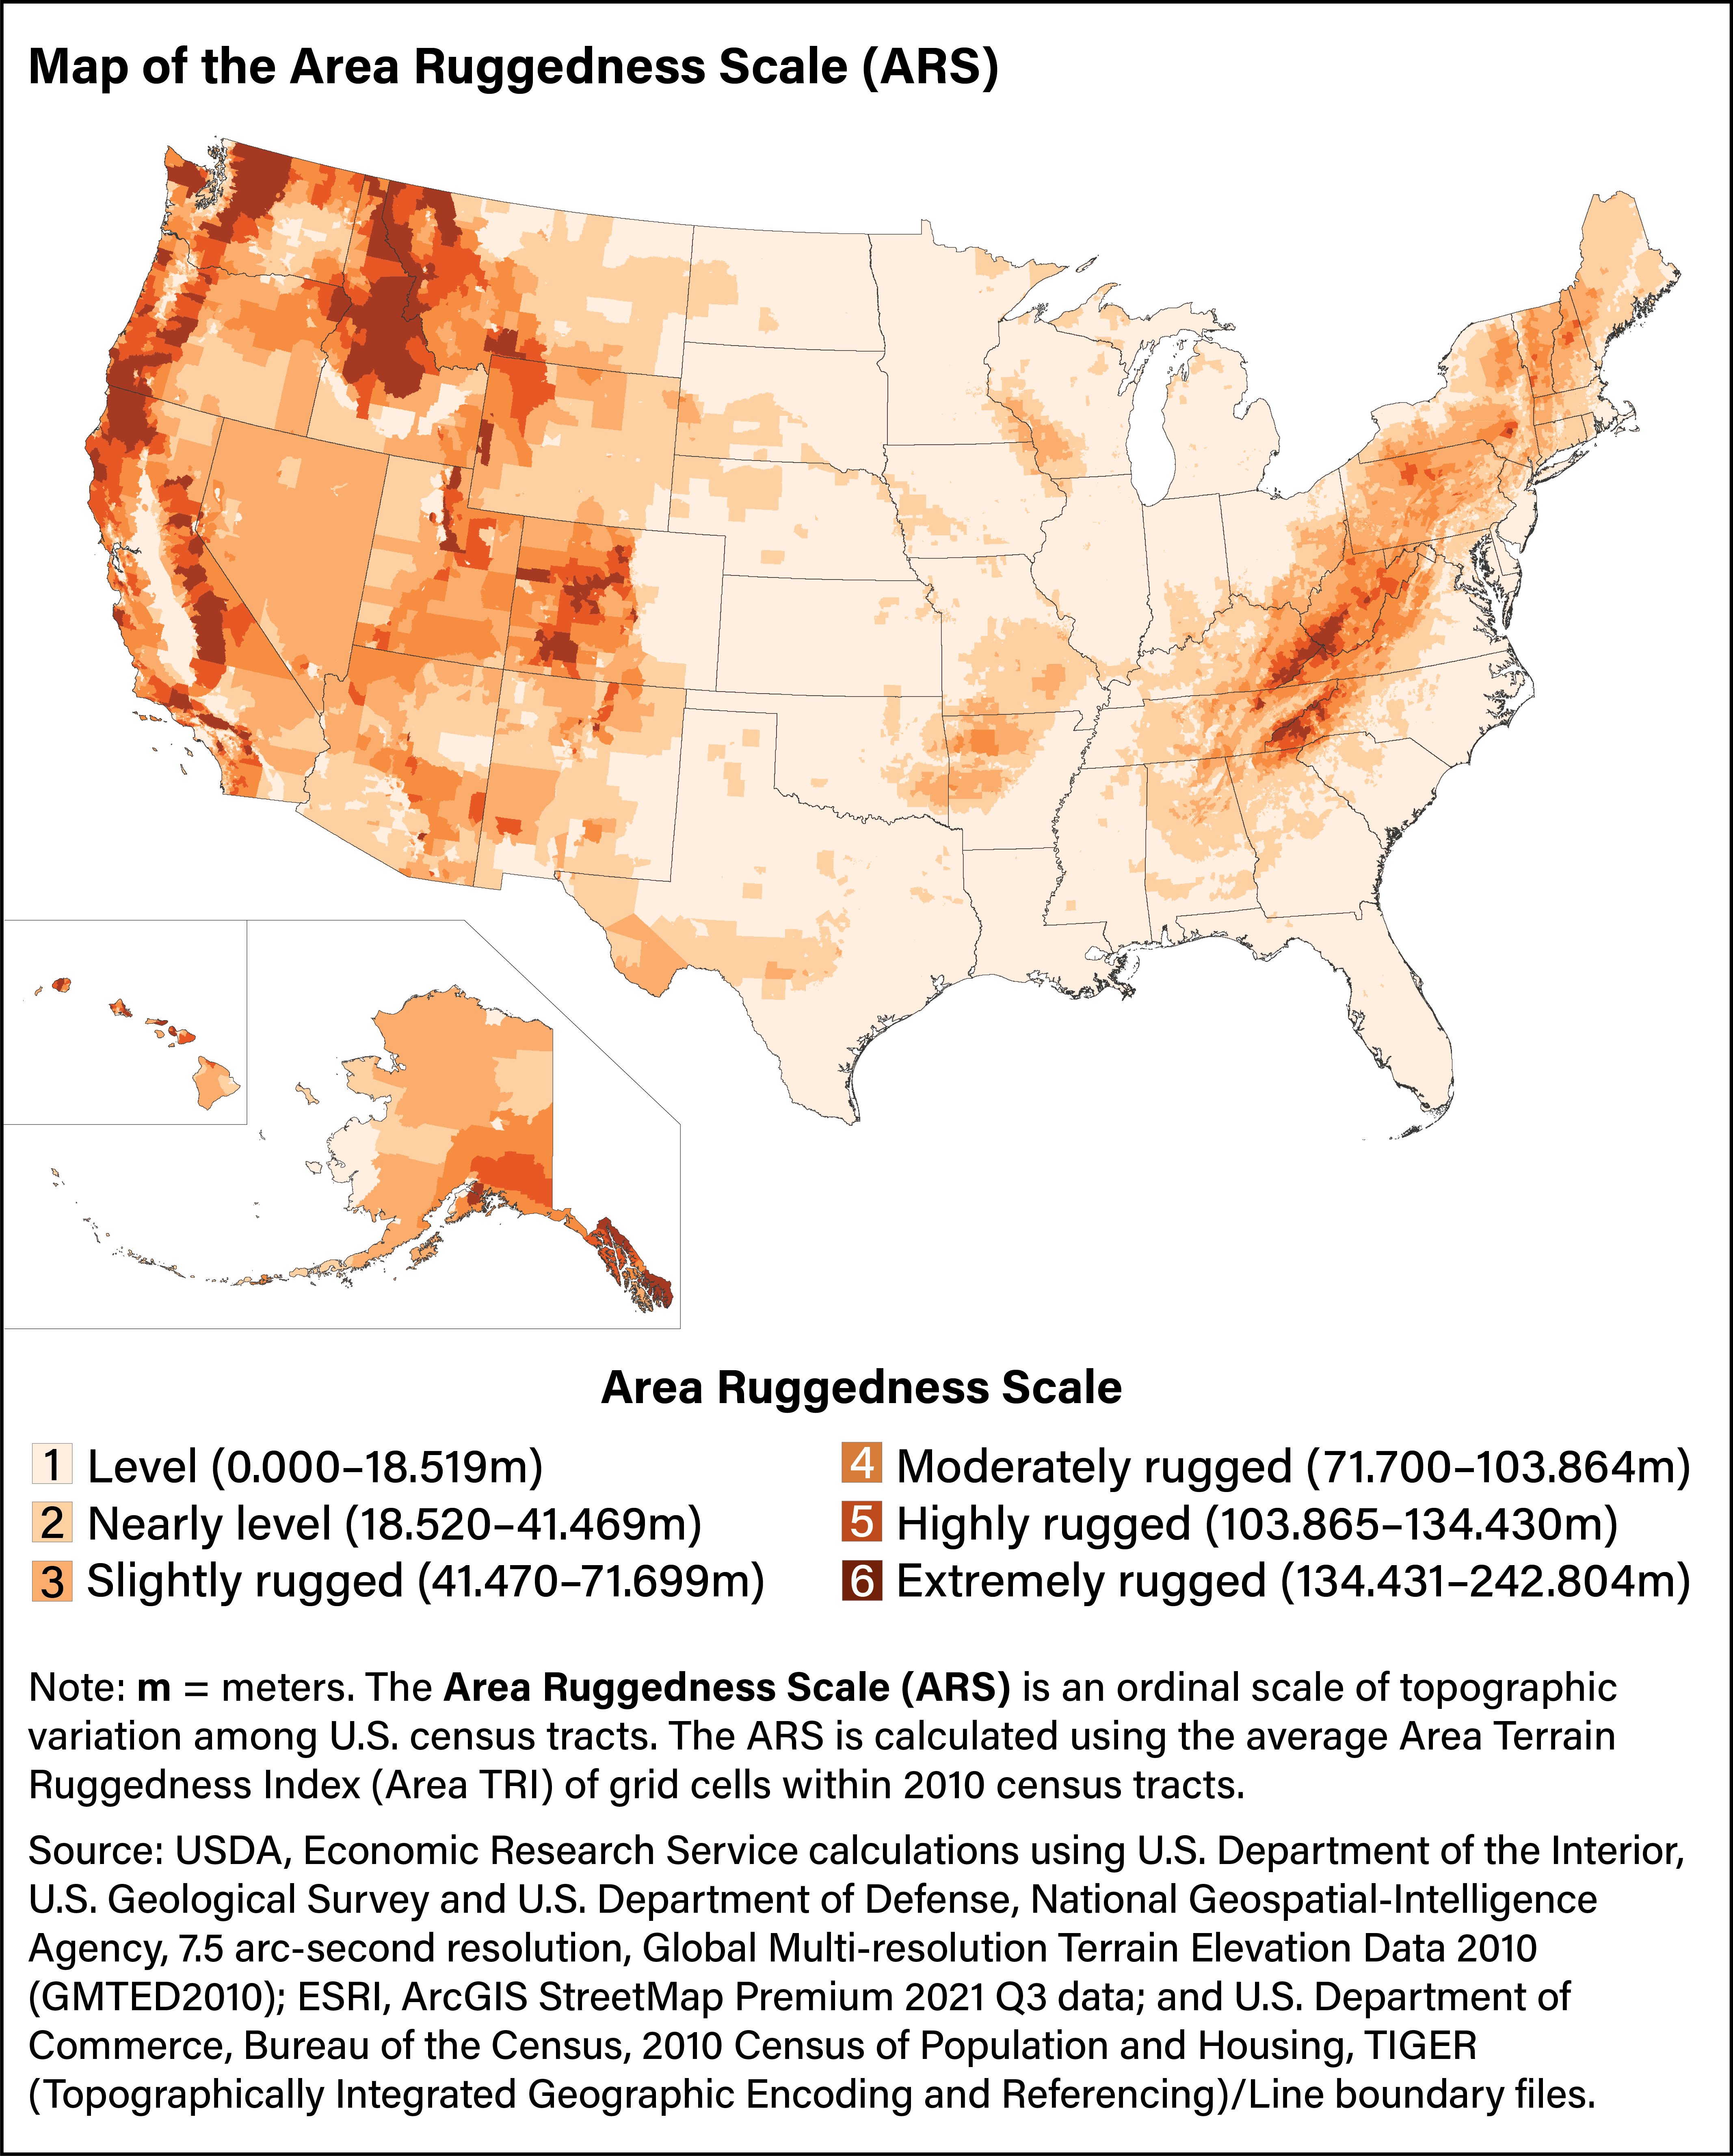
In the map of the Area Ruggedness Scale below, the light orange color represents the most level land (category 1), and dark orange represents the highest level of ruggedness (category 6). The Appalachian Mountains, the Rocky Mountains, the Pacific Mountain System, and the Sierra Nevada are clearly visible in the ARS. The Southern Coastal areas, Great Plains, and Corn Belt are relatively level. Intermediate terrain, such as the Badlands in North and South Dakota and the Sandhills in Nebraska, also can be identified.
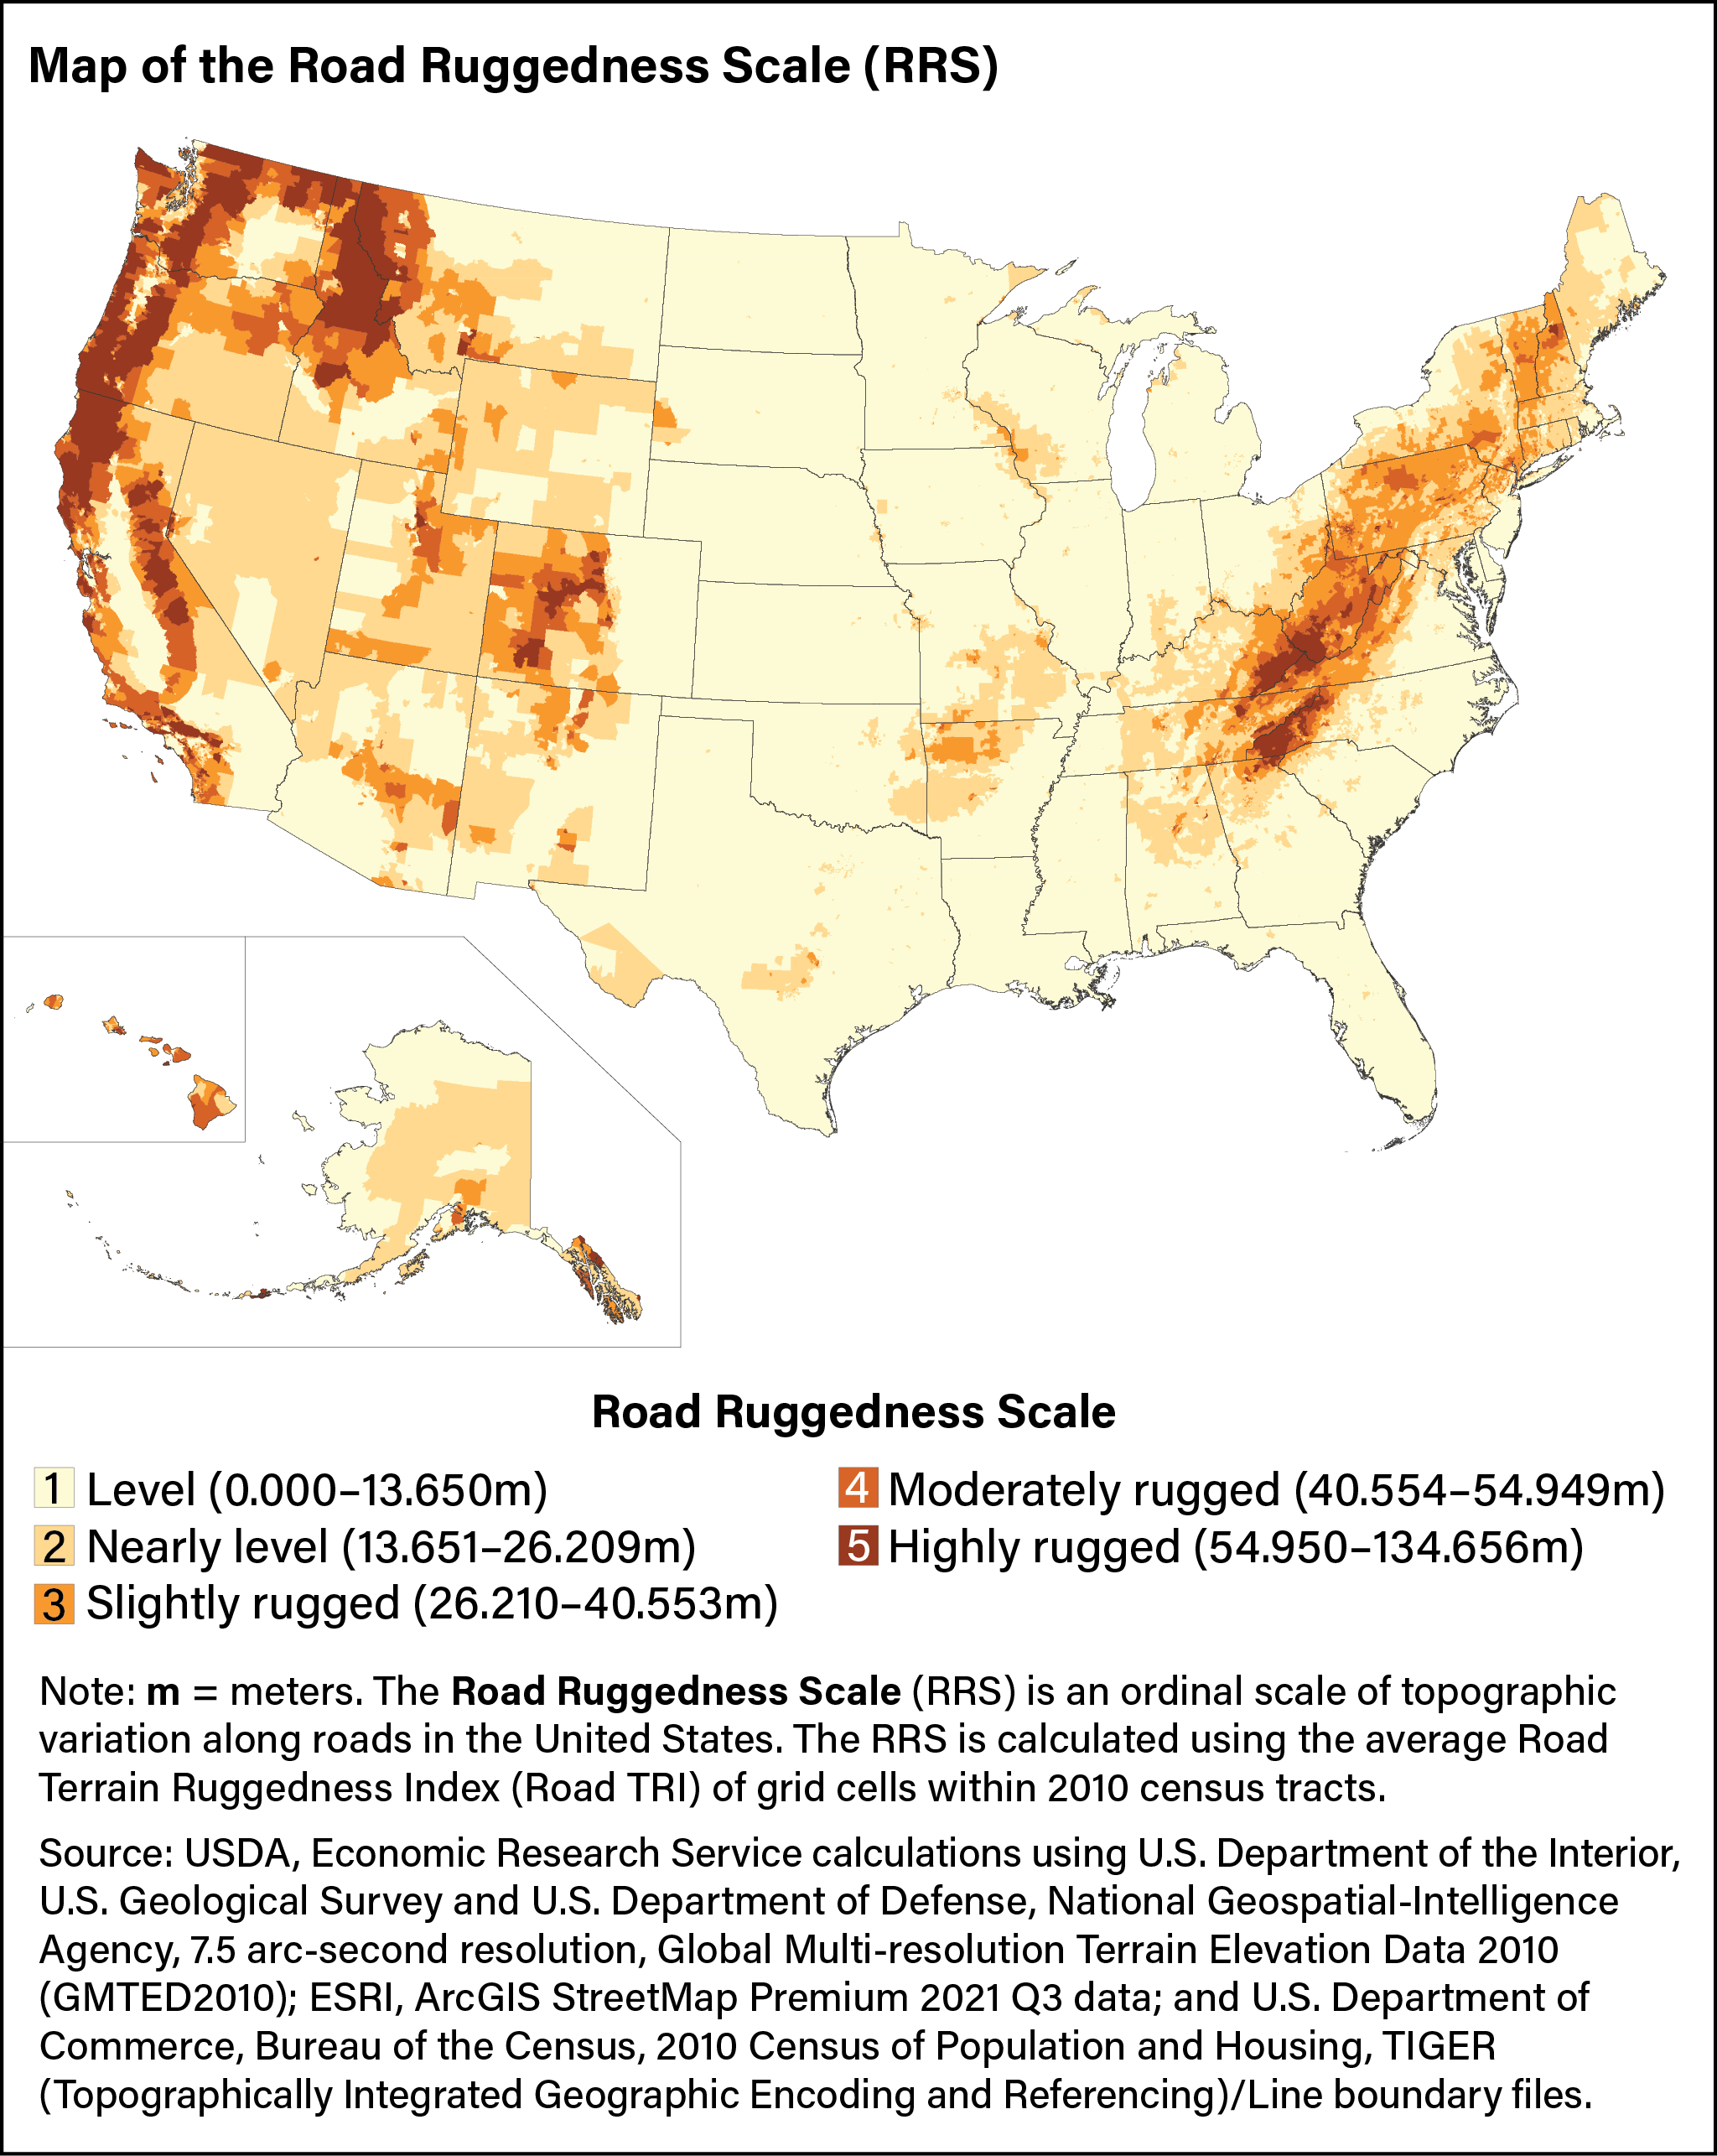
The Road Ruggedness Scale, illustrated in the map below, has five categories ranging from “level” to “highly rugged” that indicate the changes in elevation beneath roads. The geographic distribution of rugged categories is similar to those of the ARS but with some notable exceptions. Census tracts in the highest category are more numerous in West Virginia, Kentucky, and North Carolina. This reflects the unique landscape of southern Appalachia, where dissected plateaus and the ridge and valley terrain restrict road travel. A similar increase in RRS census tracts in the highest category is seen in the Cascade Mountains in Washington and Oregon. They are lower in average elevation compared with the Rocky Mountains of Colorado, but the RRS shows that traveling by road on level terrain through the Cascades may be more limited.
The Area and Road Ruggedness Scales have discrete categories to help compare levels of topographic variation throughout the United States. However, topographic variation exists on a continuum, with no clear line dividing rugged from nonrugged terrain. For research or program applications in which such a distinction is needed, the choice of which scale to use or categories to include as “rugged” should be made based on the goals of the project. For example, just under 38 percent of land area in the United States is designated as slightly to extremely rugged using the ARS, but these census tracts contained just over 9 percent of the population in 2010. Using the RRS, only slightly less than 15 percent of land is designated as slightly to highly rugged, but the population share is higher at nearly 12 percent (see below).
|
Land share |
Population share |
|||
|---|---|---|---|---|
| Ruggedness categories | ARS | RRS | ARS | RRS |
| 1–level | 40.3 | 58.1 | 70.8 | 65.6 |
| 2–nearly level | 21.9 | 27.4 | 19.9 | 22.9 |
| 3–slightly rugged | 20.8 | 7.7 | 6.1 | 7.6 |
| 4–moderately rugged | 9.1 | 3.5 | 2.0 | 2.5 |
| 5–highly rugged | 4.5 | 3.4 | 0.7 | 1.4 |
| 6–extremely rugged | 3.4 | — | 0.4 | — |
|
Note: ARS = Area Ruggedness Scale. RRS = Road Ruggedness Scale. RRS categories range from 1–level to 5–highly rugged and do not include “extremely rugged” found for the ARS. Due to rounding, column totals may not add to 100 percent. Source: USDA, Economic Research Service calculations using U.S. Department of the Interior, U.S. Geological Survey and U.S. Department of Defense, National Geospatial-Intelligence Agency, 7.5 arc-second resolution, Global Multi-resolution Terrain Elevation Data 2010 (GMTED2010); ESRI, ArcGIS StreetMap Premium 2021 Q3 data; U.S. Department of Commerce, Bureau of the Census, 2010 Census of Population and Housing, Summary File 1 and TIGER (Topographically Integrated Geographic Encoding and Referencing)/Line boundary files; and USDA, Economic Research Service, 2010 Rural-Urban Commuting Area Codes. |
||||
The same pattern exists for the highest ruggedness categories, with the RRS having less than half the land area designated as highly or extremely rugged (3.4 percent compared with 7.9 percent for the ARS) but slightly more people (1.4 percent for the RRS compared with 1.1 percent). These differences between the two scales—less land, more people, and higher population density for the RRS—make sense given that the RRS is built around the Nation’s road network. By limiting the measurement of topographic variation to land that contains roads, the RRS can capture travel limitations associated with rugged terrain. Alternatively, the ARS provides a measure of overall topographic variation for a census tract and may be better suited to capturing the scenic attractiveness of rugged terrain.
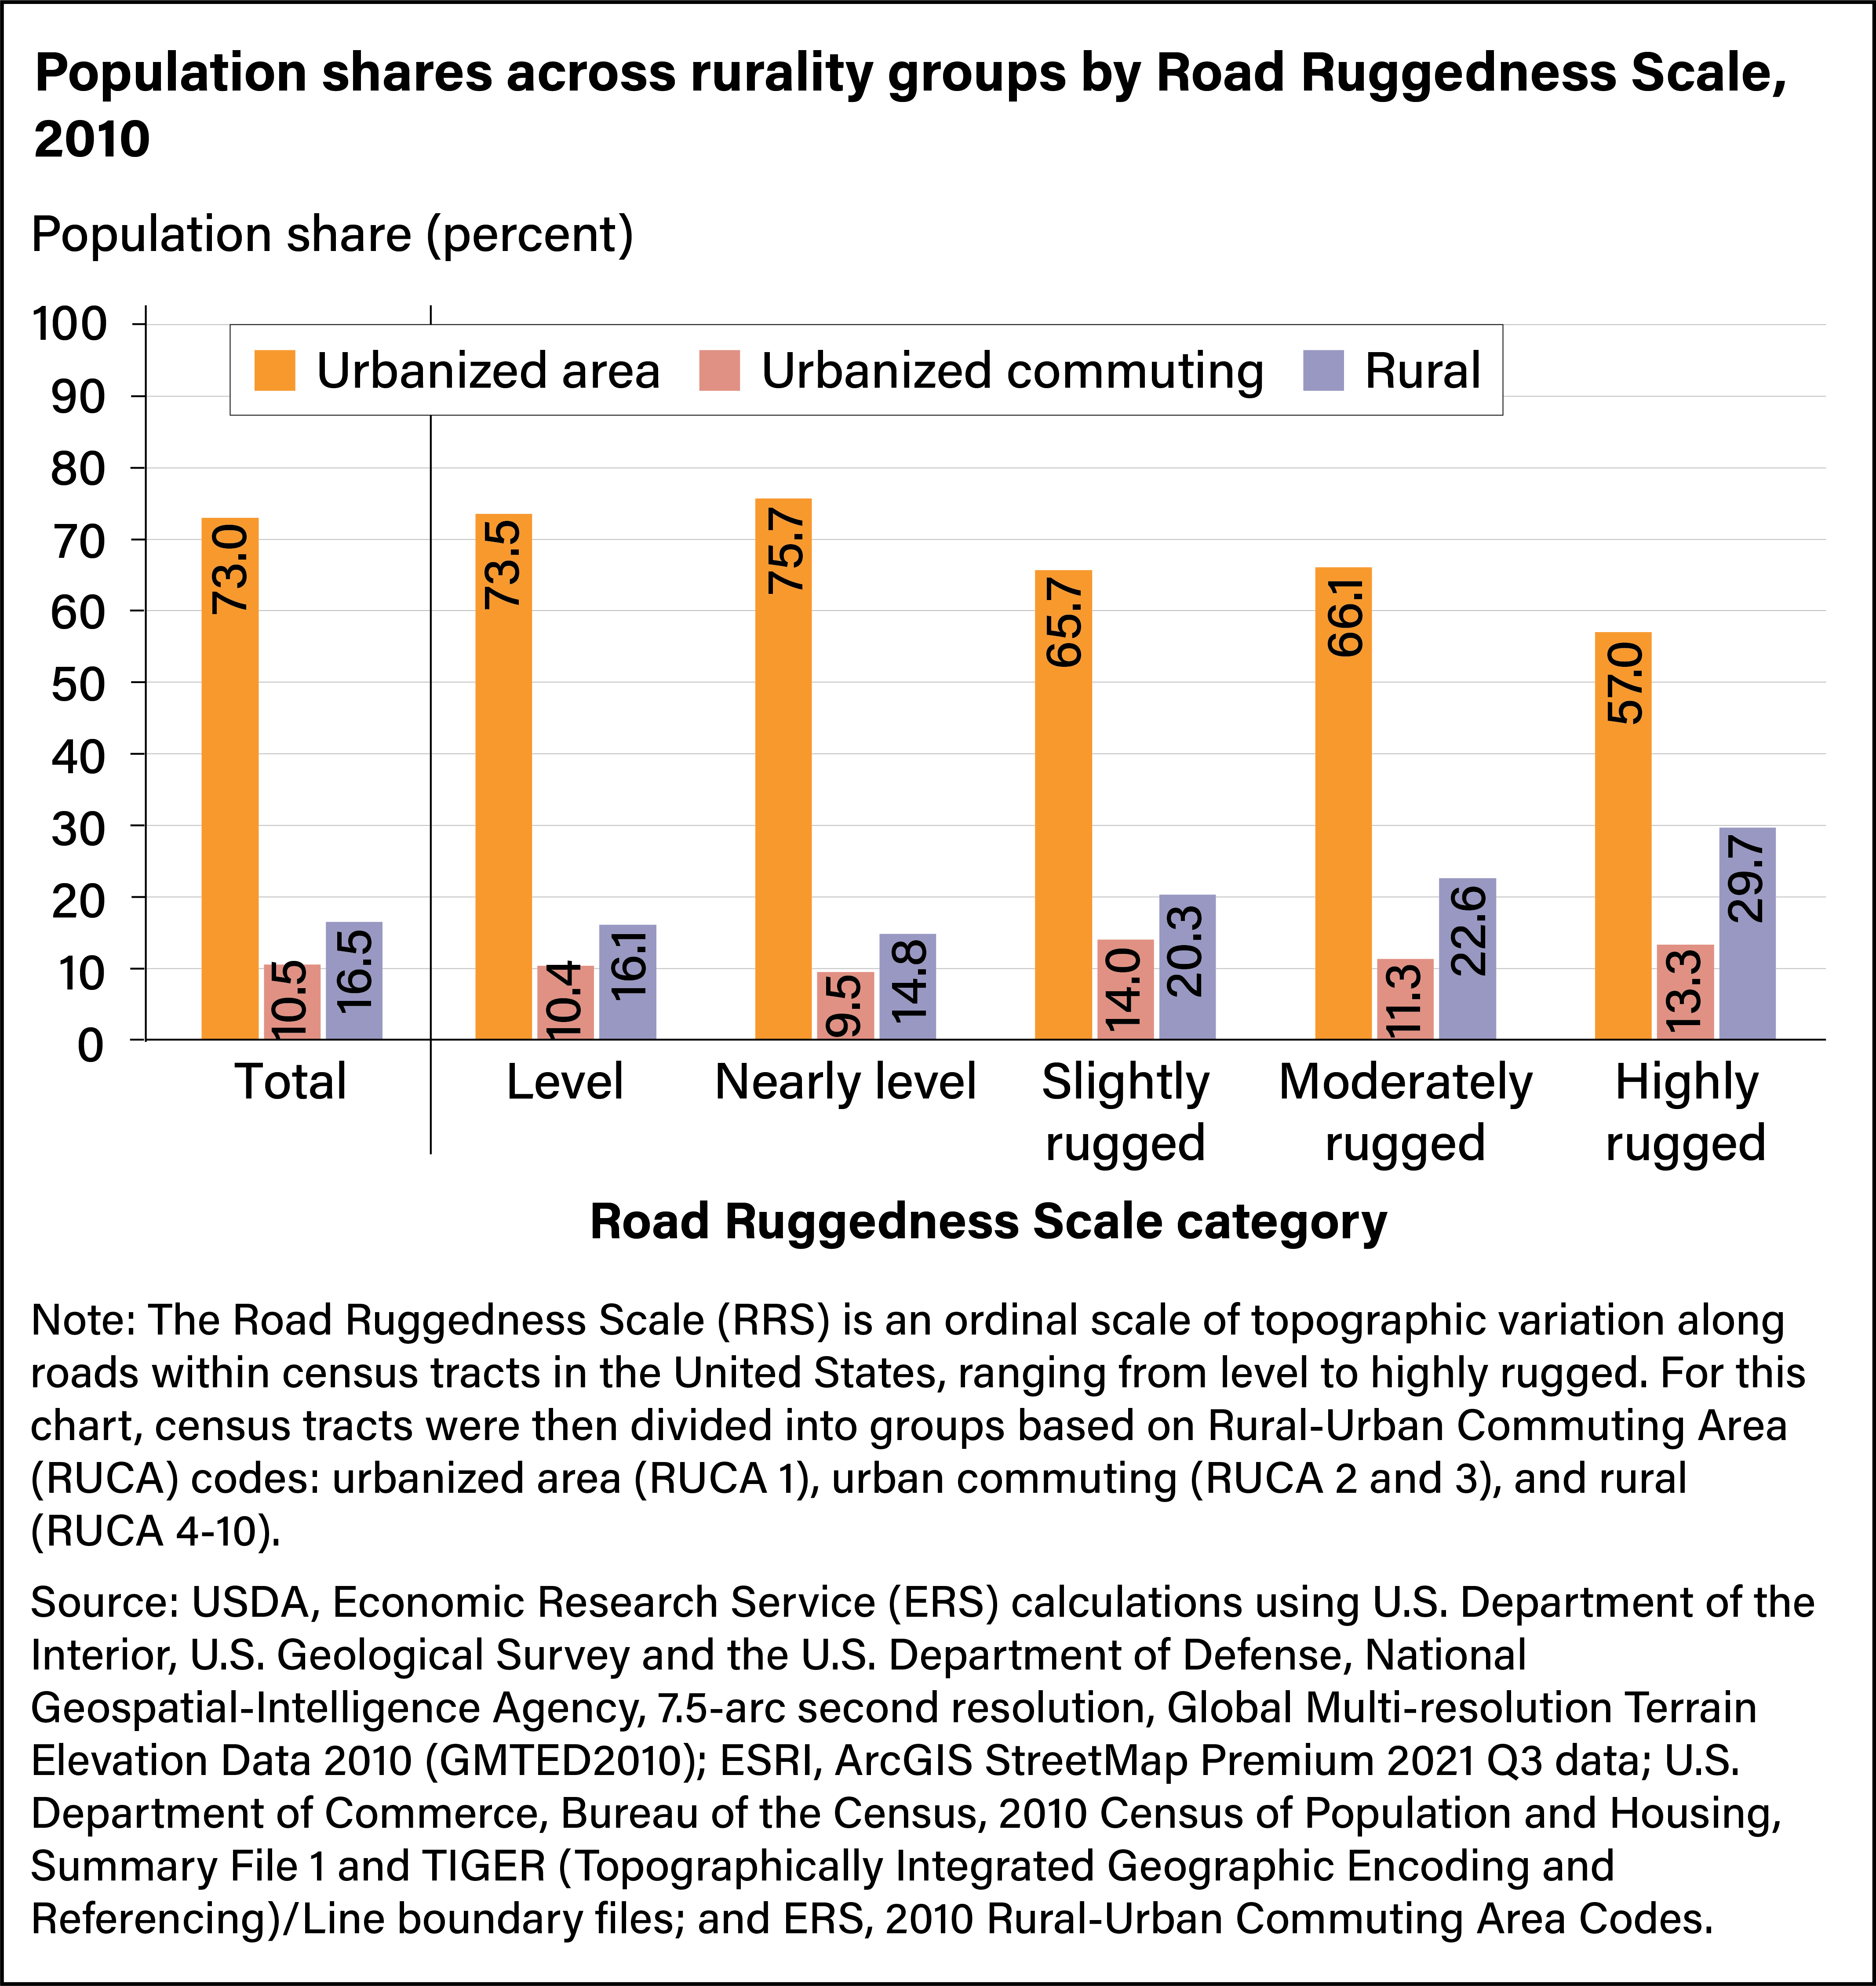
In locations that are both highly rugged and rural, there may be unique challenges to infrastructure development and accessing to services. This makes it important to document the relationship between ruggedness and rurality, particularly in the context of using road networks. To analyze the relationship between ruggedness and rurality, the researchers classified census tracts into one of three rurality groups according to the Rural-Urban Commuting Area Codes: urbanized area, urban commuting, or rural. Urbanized areas, defined by the Census Bureau as urban cores of at least 50,000 residents, are comparable to central counties of metropolitan areas. The urban commuting group consists of census tracts that are not part of an urbanized area but are economically tied to an urban area through commuting. All other areas are rural. Most U.S. residents lived in urbanized area census tracts in 2010 (73.0 percent). Urban commuting tracts included 10.5 percent of the population, and the remaining 16.5 percent lived in rural census tracts.
As would be expected, the share of the U.S. population living in rural areas increased with the level of road ruggedness, from 14.8 percent in nearly level census tracts to 29.7 percent in highly rugged census tracts in 2010 (see chart below). The increase in the share of rural residents was particularly notable between moderately and highly rugged census tracts, jumping from 22.6 to 29.7 percent. The reverse was true for residents living in urbanized area census tracts. The share of urbanized-area residents in highly rugged census tracts was 57.0 percent, much less than the 75.7 percent in nearly level tracts. However, even in highly rugged census tracts, more than 50 percent of the population still lived in urbanized areas, indicating that ruggedness does not equate to rurality.
Though ruggedness and rurality are distinct, when they occur simultaneously, unique challenges affecting the well-being of individuals or communities may arise. For example, residents of urban commuting and rural census tracts are likely to travel longer distances than residents of urbanized areas to get the goods and services they need. Adding related transportation challenges that often come with rugged terrain, these residents may find it more difficult to access necessary goods and services. To broadly measure the economic well-being of individuals by rurality and ruggedness, the researchers analyzed the share of the population in each ruggedness level who were also living in low-income census tracts.
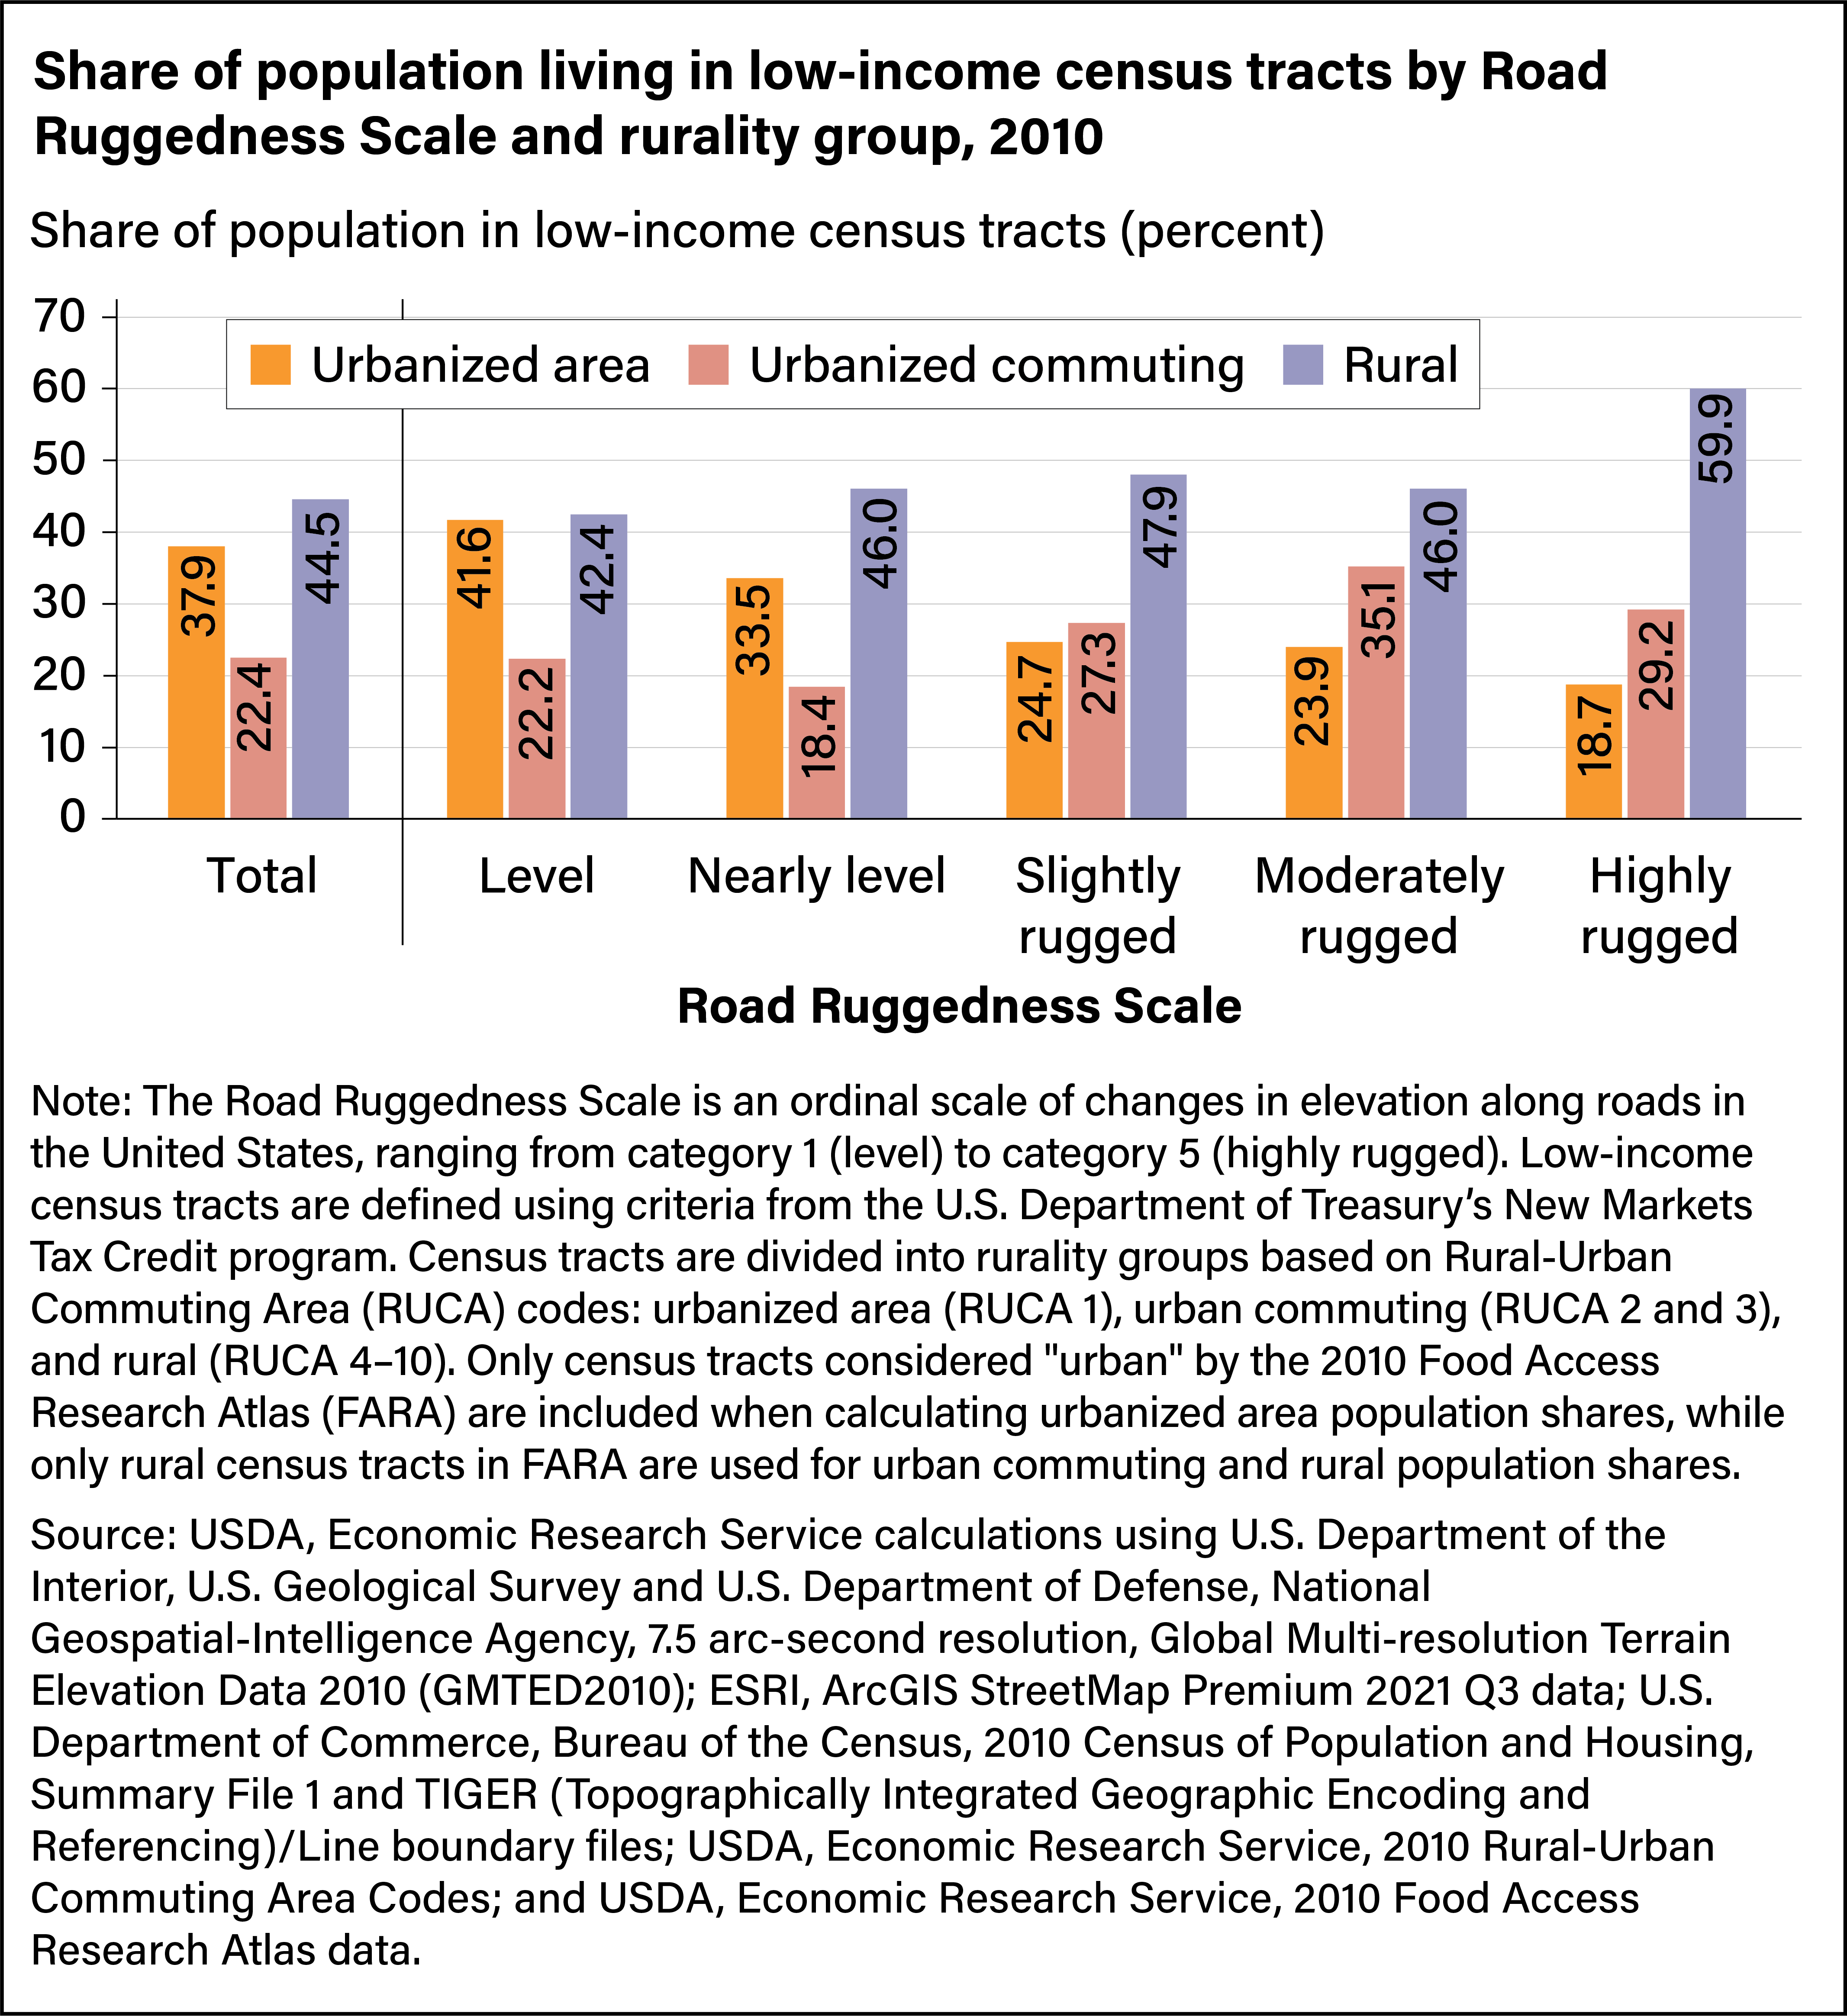
Two patterns emerged. First, as road ruggedness increased from level to highly rugged, the share of the population living in low-income census tracts increased for rural locations and decreased for urbanized area locations. Nearly 60 percent of residents in highly rugged, rural locations lived in low-income census tracts, compared with 42 to 48 percent of rural residents in less rugged census tracts. Conversely, less than 19 percent of residents in highly rugged, urbanized area locations lived in low-income census tracts, compared with nearly 42 percent of urbanized area residents in level census tracts. In urban commuting locations, the share of the population living in low-income census tracts generally increased with ruggedness, but the trend varied more. Second, at every ruggedness level, a greater share of the population living in rural census tracts was also living in a low-income census tract than for urbanized area census tracts.
To the best of ERS’s knowledge, the rugged terrain measures and classifications are the first detailed ruggedness measures with full coverage for the United States and the first to provide a roads-only version to help study the impact of rugged terrain on car travel. These measures have the potential to contribute to research on the links between geography and the health and well-being of individuals, especially those living in rural areas. This research may also aid assessments of urban-rural classifications, especially in cases such as the ERS’s Frontier and Remote Area Codes, which incorporate travel time by car as a measure of accessibility. Finally, the uses of these new measures will likely extend to research and program applications focused on the benefits of rugged terrain, that is, in gaining a better understanding of the role of scenic amenities as a driver of population and job growth.
This article is drawn from:
- Dobis, E.A., Cromartie, J., Williams, R. & Reed, K. (2023). Characterizing Rugged Terrain in the United States. U.S. Department of Agriculture, Economic Research Service. ERR-322.
You may also like:
- Rural-Urban Commuting Area Codes. (n.d.). U.S. Department of Agriculture, Economic Research Service.
- Frontier and Remote Area Codes. (n.d.). U.S. Department of Agriculture, Economic Research Service.
- Data Training Webinar: Area and Road Ruggedness Scales. (n.d.). U.S. Department of Agriculture, Economic Research Service.
- McGranahan, D. (2005, April 1). Behind the Data. Amber Waves, U.S. Department of Agriculture, Economic Research Service.
- McGranahan, D. (1999). Natural Amenities Drive Rural Population Change. U.S. Department of Agriculture, Economic Research Service. AER-781.