
Farm Size, Specialization Are Among Factors Influencing Financial Performance of African-American Farms in the United States
- by LaPorchia A. Collins, Tia M. McDonald, Anil K. Giri and Dipak Subedi
- 2/15/2024
Highlights
- In 2018–20, the average financial performance of U.S. farms differed between farms with principal operators who were Black or African American and farms with principal operators of other races.
- Compared with other farms, the average African-American-operated farm had lower total value of production, net cash farm income, and Government payments.
- In 2018–20, the average African-American farm had lower profitability, liquidity, and efficiency than others, but higher solvency.
U.S. farms whose principal operators belong to minority racial and ethnic groups, including Black/African-American farmers, generally have had limited access to Government farm support programs partly because their farms and farm-related profits tend to be small. For example, African-American-operated farms accounted for about 1.7 percent of farms in the United States in 2017, and their share of the total U.S. market value of products sold was 0.27 percent, according to USDA’s 2017 Census of Agriculture. But African-American farmers received 0.17 percent of the total payments disbursed through the Coronavirus Food Assistance Program (CFAP). The economic challenges of the Coronavirus (COVID-19) pandemic—such as increased production costs and reduced farm-level prices for certain commodities, particularly livestock—led to a renewed policy focus on the status and well-being of minority farmers.
In 2021, the American Rescue Plan Act directed USDA to create an equity commission and set aside $1 billion to improve USDA outreach and assistance to socially disadvantaged farmers and ranchers, defined as those belonging to groups that historically have been subject to racial or ethnic prejudice. African-American farmers are a part of this group, along with farmers who are American Indian or Alaska Native, Hispanic or Latino, and Asian or Pacific Islander. Since the 1990s, the Farm Bill has included provisions to help underserved producers own and operate successful farms and ranches through the Outreach and Assistance to Socially Disadvantaged and Veteran Farmers and Ranchers Program.
To help inform policy efforts, researchers at USDA’s Economic Research Service (ERS) evaluated the financial position of African-American-operated farms using data from the 2018 to 2020 Agricultural Resource Management Surveys (ARMS). The ARMS is an annual cross-sectional survey and is the only representative national source of comprehensive data on farm production practices and financial performance. ERS researchers identified key financial indicators by comparing demographic characteristics and the financial position of African-American farms to that of all other farms in the United States. African-American farms were identified as farms for which the principal operator was reported as Black or African American. Researchers found farm financial performance differed by race, with lower profits and lower Government payments for the average African-American farm compared with other producers. Farm size and commodity choice also had a significant effect on financial outcomes.
Demographic Traits of Principal Operators of U.S. Farms Differed by Race
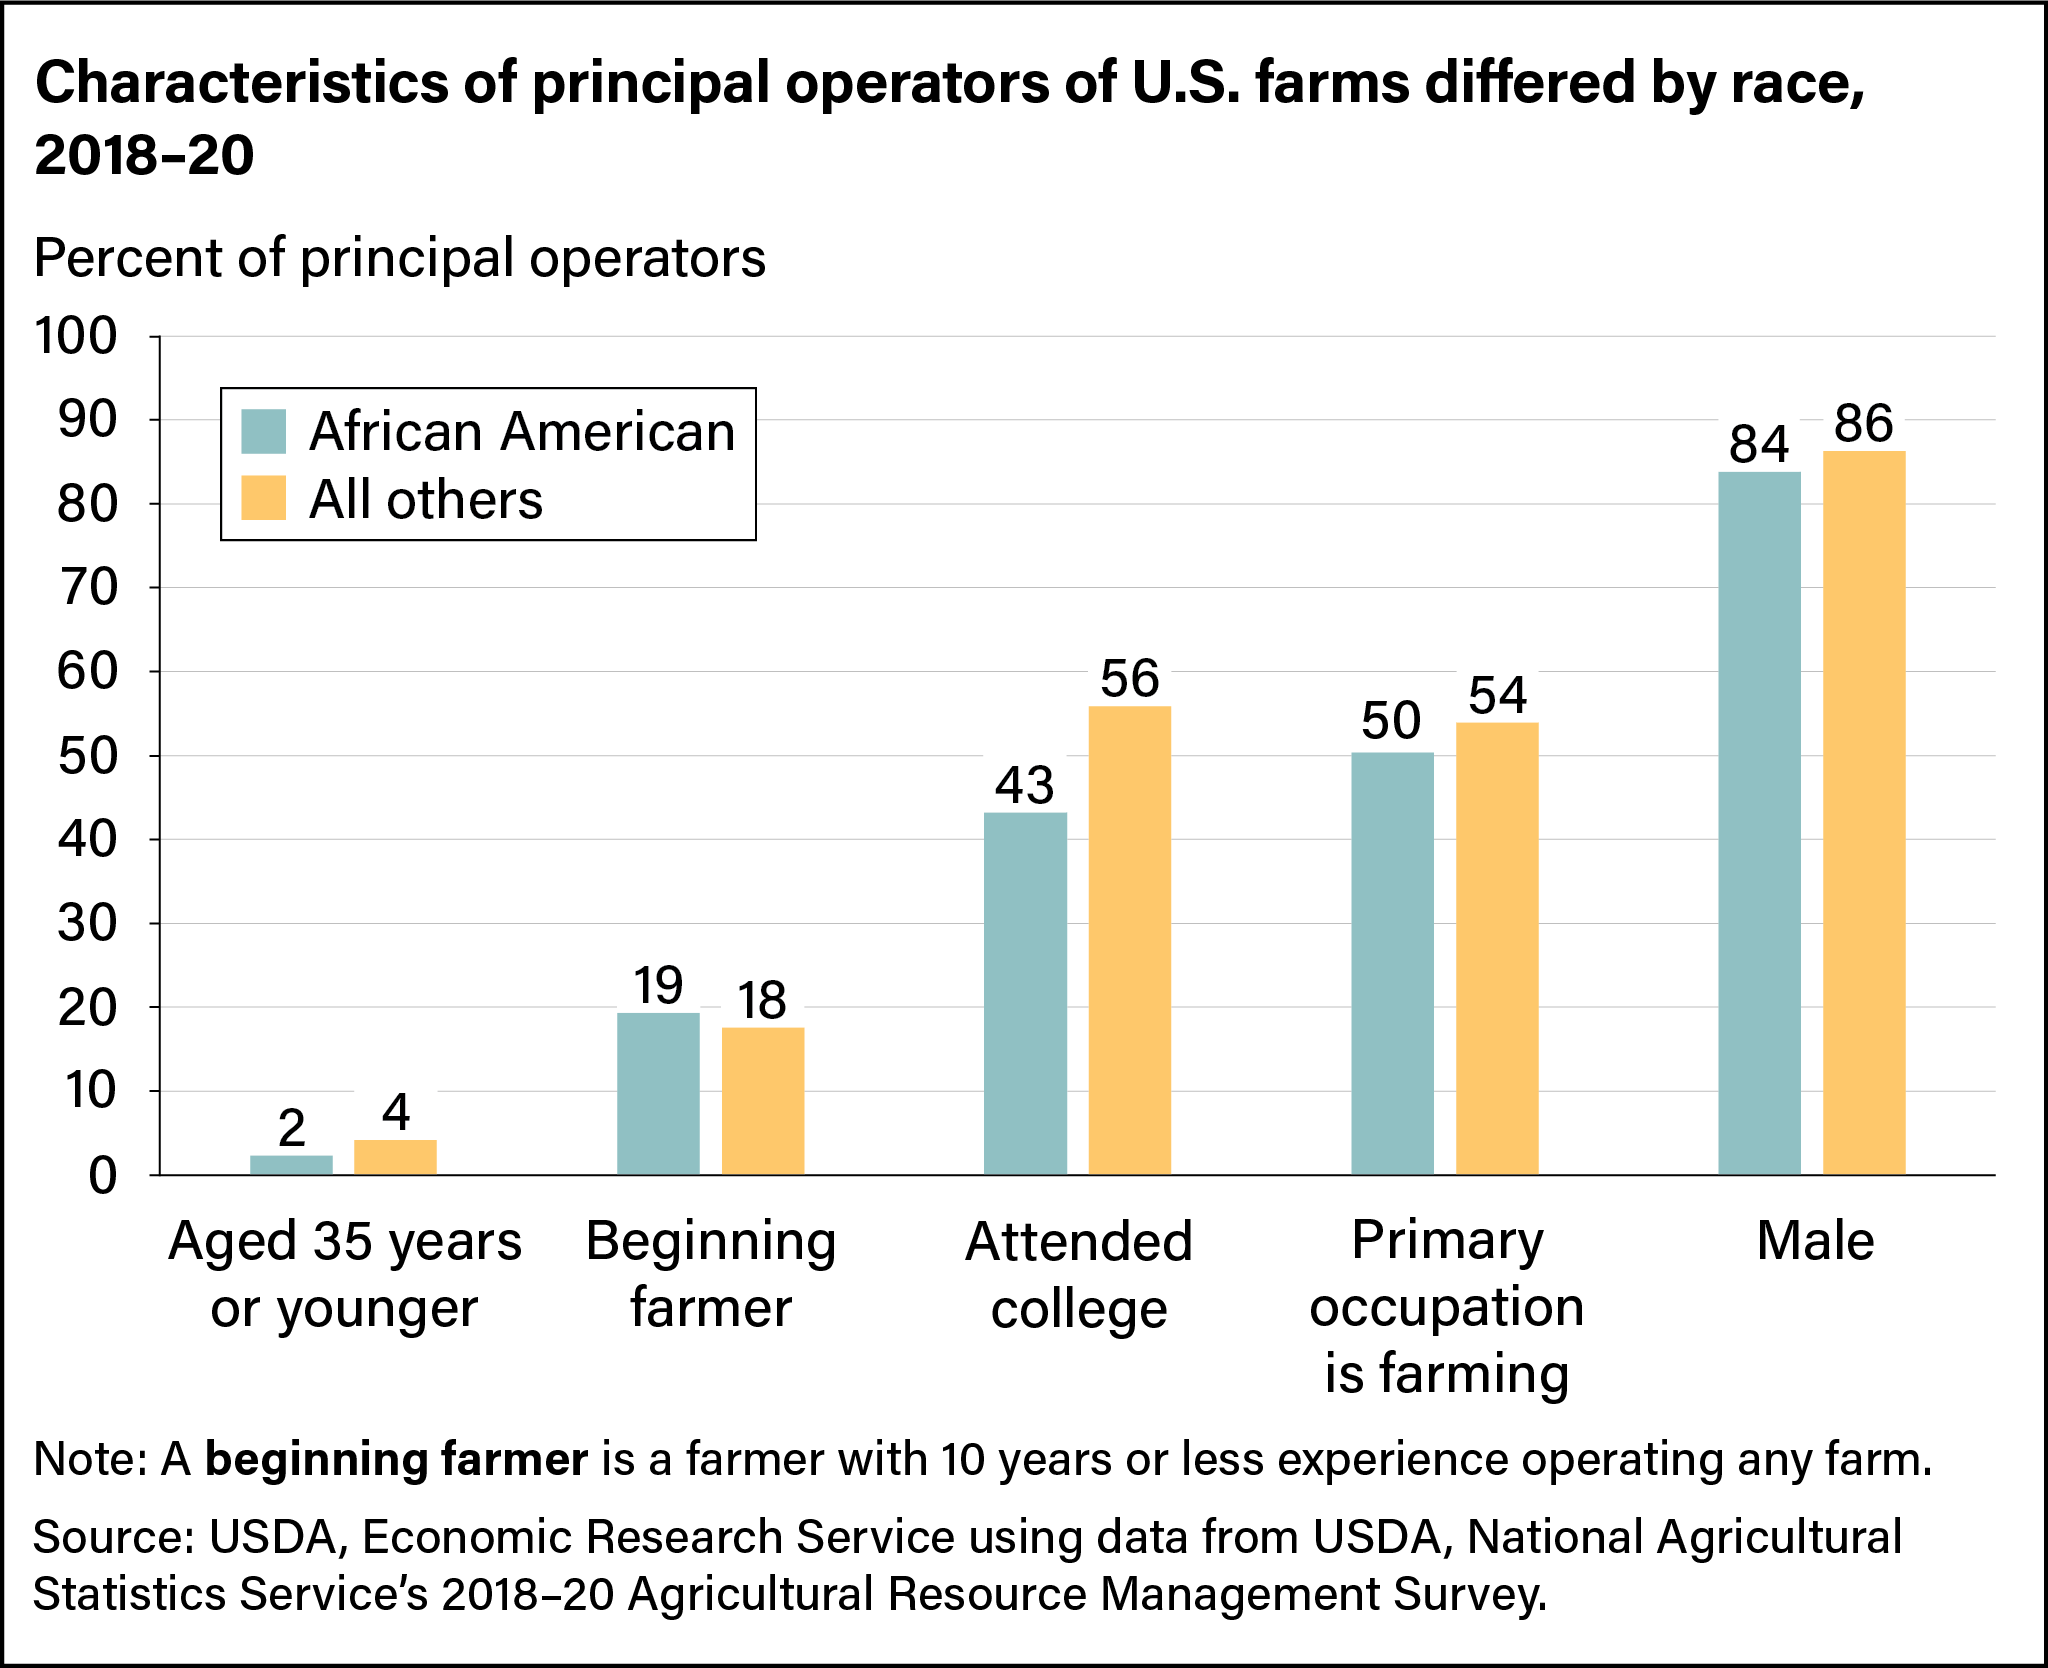
ERS researchers compared demographic traits of principal operators of U.S. farms. Based on ARMS data, the average African-American principal operator was 65 years old, about 5 years older than principal operators who were not African American. A significantly smaller share of African-American principal operators were 35 years old or less, although for each racial group, fewer than 5 percent were 35 or younger.
In addition, African-American farmers were significantly less likely to have attended college. Roughly 43 percent of African-American principal operators attended college compared with 56 percent of other principal operators. However, across all groups, less than 20 percent of principal operators were beginning farmers with 10 or fewer years of farming experience, and roughly half had primary occupations other than farming.
U.S. Farm Characteristics and Finances Differed by Race of the Principal Operator
Despite some similarities in the demographic traits of principal operators, the average farm size and financial position of African-American farms in 2018–20 were significantly different than for farms of other principal operators. One measure of farm size—the number of acres operated—showed that African-American farms were less than one-third the size of other farms.
The smaller farm size also meant African-American-operated farms generated significantly less income. For example, in 2018–20, the gross cash farm income (income before subtracting expenses) for the average African-American farm was roughly 85 percent less than for other farms. Government payments distributed through local, State, and Federal programs were another source of income for some farms. For African-American farmers, though, the average Government payment was roughly 40 percent less than for other farmers in 2018–20.
The average African-American-operated farm also was significantly less profitable. Net farm income, a proxy for farm profits, shows the amount of income and Government receipts remaining after deducting cash expenses such as feed, fertilizer, and rent and noncash expenses such as depreciation in the value of machinery. During 2018–20, the average non-African-American farm earned more than 20 times the net farm income of the average African-American farm. Non-African-American farms earned about $37,000 on average in net farm income (not adjusted for inflation), while the average African-American farm earned $1,500 in net farm income.
| Average per-farm statistics by race of principal operator, 2018–20 | |||
|---|---|---|---|
|
African American |
All others |
||
| Acres operated | 109 | 408 | |
| Gross cash farm income | $25,528 | $169,864 | |
| Net cash farm income | ($2,139) | $39,514 | |
| Government payments received | $16,168 | $27,413 | |
| Net farm income | $1,500 | $37,175 | |
| Off-farm income | $66,393 | $97,796 | |
|
Note: The chart shows average farm statistics by race of the principal operator, which are calculated by combining data from the 2018, 2019, and 2020 Agricultural Resource Management Surveys. Values in parentheses represent an income loss. Source: USDA, Economic Research Service using data from USDA’s Agricultural Resource Management Survey. |
|||
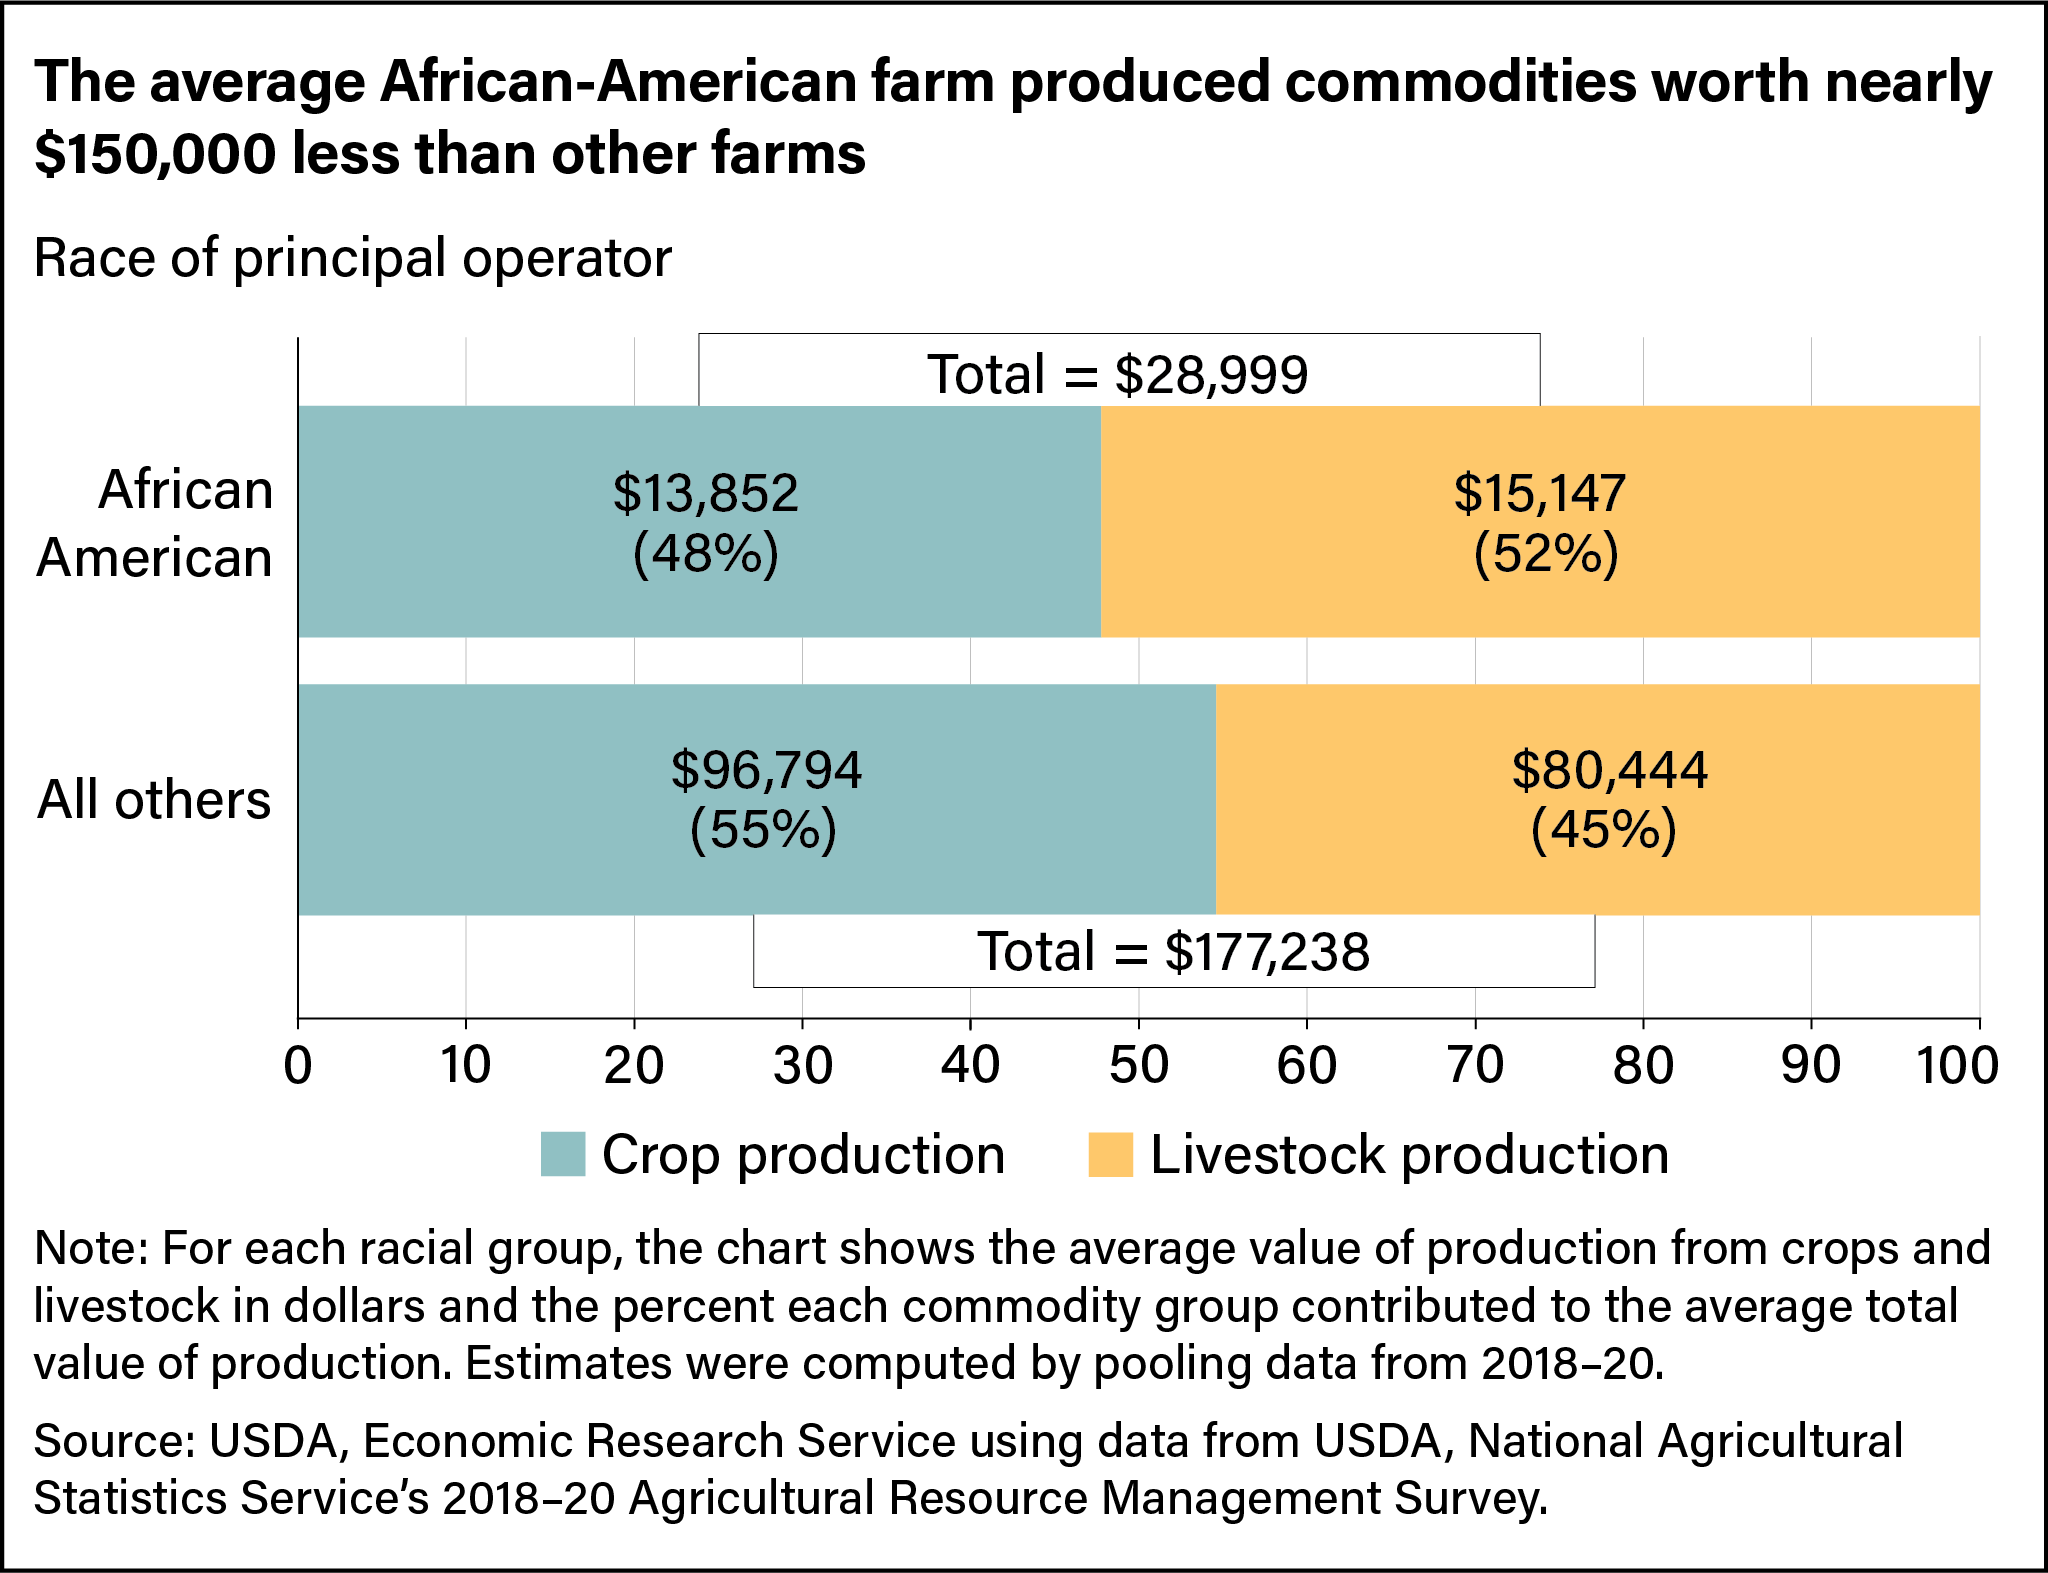
Differences in commodity choice also may contribute to differences in farm profits. On average, the value of production by African-American-operated farms was $29,000, with more than half of that coming from livestock sales. However, the value of production by other farms was about $177,000 on average, with most coming from crop sales. During 2018–20, about 83 percent of African-American farms were livestock farms (farms for which most of their value of production was derived from livestock sales). In contrast, about 66 percent of other farms were livestock farms. The share of the total value of production from crops was 15 percent for the average African-American farm compared with 34 percent for other farms. A focus on operating small livestock farms contributed to the substantially lower profitability of the average African-American farm compared with other farms.
Low profitability among U.S. farms in general has led principal operators of all racial and ethnic groups to work off the farm. In 2018–20, off-farm income was higher than net farm income for all groups.
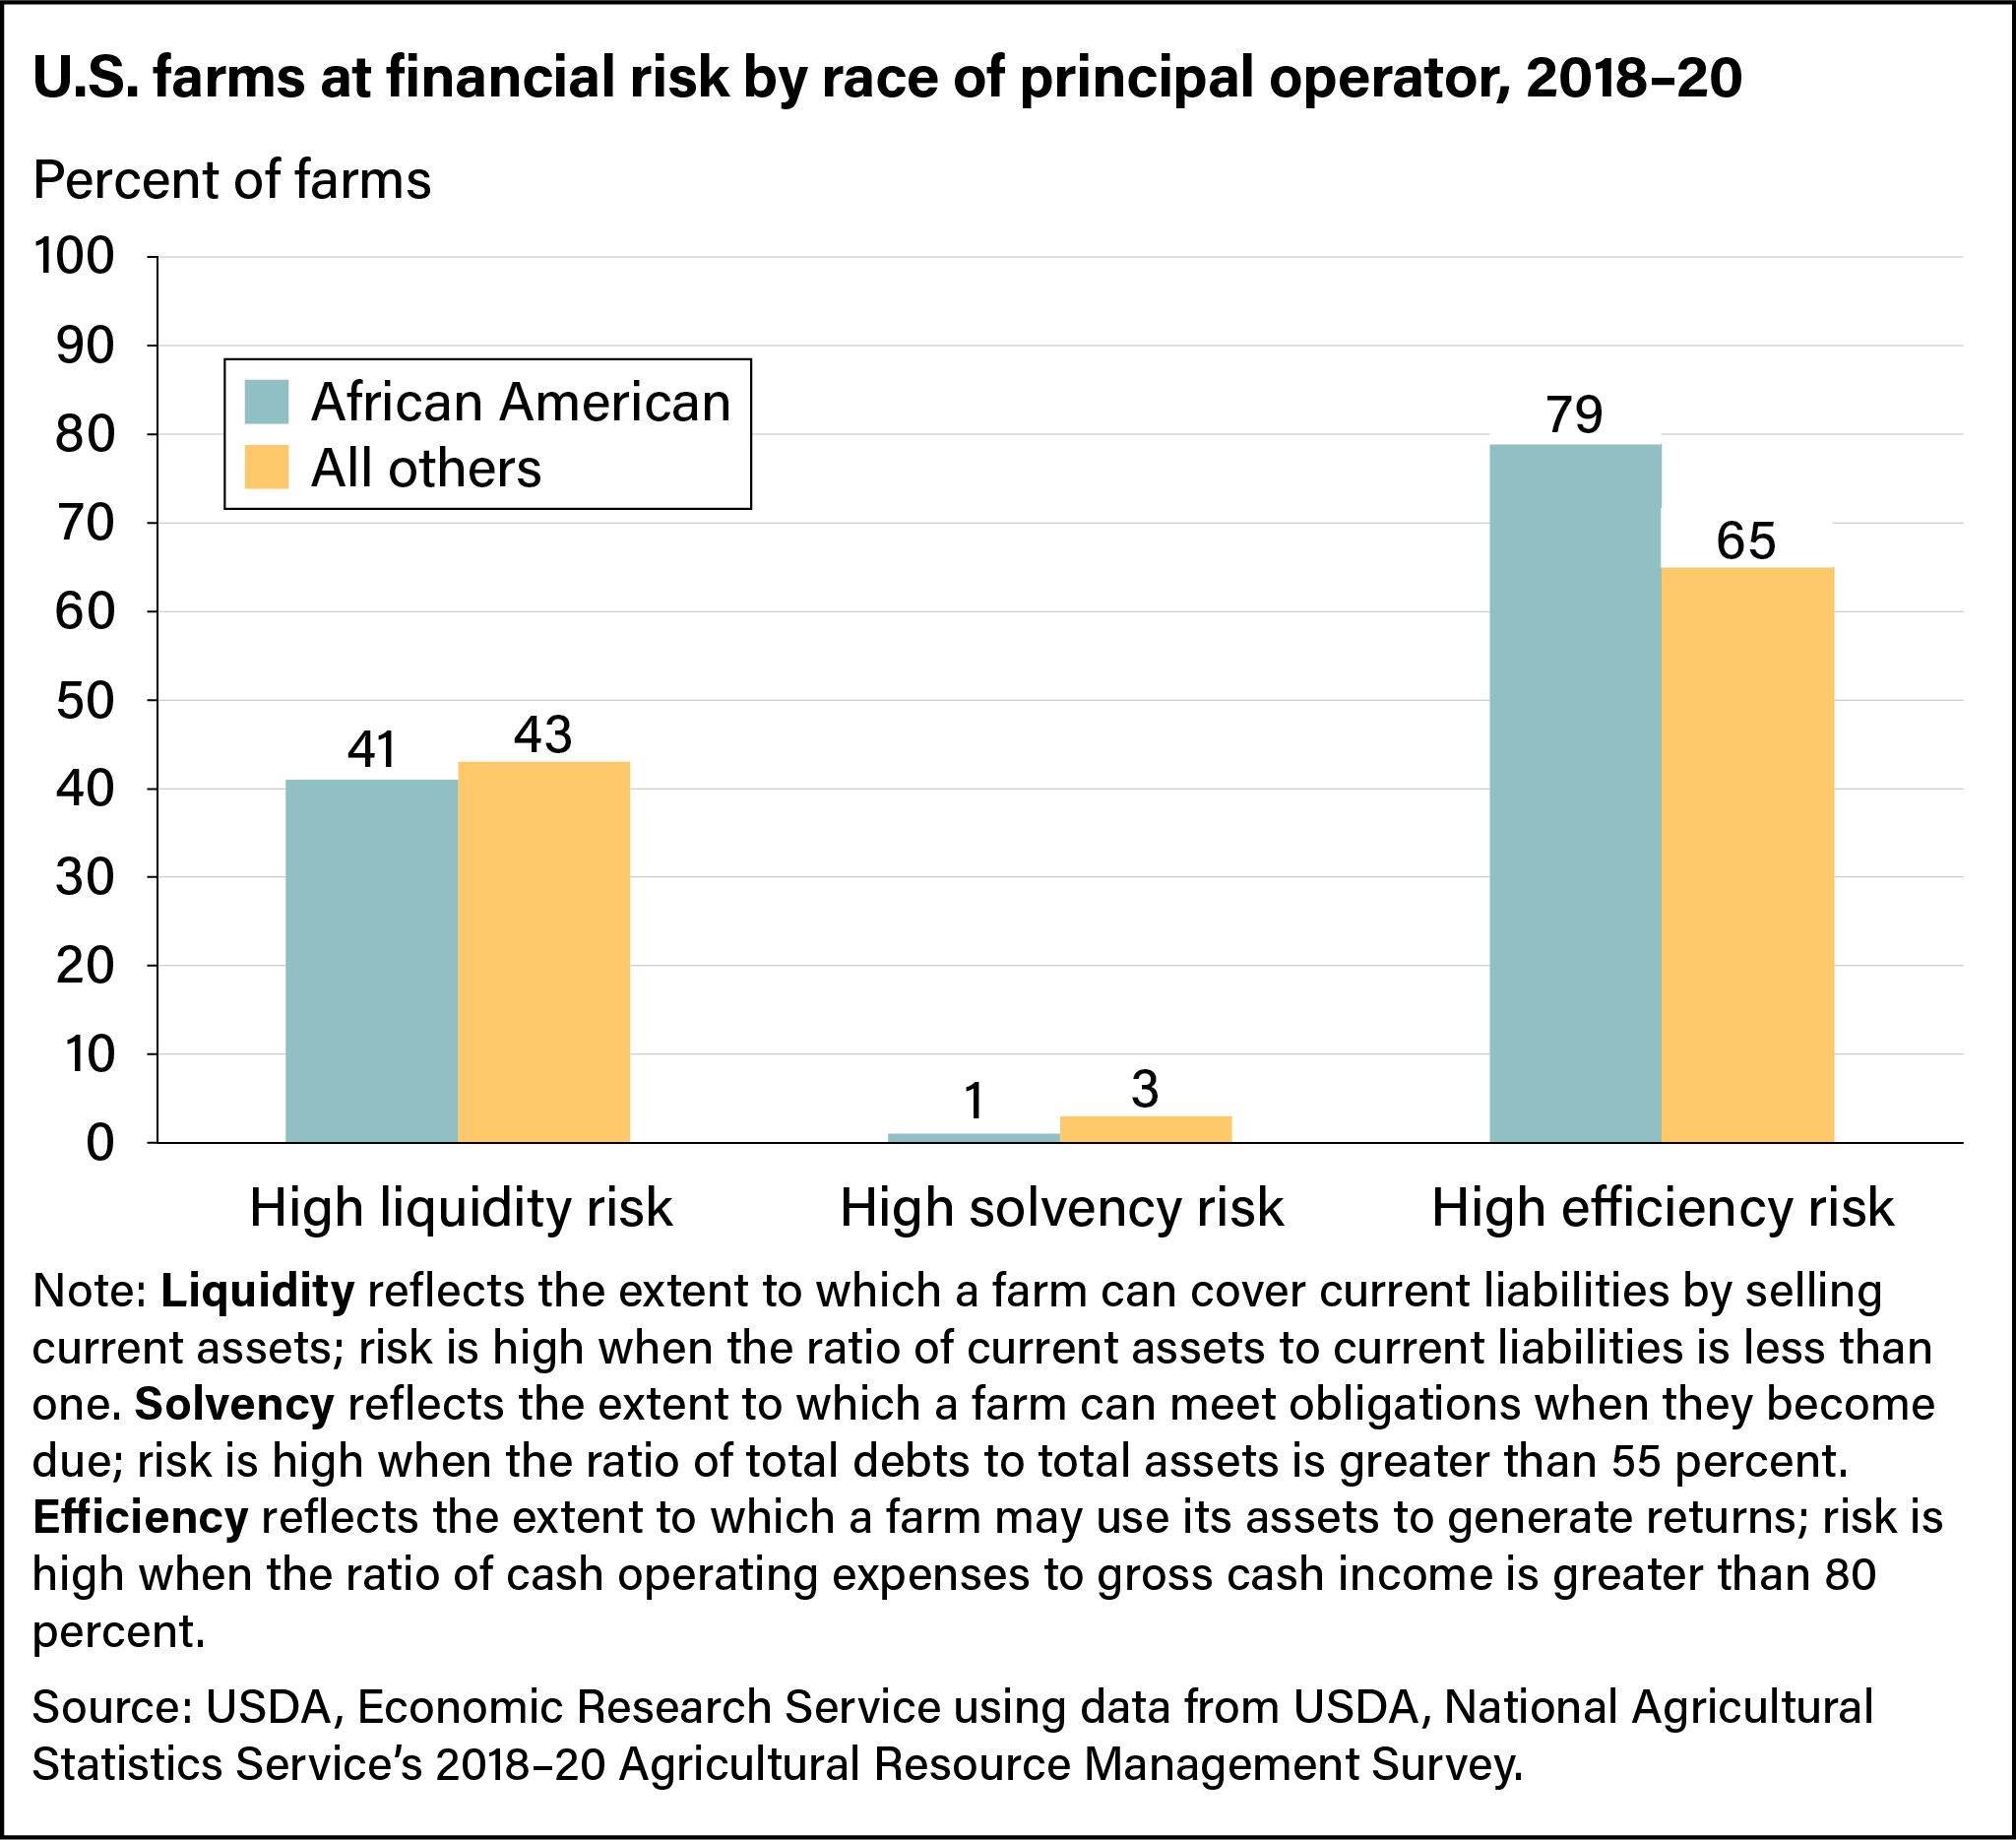
Regardless of Race, More Than Half U.S. Farms Experienced Financial Risk in 2018–20
Farm profitability can affect, and be affected by, farm liquidity, solvency, and efficiency. Liquidity is the ability to meet short-run obligations as they come due. Solvency is the ability to overcome adverse financial events and have long-run sustainability. Efficiency measures how well a farm uses its assets to generate income. ERS researchers estimated the share of farms that were at high financial risk in liquidity, solvency, and efficiency in 2018–20. They found no significant difference in the share of farms at high risk for liquidity problems. However, a lower share of African-American farms was at high risk for solvency problems, and a larger share was at high risk because of inefficiencies.
Smaller farm sizes, lower profitability, and greater specialization in livestock production are found to be associated with the lower solvency risk observed among farms operated by African Americans. Farm profitability affects credit access, and focusing on livestock production affects eligibility for Government programs that are based on crop production. Nearly half of African-American farms specialize in cattle and dairy production; most of those were small, beef cow-calf farms that are less likely to adopt advanced technologies and management practices such as artificial insemination, embryo implants, and input price negotiations for future delivery (known as forward purchasing of inputs). African-American farms also have limited access to financial resources such as credit and are less able than larger operations to take advantage of cost savings known as scale economies, both of which may have contributed to less efficiency among African-American farms.
Regardless of race, a large share of U.S. farms struggled to earn profits, generate returns, and meet short-run financial obligations in 2018–20.
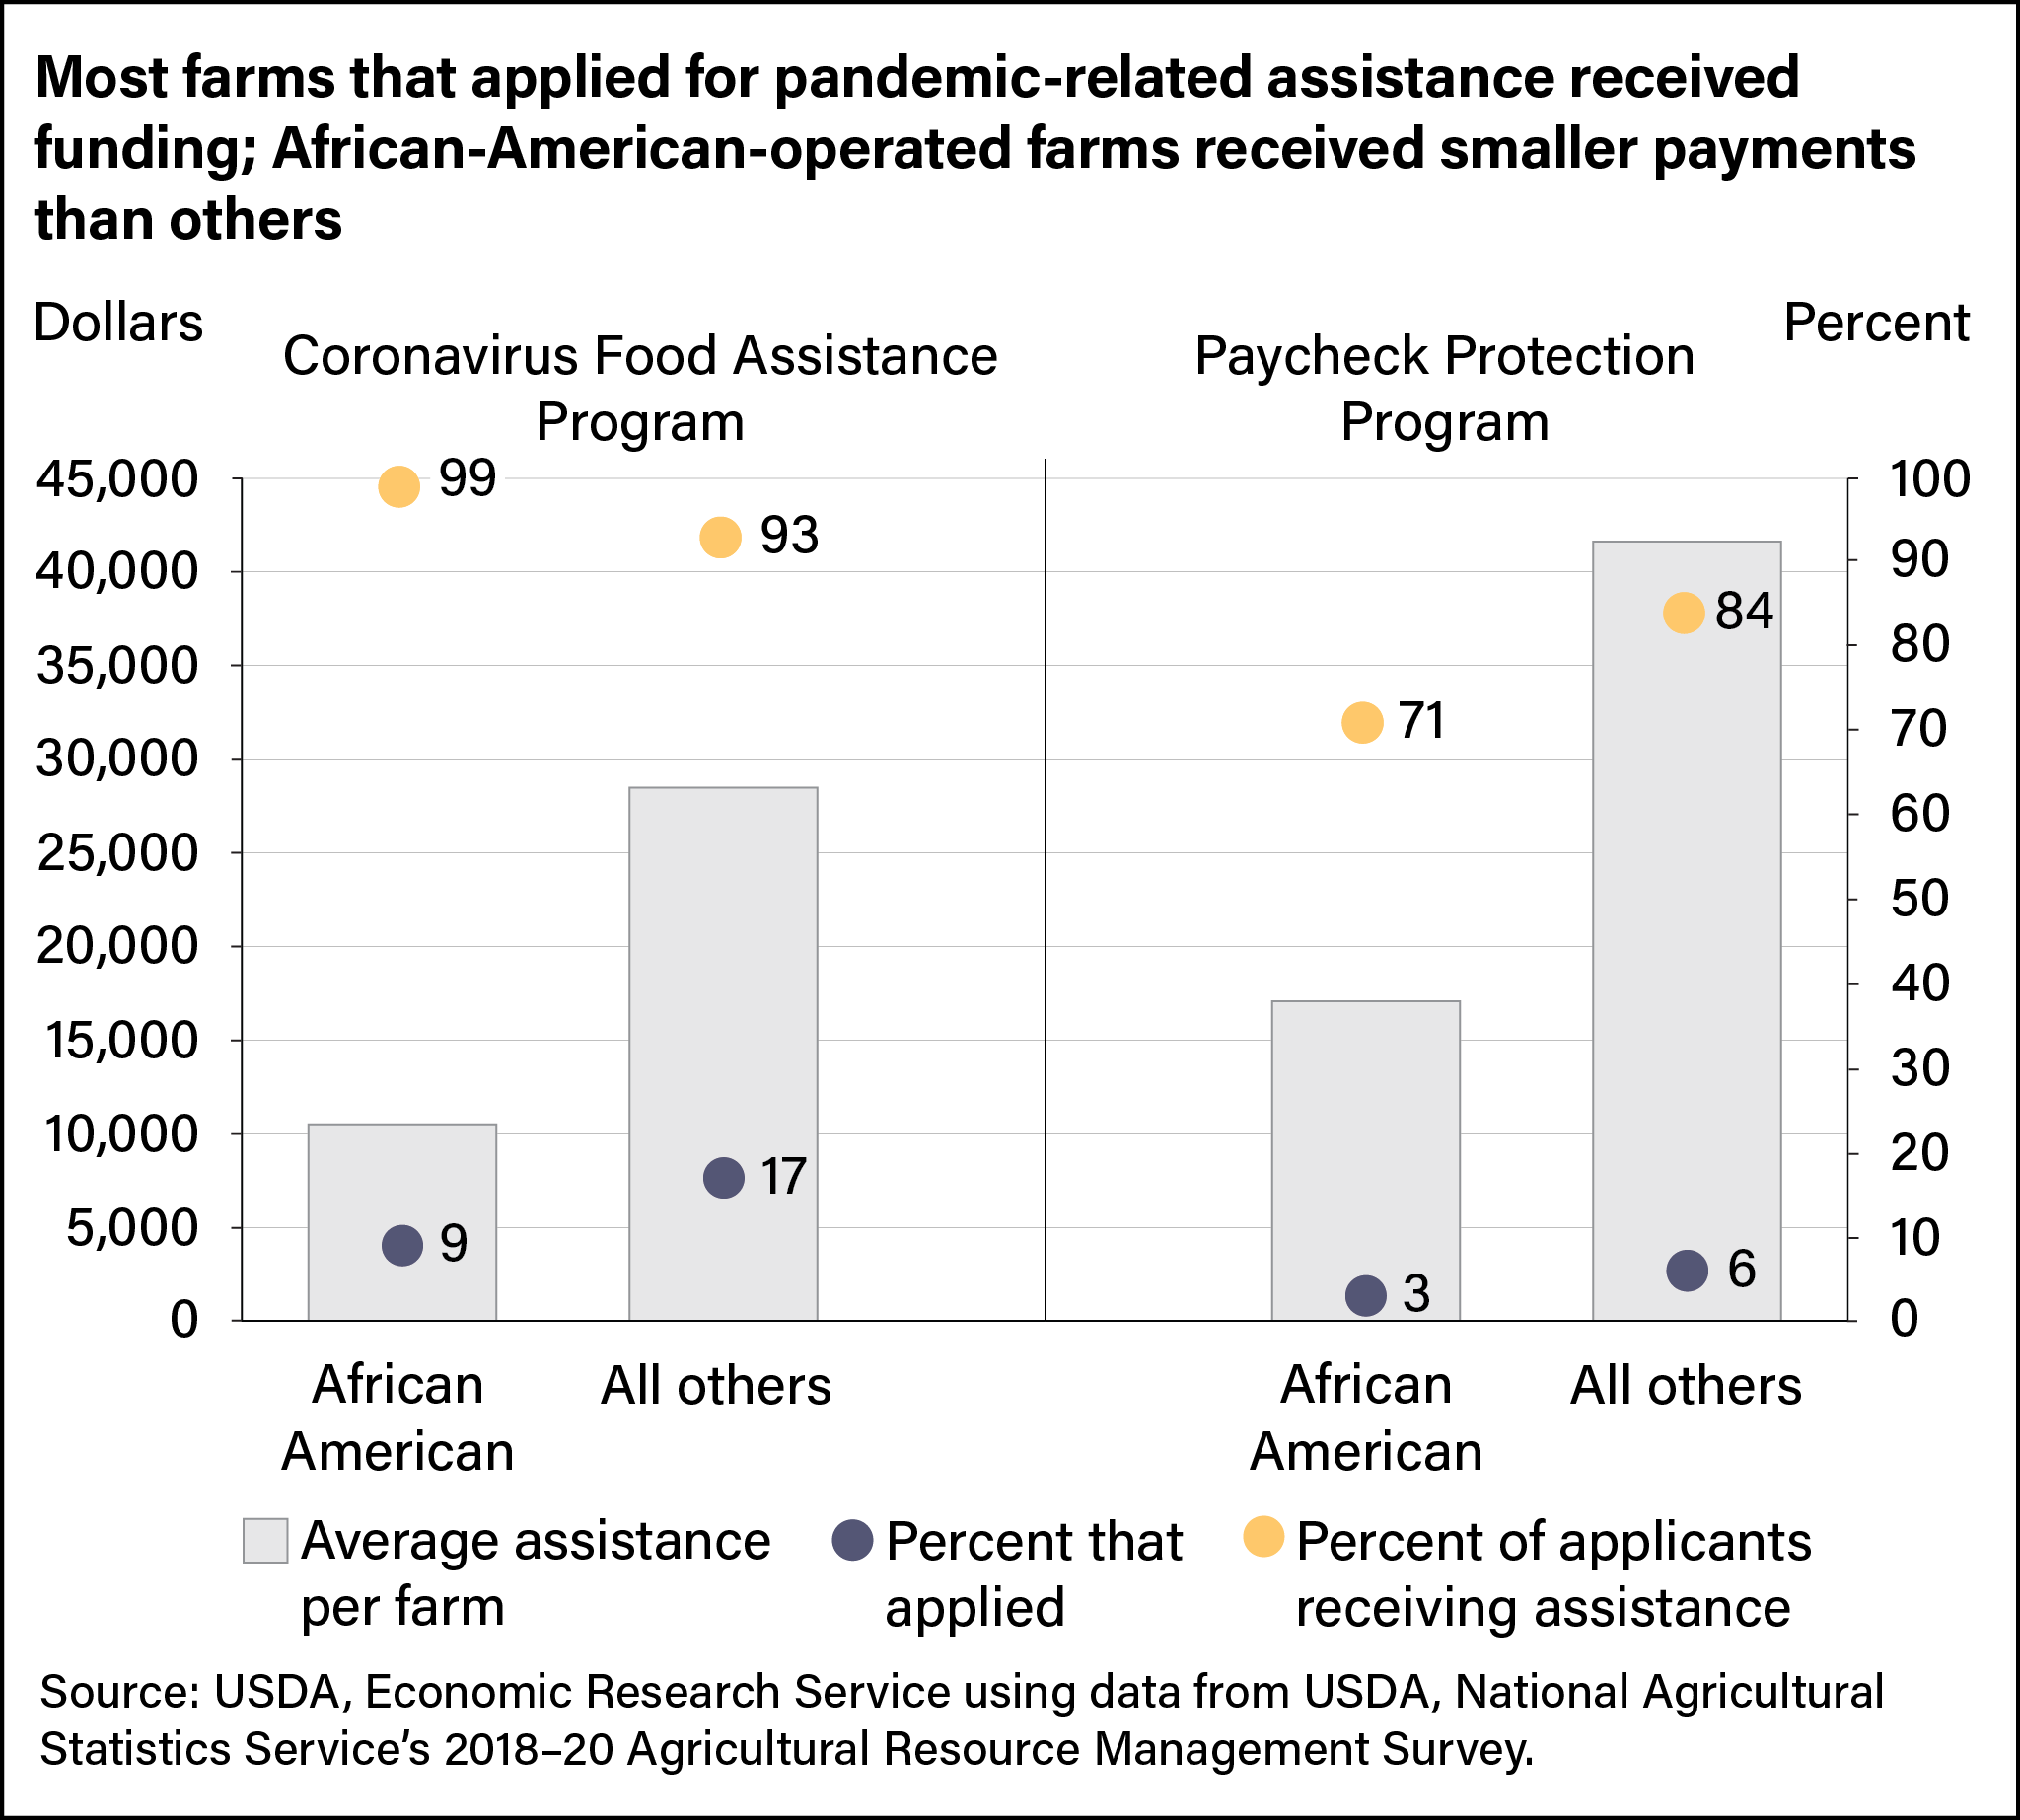
COVID-Related Government Programs Provided Aid to Farmers in 2020
During the COVID-19 pandemic, the Federal Government offered financial assistance to farms through CFAP and the Paycheck Protection Program (PPP). The ARMS data suggest that fewer than 20 percent of U.S. farms applied for CFAP or PPP assistance; however, more than 70 percent of farms that applied received assistance.
For both CFAP and PPP, a significantly smaller share of African-American-operated farms applied for assistance than other farms, and the average payments to African-American producers were less than half the size of payments to other farmers. Significant differences in the share of farms that applied and in the average payments received are in part due to differences in commodity choice and farm size. CFAP payments were commodity specific and partly based on the level of production that was at risk and not marketed or held in inventory. PPP assistance was partly based on average monthly payroll costs such as employee salaries and wages and business rent or lease payments, which are lower on average for smaller farms.
This article is drawn from:
- Collins, L.A., McDonald, T.M., Giri, A.K. & Subedi, D. (2023). The relative financial performance of African American farms in the United States since the great recession. Applied Economic Perspectives and Policy. https://doi.org/10.1002/aepp.13346 .
You may also like:
- ARMS Farm Financial and Crop Production Practices. (n.d.). U.S. Department of Agriculture, Economic Research Service.
- Farm Income and Wealth Statistics. (n.d.). U.S. Department of Agriculture, Economic Research Service.
- 2014 Farm Bill - Socially Disadvantaged and Veteran Farmers and Ranchers. (n.d.). U.S. Department of Agriculture, Economic Research Service.
- Giri, A.K., Litkowski, C., Subedi, D. & McDonald, T.M. (2022). COVID-19 Working Paper: Farm Sector Financial Ratios: Pre-COVID Forecasts and Pandemic Performance for 2020. U.S. Department of Agriculture, Economic Research Service. AP-104.
- Callahan, S. & Hellerstein, D. (2022). Access to Farmland by Beginning and Socially Disadvantaged Farmers: Issues and Opportunities. U.S. Department of Agriculture, Economic Research Service. AP-096.
- Tulman, S., Higgins, N., Williams, R., Gerling, M., Dodson, C. & McWilliams, B. (2016). USDA Microloans for Farmers: Participation Patterns and Effects of Outreach. U.S. Department of Agriculture, Economic Research Service. ERR-222.