

New Analysis Approach Illuminates Differences in Food Spending Across U.S. Populations
- by Abigail Okrent and Eliana Zeballos
- 5/31/2023
The Coronavirus (COVID-19) pandemic affected the way U.S. consumers acquired food. Early stay-at-home orders limited access to foodservice venues, or food away from home (FAFH), which had been a significant source of food for U.S. consumers. Households shifted their spending from FAFH to food at home (FAH) by shopping at grocery stores or other retailers such as mass merchandisers, discount retailers, and liquor stores. Researchers at USDA, Economic Research Service (ERS) recently presented a new approach to examining these recent shifts in food spending using the Consumer Expenditure Diary Survey, which allows for analysis across U.S. subpopulations by categories such as race and ethnicity. Changes in where households bought and consumed foods (including alcohol) during the pandemic translated into changes in what foods were purchased. Under the new approach, foods are grouped to align closely with the Dietary Guidelines for Americans, making it easier to infer how food purchasing changes translate into dietary outcomes.
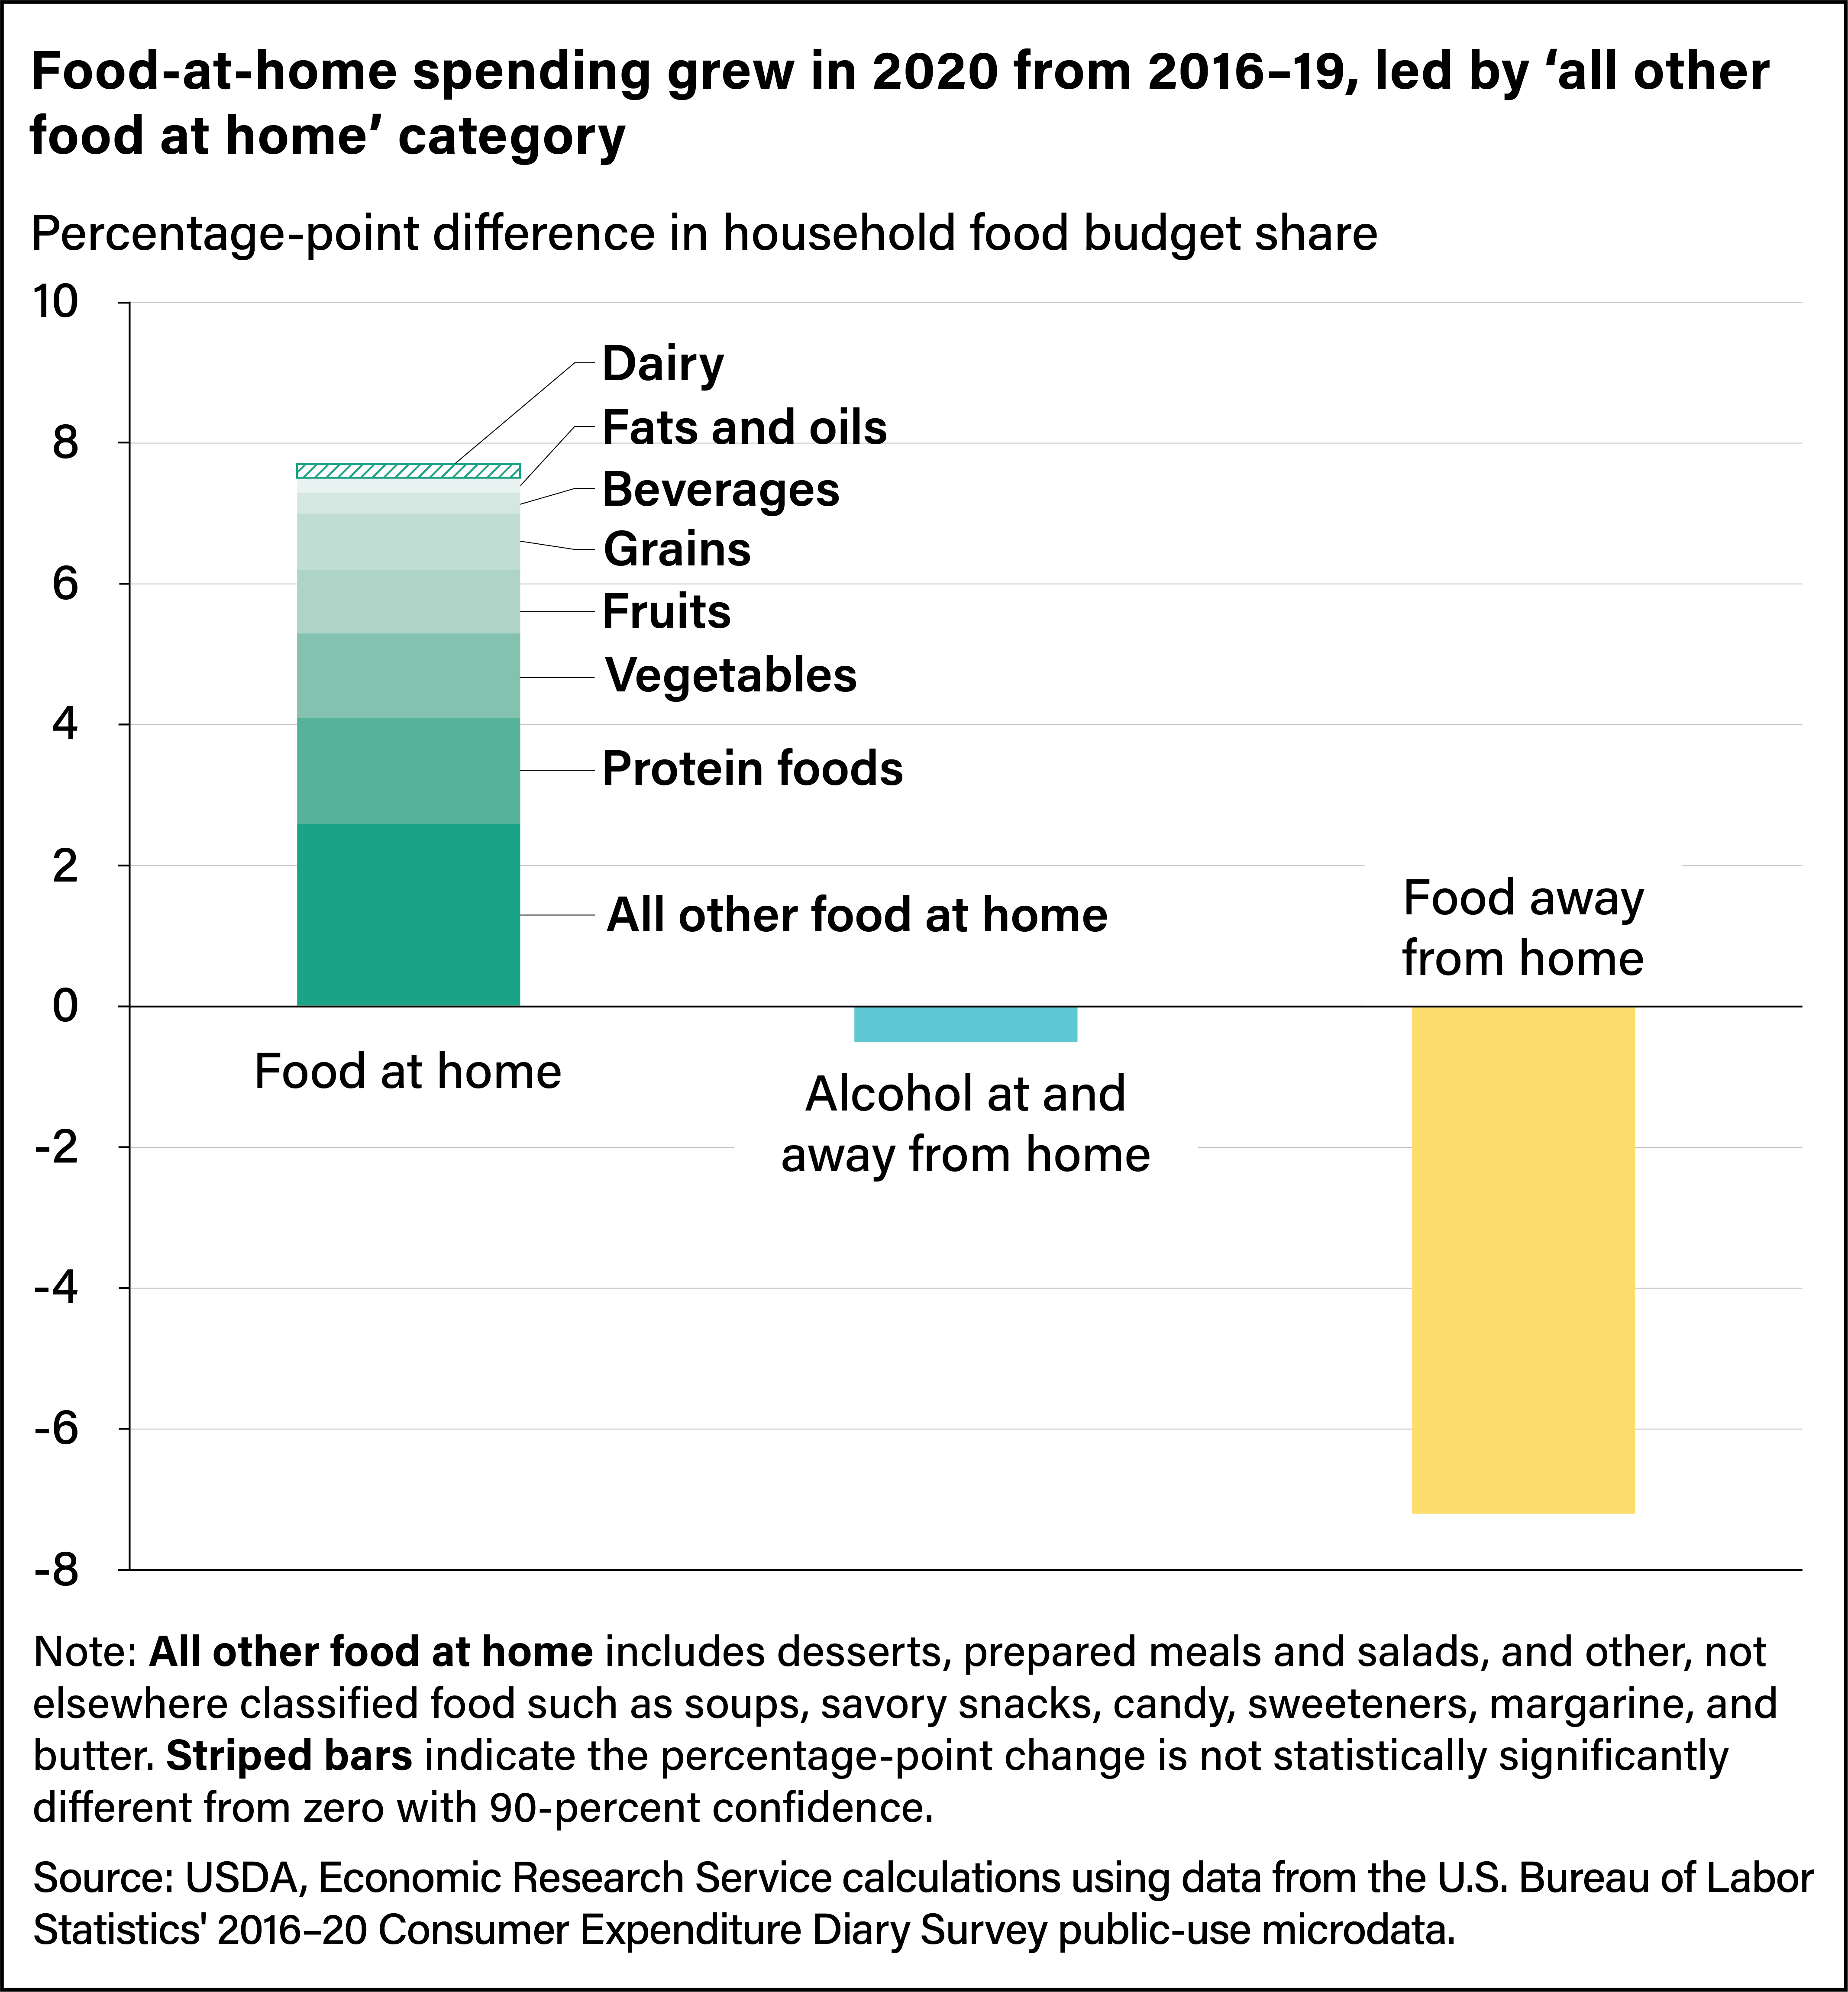
The average U.S. household food budget comprises three categories: FAFH, FAH, and alcohol at and away from home. The share of FAFH in these budgets diminished during the first 9 months of the pandemic, declining to 29.3 percent in 2020 from 36.5 percent in 2016–19. As a result, the FAH budget share increased to 66.4 percent from 58.6 percent. The largest contributions to this change were from a category called “all other FAH,” which includes prepared meals and salads, desserts, and foods not elsewhere classified such as soups, savory snacks, candy, sweeteners, margarine, and butter. “All other FAH” was by far the largest FAH category before the pandemic, and its share of the household food budget increased to 19.8 percent from 17.2 percent, or by 2.6 percentage points, during this period. This is a large increase compared with typical year-to-year changes in food-at-home spending shares, which averaged a 0.2-percentage-point decrease between 1997 and 2019, according to ERS’ Food Expenditure Series. However, this increase was unevenly distributed across racial and ethnic populations and among subcategories within “all other FAH.”
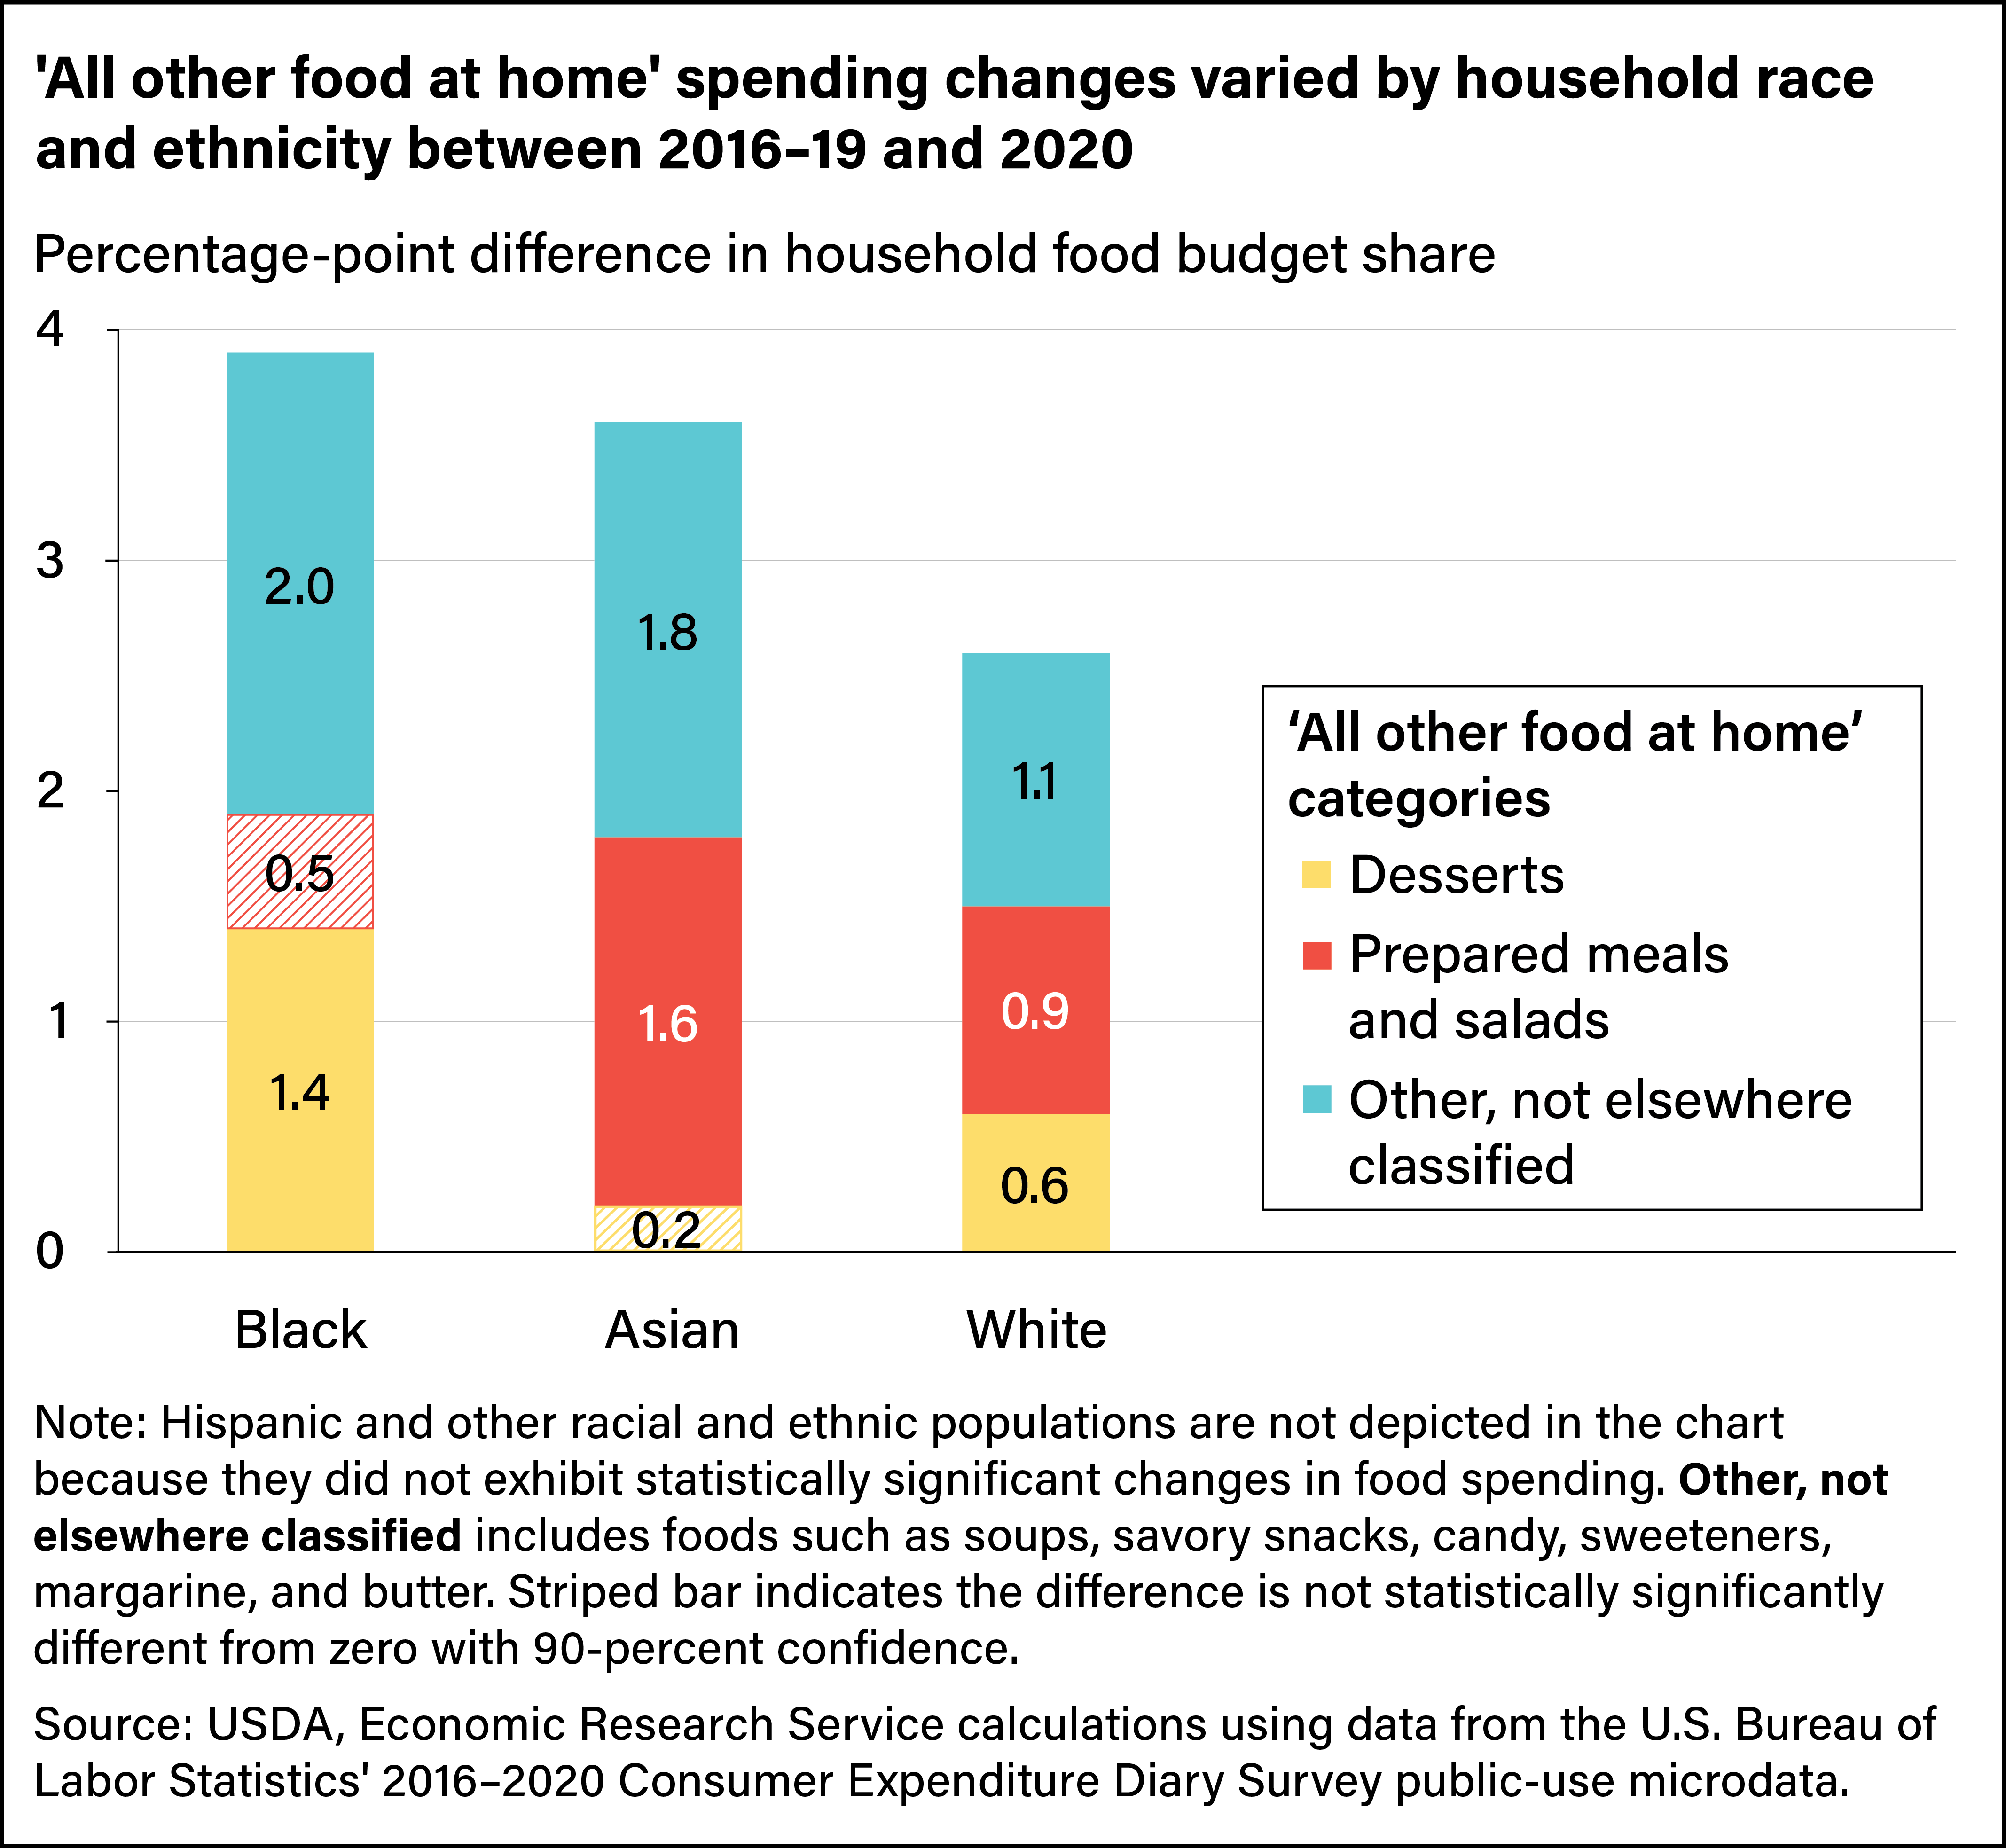
All U.S. racial and ethnic subpopulations except Hispanic households increased their total food budget share for “all other FAH” in 2020 compared with the period from 2016 to 2019. On the upper end, Black households increased their budget shares for “all other FAH” the most, followed by Asian households. The increase by Asian households on “all other FAH” was driven by a 1.6-percentage-point rise in prepared meals and salads and a 1.8-percentage-point increase in other, not elsewhere classified foods such as snacks. In contrast, Black households had a relatively large increase in other, not elsewhere classified foods (2.0 percentage points) and desserts (1.4 percentage points). Although some of these changes may suggest unhealthy purchasing patterns, fluctuations in other food categories indicate just the opposite. For example, the share of the budget on fruits and vegetables grew the fastest during the first year of the pandemic. For all categories, however, the magnitude of changes varied across racial and ethnic groups.
ERS plans to use and build upon this new approach to examine future food spending trends and dietary outcomes among U.S. populations.
Errata: On June 26, 2023, the second figure in this article was revised to correct the dates represented by the data.
This article is drawn from:
- Okrent, A. & Zeballos , E. (2022). COVID-19 Working Paper: Consumer Food Spending Changes During the COVID-19 Pandemic. U.S. Department of Agriculture, Economic Research Service. AP-110.
You may also like:
- Food Expenditure Series. (n.d.). U.S. Department of Agriculture, Economic Research Service.
- Weekly Retail Food Sales. (n.d.). U.S. Department of Agriculture, Economic Research Service.
- Zeballos , E., Sinclair, W. & Park, T. (2021). Understanding the Components of U.S. Food Expenditures During Recessionary and Non-Recessionary Periods. U.S. Department of Agriculture, Economic Research Service. ERR-301.
- McLaughlin, P.W., Stevens, A., Dong, X., Chelius, C., Marchesi, K. & MacLachlan, M. (2022). COVID-19 Working Paper: National Trends in Food Retail Sales During the COVID-19 Pandemic: Findings from Information Resources, Inc. (IRI) Retail-Based Scanner Data. U.S. Department of Agriculture, Economic Research Service. AP-108.
- Marchesi, K. & McLaughlin, P.W. (2022). COVID-19 Working Paper: The Impact of COVID-19 Pandemic on Food-Away-From-Home Spending. U.S. Department of Agriculture, Economic Research Service. AP-100.