

Removing Nontariff Import Barriers Could Increase China’s Imports of Pork, Beef, Corn, and Wheat, ERS Research Shows
- by Stephen Morgan, Fred Gale, Jayson Beckman, Ethan Sabala, Danielle J. Ufer, Adriana Valcu-Lisman and Wendy Zeng
- 3/30/2023
Highlights
- China imported more than $205 billion worth of agricultural products in 2021, including more than $37 billion from the United States, yet trade barriers deterred China’s imports from reaching even higher levels.
- Using data from mid-2020 through mid-2021, USDA’s Economic Research Service (ERS) estimated that China’s nontariff barriers generated significant price wedges so that China’s domestic prices exceeded the price of U.S. imports by 57.5 percent for beef, 64 percent for corn, 213 percent for pork, and 42 percent for wheat.
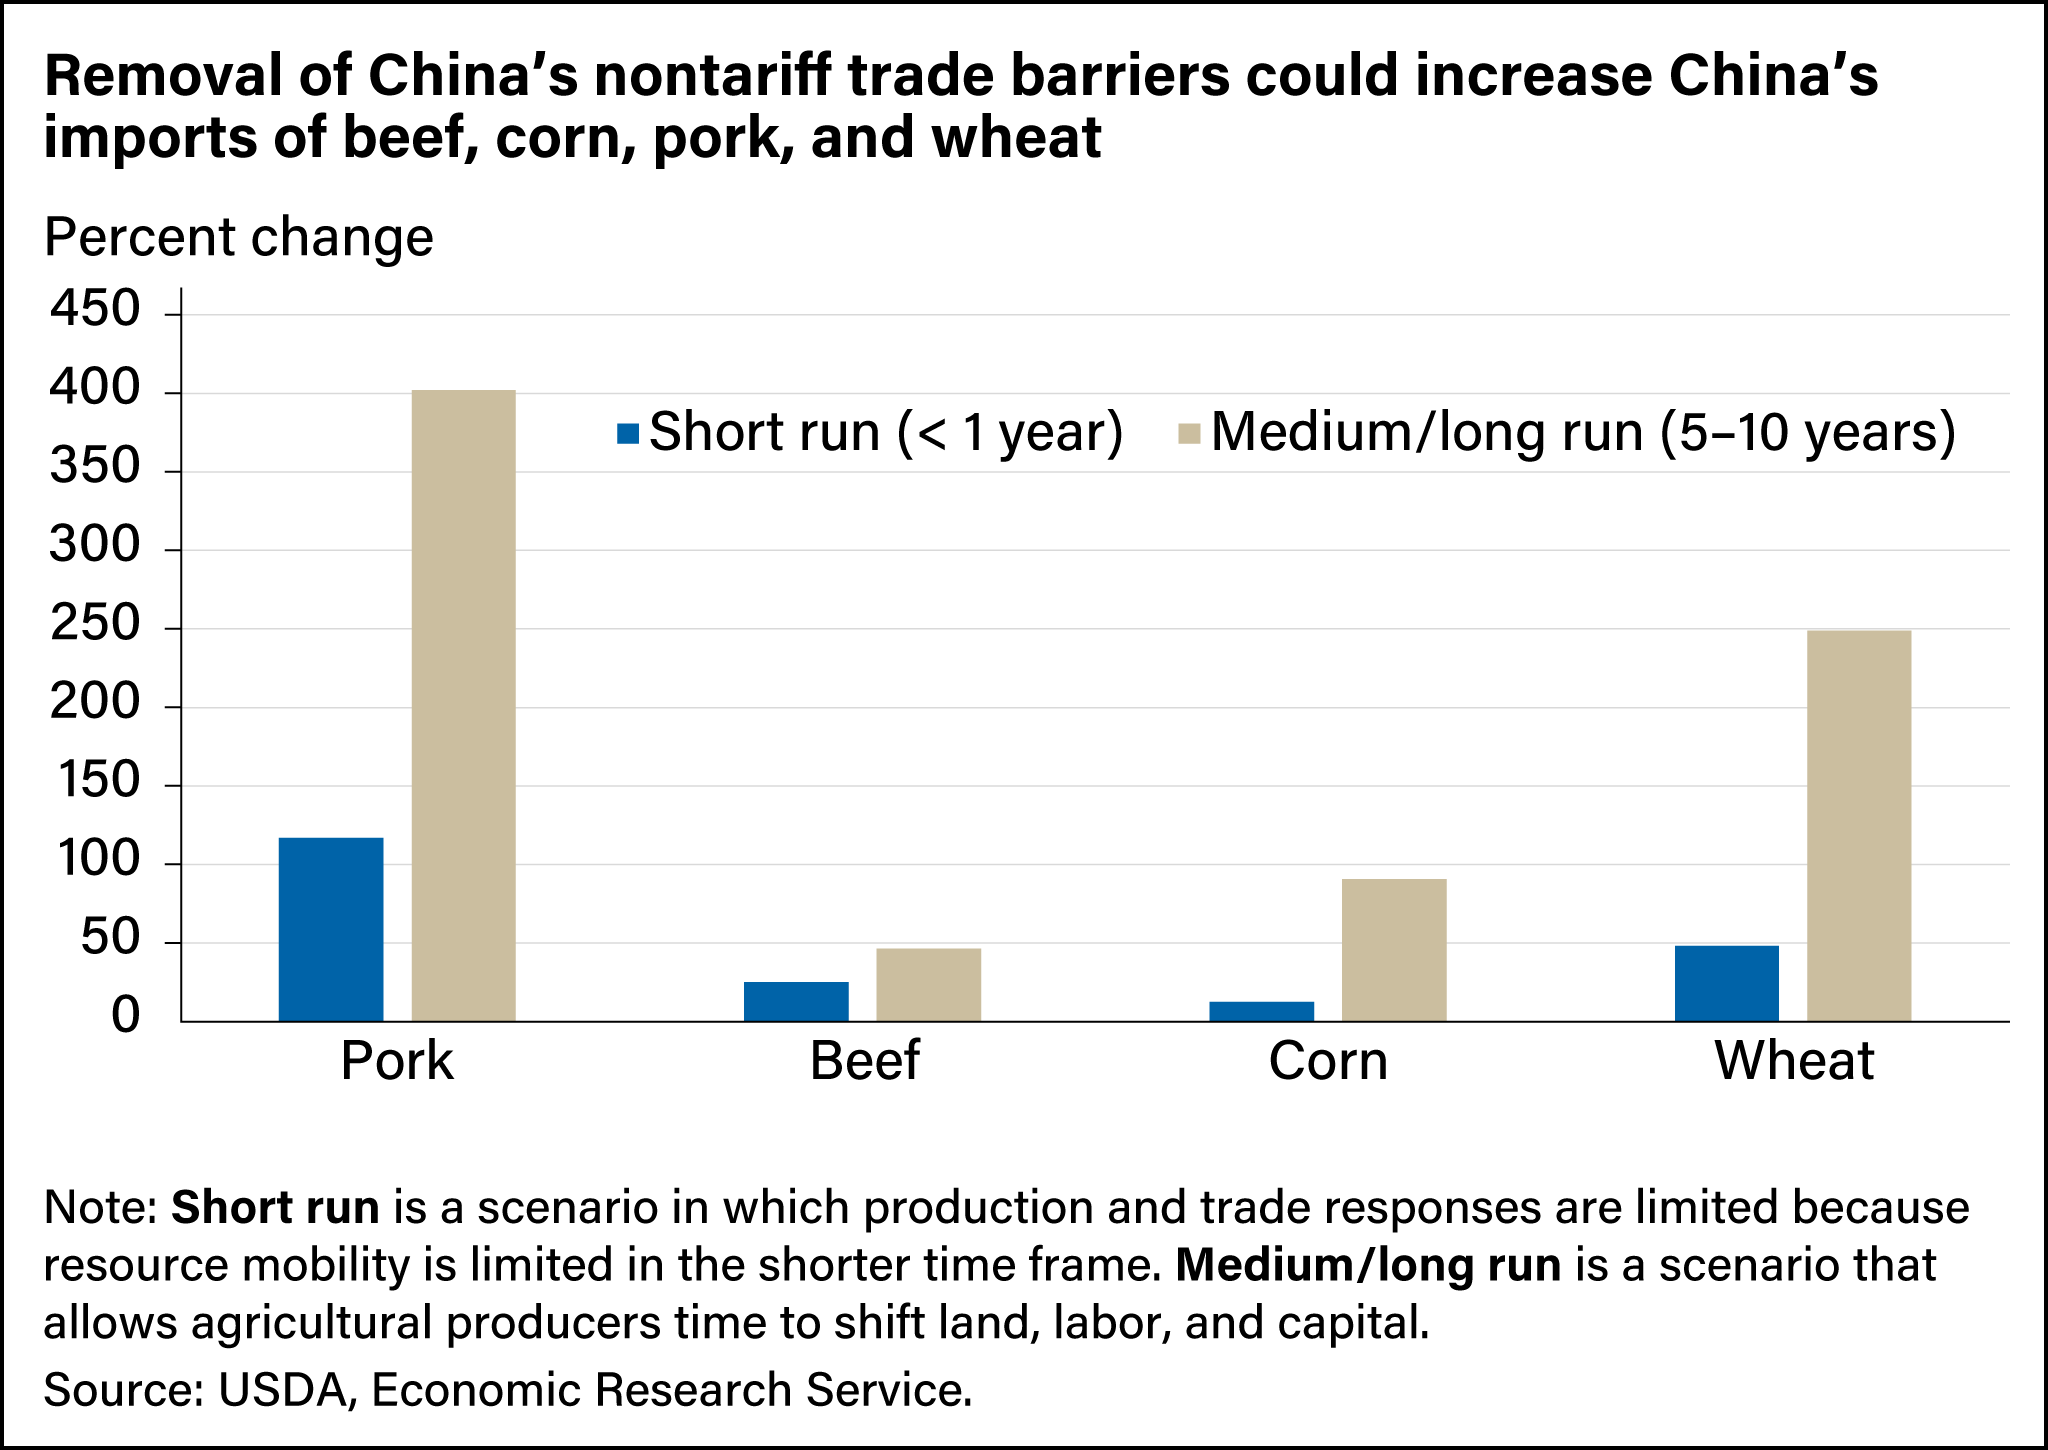
- To assess how removing nontariff barriers might affect China’s imports, ERS analyzed the shorter and longer term effects on trade in a scenario in which price wedges narrowed to zero. For all beef, corn, pork, and wheat, researchers estimated removing nontariff barriers would lead to an increase in imports, with the largest increases expected for pork and wheat.
China imported more than $205 billion of agricultural products in 2021, including more than $37 billion from the United States. Despite this value of trade, China’s agricultural imports appear to remain short of their full potential, especially for certain commodities. Over the past two decades, China has opened trade borders through tariff cuts and by reducing direct Government intervention in foreign trade. For example, the U.S. Economic and Trade Agreement (Phase One) with China, signed in 2020, included provisions that address dozens of such barriers. Still, impediments to bilateral trade growth remain, including nontariff measures such as quotas, differences in standards, bans on certain inputs, bans due to disease, detection of weed seeds for foreign material in shipments, or strict certification requirements for exporters. The existence of these barriers limit trade even with tariff reductions.
Nontariff measures impede China’s trade in two ways. First, they directly limit the volume of imports and restrict the supply of commodities in China. They also keep Chinese prices high, thus encouraging more domestic production to substitute for imported commodities. One of the outcomes of China’s import barriers, therefore, is a “price wedge” in which domestic commodity prices are often higher than international prices. Price wedges are frequently used as an indicator of the presence of nontariff trade barriers when they are otherwise hard to observe.
In the early 2000s, when China joined the World Trade Organization, most price wedges were near zero as the country’s prices of farm commodities tended to be at or below prices in global markets as reflected by prices for U.S. commodities. However, price wedges calculated in 2020 varied from 13 percent for soybeans and 15 percent for cotton, to 38 percent for wheat, 43 percent for beef, 48 percent for corn, and 181 percent for pork. The wedges for cotton and soybeans—commodities that consistently have been traded in large volumes—are relatively modest. However, the larger wedges for wheat, corn, beef, and pork suggest that barriers other than tariffs might be impeding the flow of imports for these commodities. Without these trade barriers, a country would tend to import more products when domestic prices are higher than the international price. The increase in imports would then reduce domestic prices, narrowing or eliminating the price wedge.
Researchers at USDA’s Economic Research Service (ERS) evaluated how China’s imports would potentially change if hidden barriers to imports were eliminated and price wedges for pork, beef, corn, and wheat narrowed to zero. For all four commodities, researchers estimated that removing nontariff trade barriers could lead to higher levels of imports, with the largest increases expected for pork and wheat.
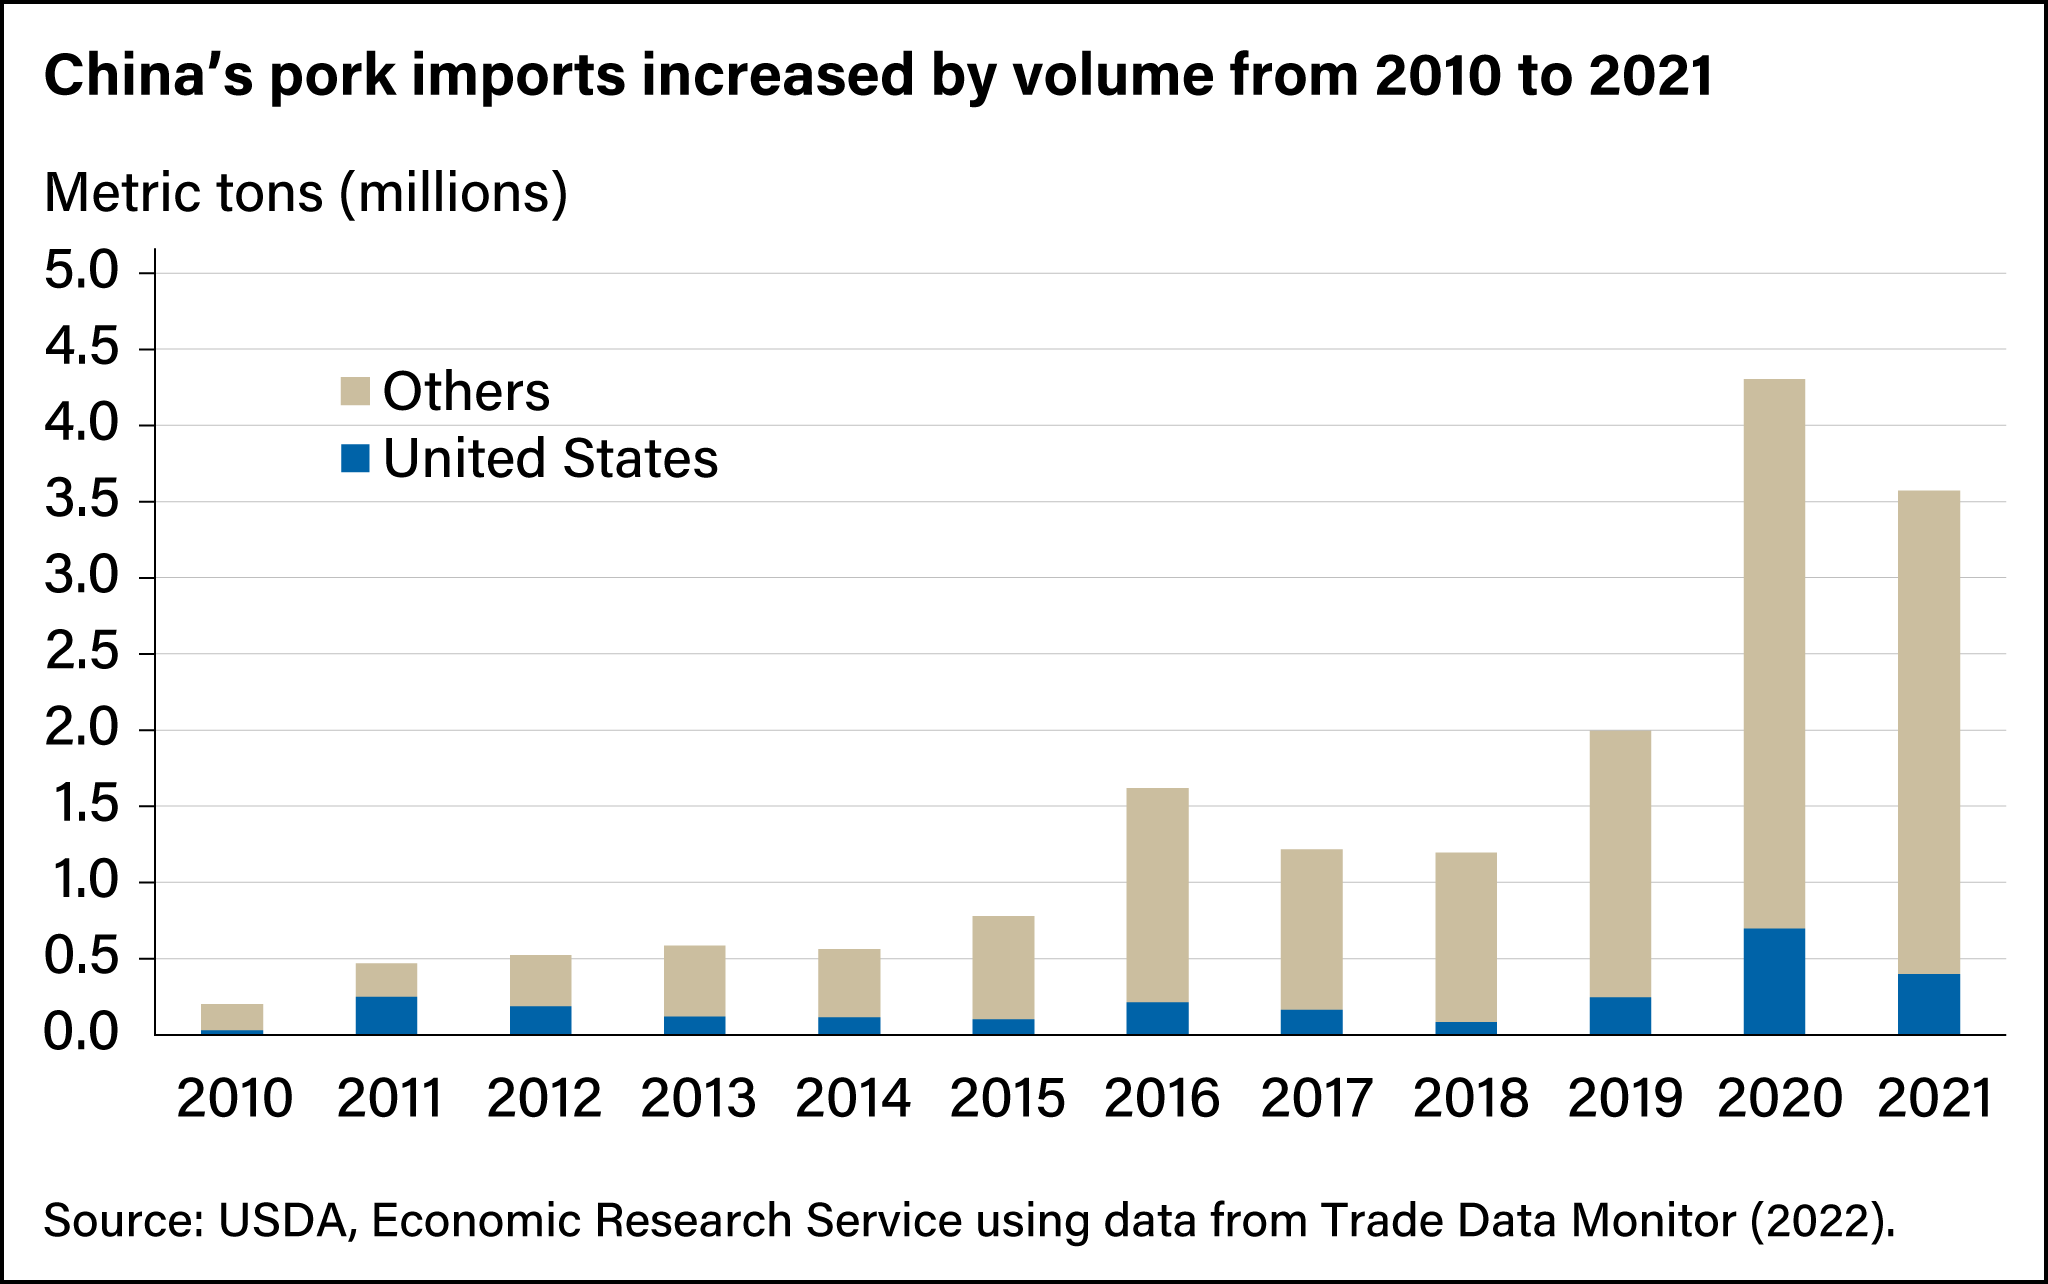
Pork: China Expected To Remain Largest Importer
China is both the world’s largest producer and consumer of pork, accounting for about half the world total in both categories. Historically, China’s pork was produced by small, backyard operations, but China now is home to some of the largest swine-producing operations in the world. However, rising costs, low productivity in the swine industry, and the African swine fever epidemic in China during 2018–19 have limited the domestic pork meat supply. As a result, China became a leading importer of pork for all but 1 year from 2016 to 2021 despite being the largest producer of pork. As shown in the chart below, China’s pork imports rose from 200,000 metric tons to 4.3 million metric tons between 2010 and 2020.
The U.S. share of China’s pork imports, however, has been limited by factors such as China’s zero-tolerance policy for the use of ractopamine—a feed additive that promotes lean muscle growth—and the risk of bans in response to disease outbreaks. A commitment in the Phase One agreement for China to set science-based limits on use of ractopamine has yet to be carried out. In addition, U.S. pork was subject to Sections 232 and 301 retaliatory tariffs, which China initiated in 2018 in response to U.S. tariffs on Chinese steel and aluminum as well as other products. Chinese authorities granted some importers exclusions from Section 301 tariffs in 2020 after the Phase One agreement was signed, but the Section 232 tariffs were still assessed on U.S. pork.
Meanwhile, China cut tariffs to 8 percent, from 12 percent, on all frozen pork in 2020 to fill a supply deficit caused by the African swine fever epidemic that year. The tariffs were restored to 12 percent in 2022 when domestic supplies recovered. Global pork exporters also face challenges in gaining certification from Chinese authorities, complying with documentation and labeling requirements, as well as testing for Coronavirus (COVID-19) and disinfection.
Going forward, China is expected to remain the world’s largest pork importer. Pork consumption per capita in China is growing at a slower pace than that of other meats, but pork remains the predominant meat in that country. China’s domestic industry faces rising production costs and tougher regulations intended to address widespread environmental and disease problems. Chinese consumers are becoming more receptive to chilled and frozen pork, and improvements have been made in cold chain infrastructure, both of which favor growth in China’s pork imports.
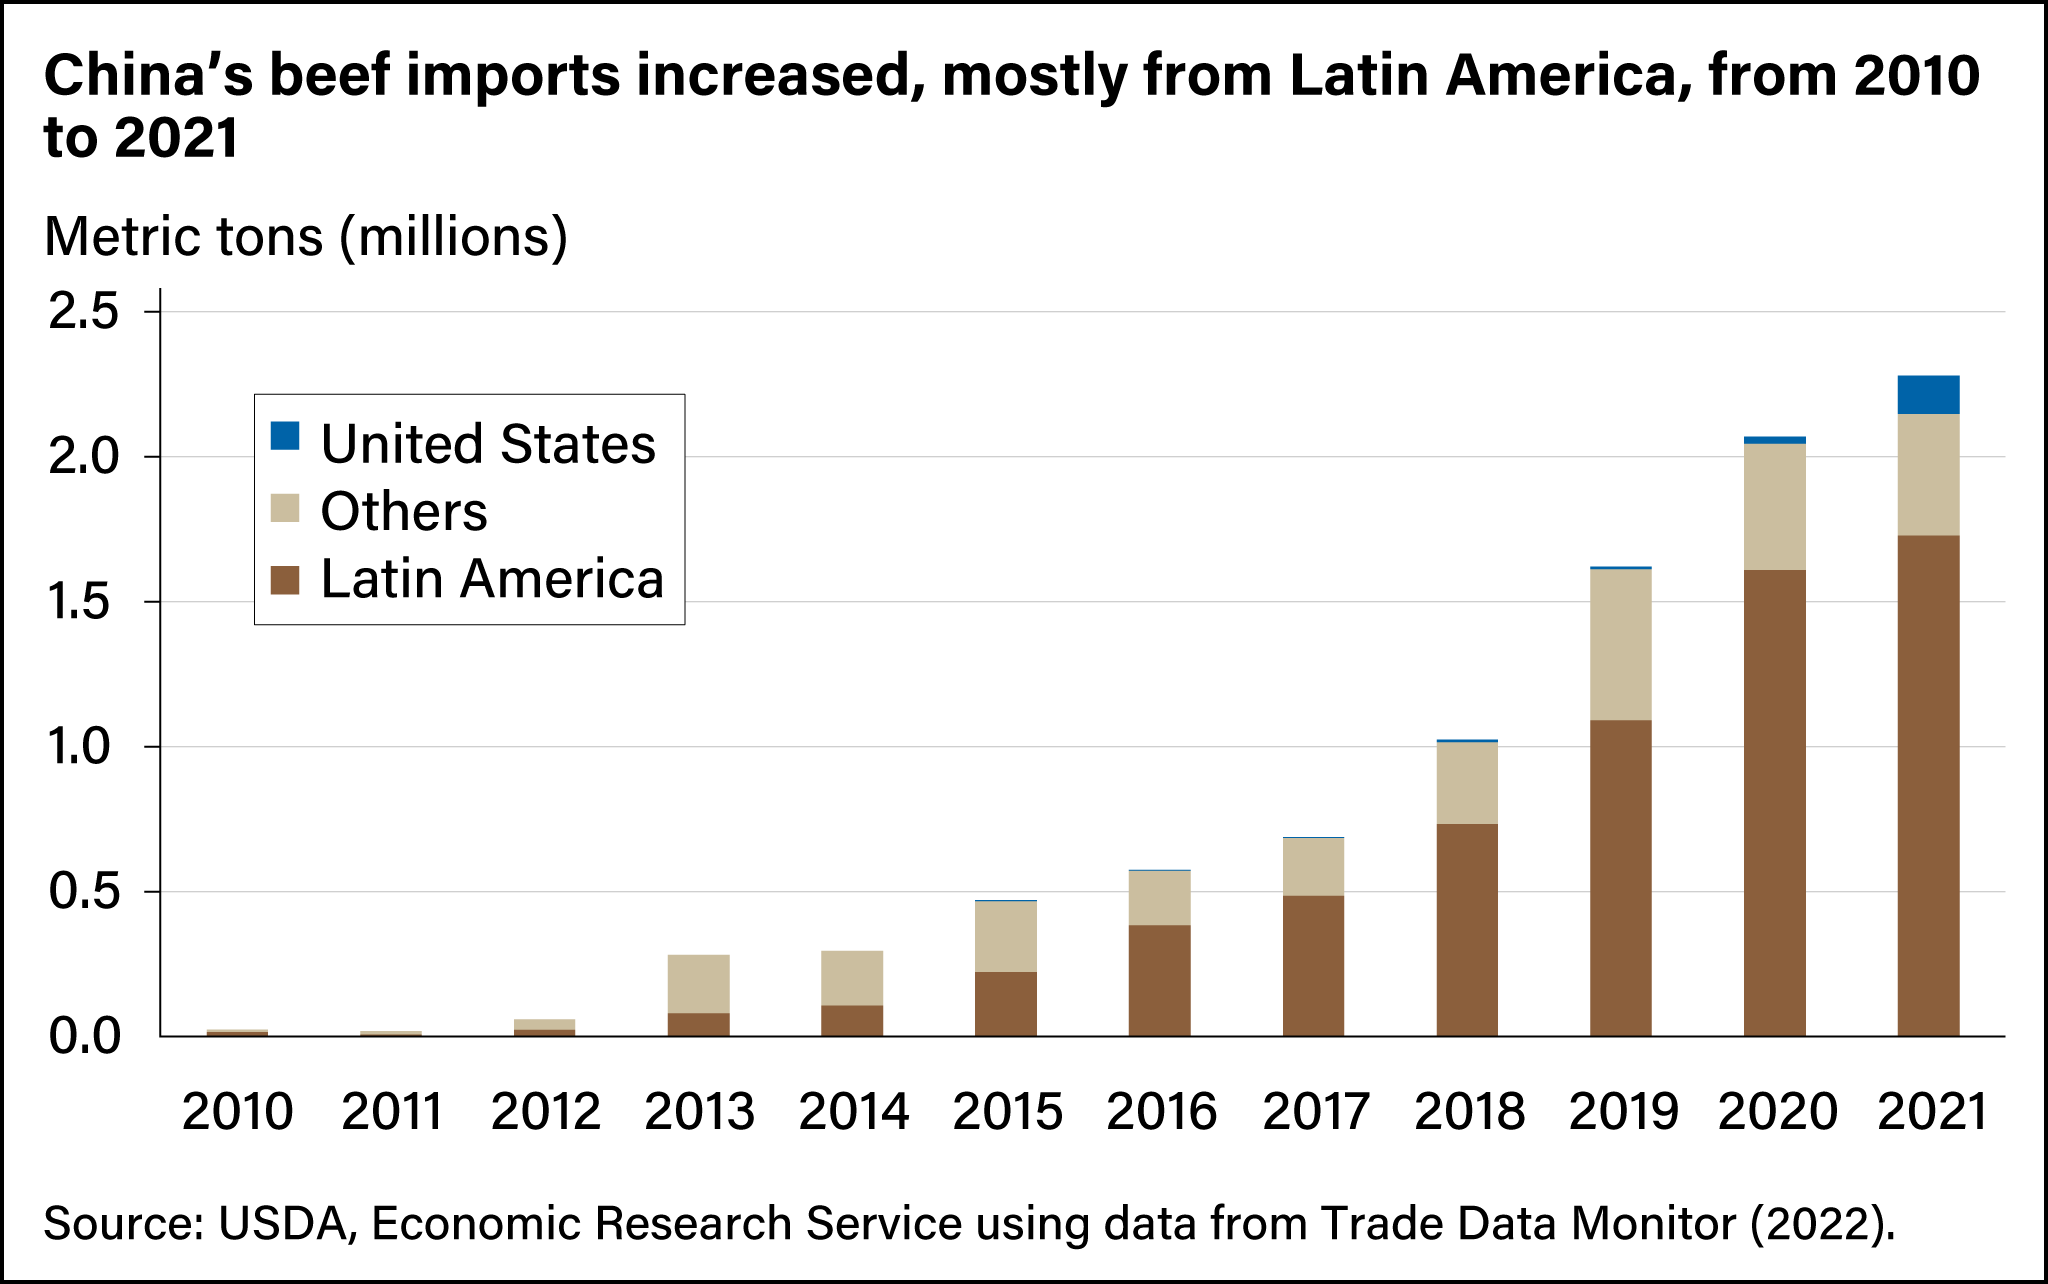
Beef: Lingering Trade Barriers Loom as China’s Demand Soars
China’s beef consumption is booming as consumers add other meats to the traditionally pork-heavy menu. With a lack of grazing land and chronic disease problems, China’s beef production has not kept pace with consumption, creating opportunities for exporters around the world. USDA’s Long-Term Baseline projections show China’s beef consumption will reach 11.4 million metric tons by 2031 while its production will reach only 7.4 million metric tons.
Total beef imports to China have increased from about 20,000 metric tons in 2010 to more than 2 million metric tons in 2020 despite stringent requirements for approving new meat-exporting establishments. China requires extensive documentation for shipments, and labeling regulations add to the cost of exporting to that country. Nevertheless, China’s growth in beef imports has soared, with most of the increase coming from Latin America. Meanwhile, U.S. imports have been hindered. In 2017, China lifted a 14-year ban on U.S. beef stemming from the discovery of bovine spongiform encephalopathy (BSE), but imports were slow to recover as few U.S. facilities were eligible to export to China. The Phase One agreement reduced trade barriers, and as a result, U.S. share of China’s beef imports rose above 1 percent in 2020 for the first time in recent years, before increasing to 6 percent in 2021.
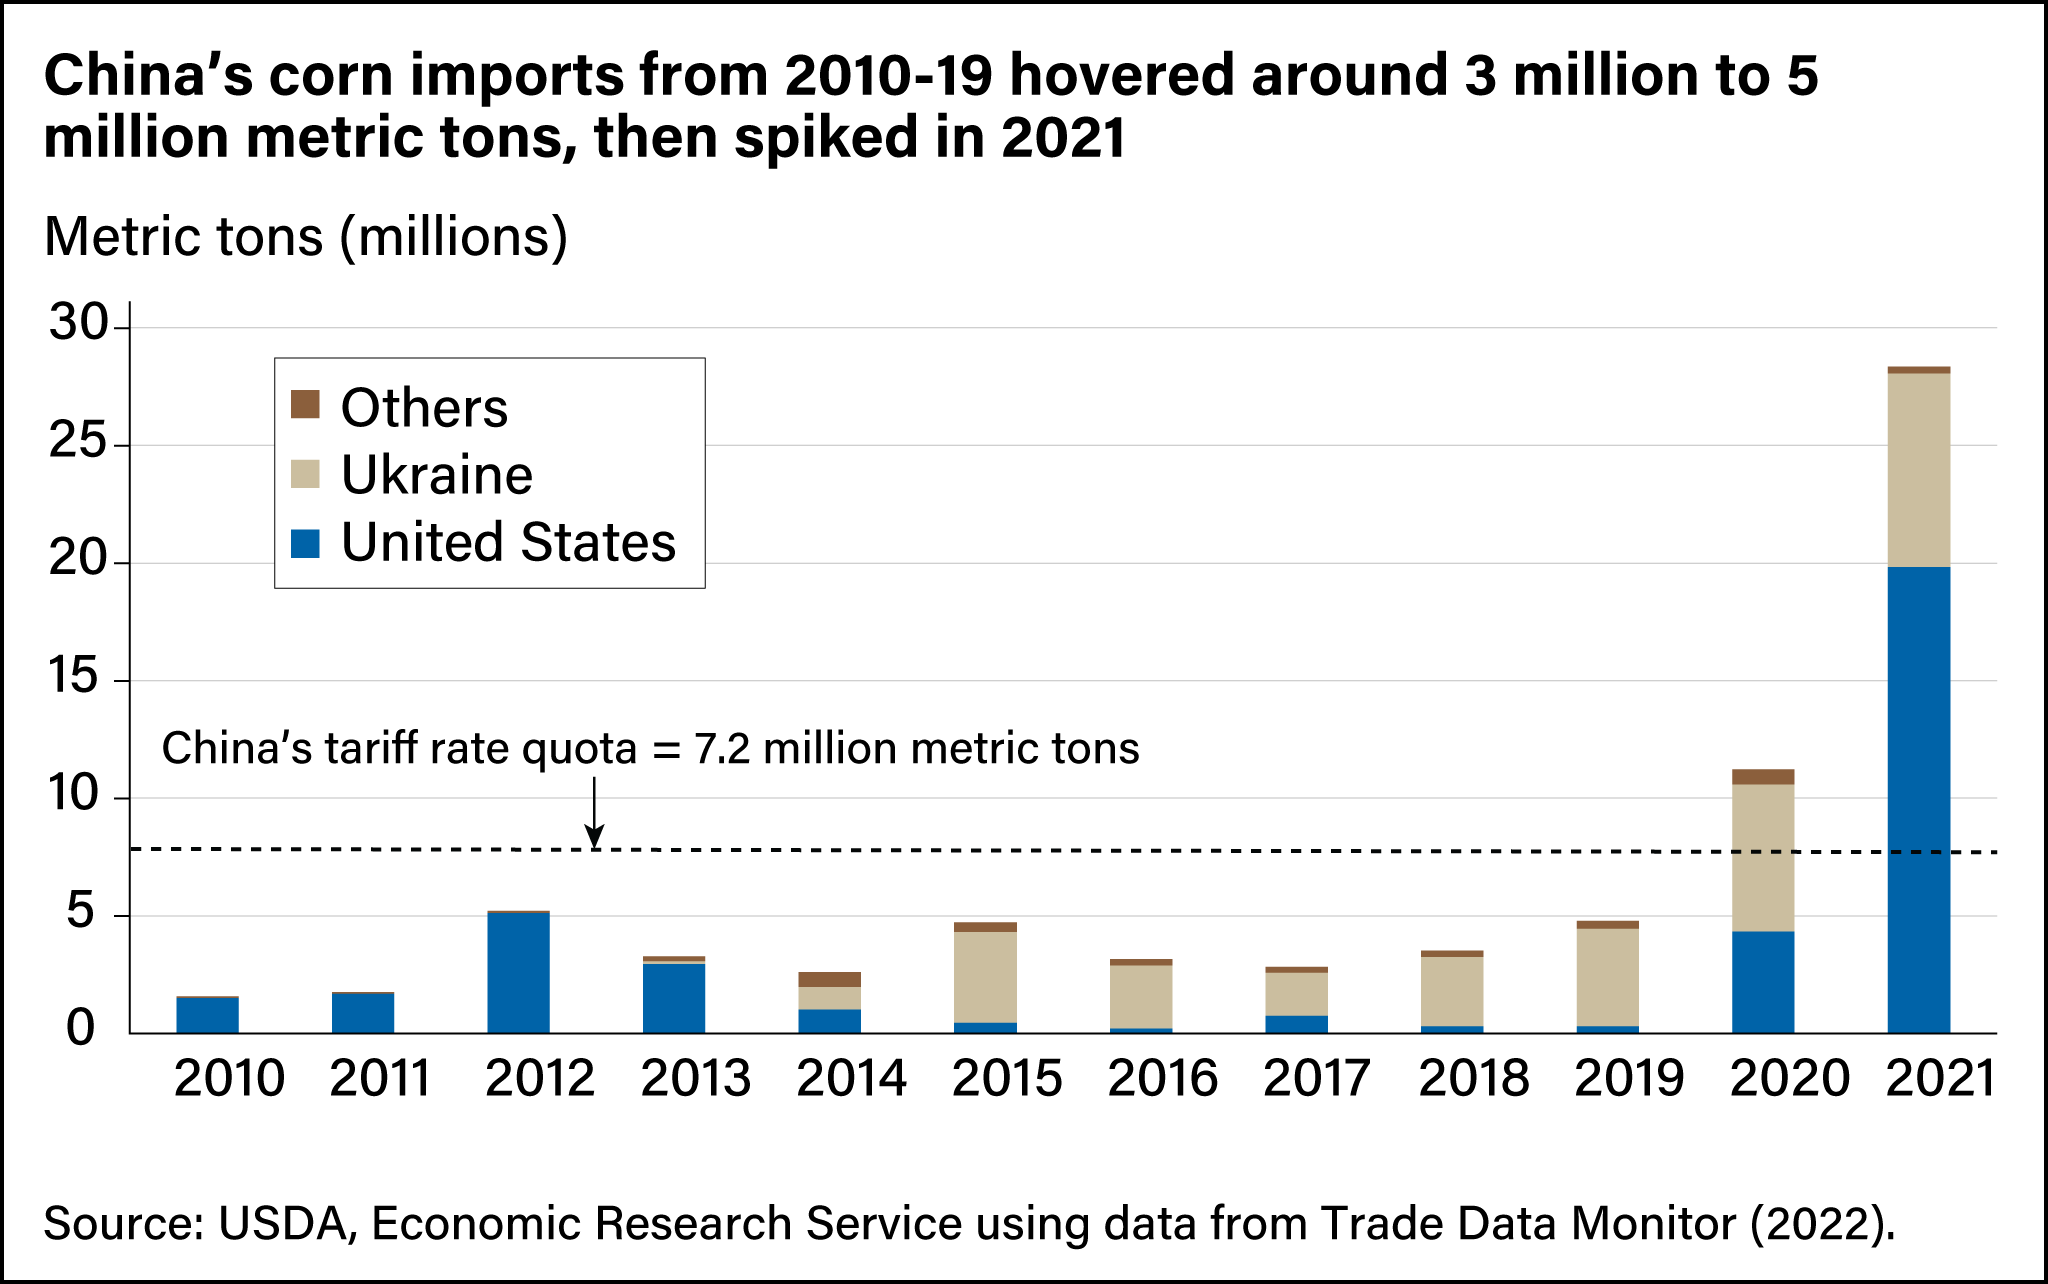
Corn: Growing Demand Drives Surge in China’s Imports Despite Trade Policies
Since the 1990s, economists have projected that China’s demand for corn to feed livestock—particularly swine—would outpace its supply. China imported 3 million to 5 million metric tons of corn a year from 2010 to 2019. Then, in 2020, China’s total imports of corn more than doubled to 11.2 million metric tons, making China the world’s fourth-largest importer of corn behind the European Union, Japan, and Mexico. China’s corn imports increased further to 28 million metric tons in 2021 (see chart below). Factors driving this growth included reduced corn supplies in China, the rebuilding of China’s pig herd after an African swine fever epidemic, and China’s purchase commitments in the Phase One agreement. The share of China’s corn imports from the United States rose from 7 percent to 70 percent in the 2 years from 2019 to 2021.
China’s corn price wedge reflects the country’s evolving domestic and trade policies. A price support policy held Chinese corn prices at a level that exceeded global prices by a wide margin until the policy ended in 2016. China’s tariff rate quota (TRQ) allowed up to 7.2 million metric tons of imports annually at a low tariff of 1 percent, but imports never reached the quota before 2020 despite the apparent profitability of imports. Sixty percent of the quota was reserved for import by state-owned enterprises, which may have restrained imports.
Delays on approval of new genetically modified seeds constrained the release of new varieties in the United States, and during 2014, Chinese customs authorities rejected nearly all shipments of U.S. corn, claiming to have found traces of an unapproved variety. The corn price wedge narrowed in 2016 after China suspended its corn price support policy, allowing China’s corn price to fall about 30 percent. Then, from 2017 to 2020, authorities released more than 200 million tons of corn that had been bought as part of the price support program and gave subsidies to Chinese companies that processed the corn.
In 2020, China’s corn imports surged to a record level after the Phase One agreement and reports of diminished Chinese stockpiles that prompted a surge in Chinese corn prices that year. Imports exceeded the tariff rate quota for the first time in 2020, by over 4 million metric tons. The next year, in 2021, imports exceeded the quota by nearly fourfold. It was unclear how imports reached this level as imports outside the quota are assessed a 65-percent tariff that would likely make such imports unprofitable.
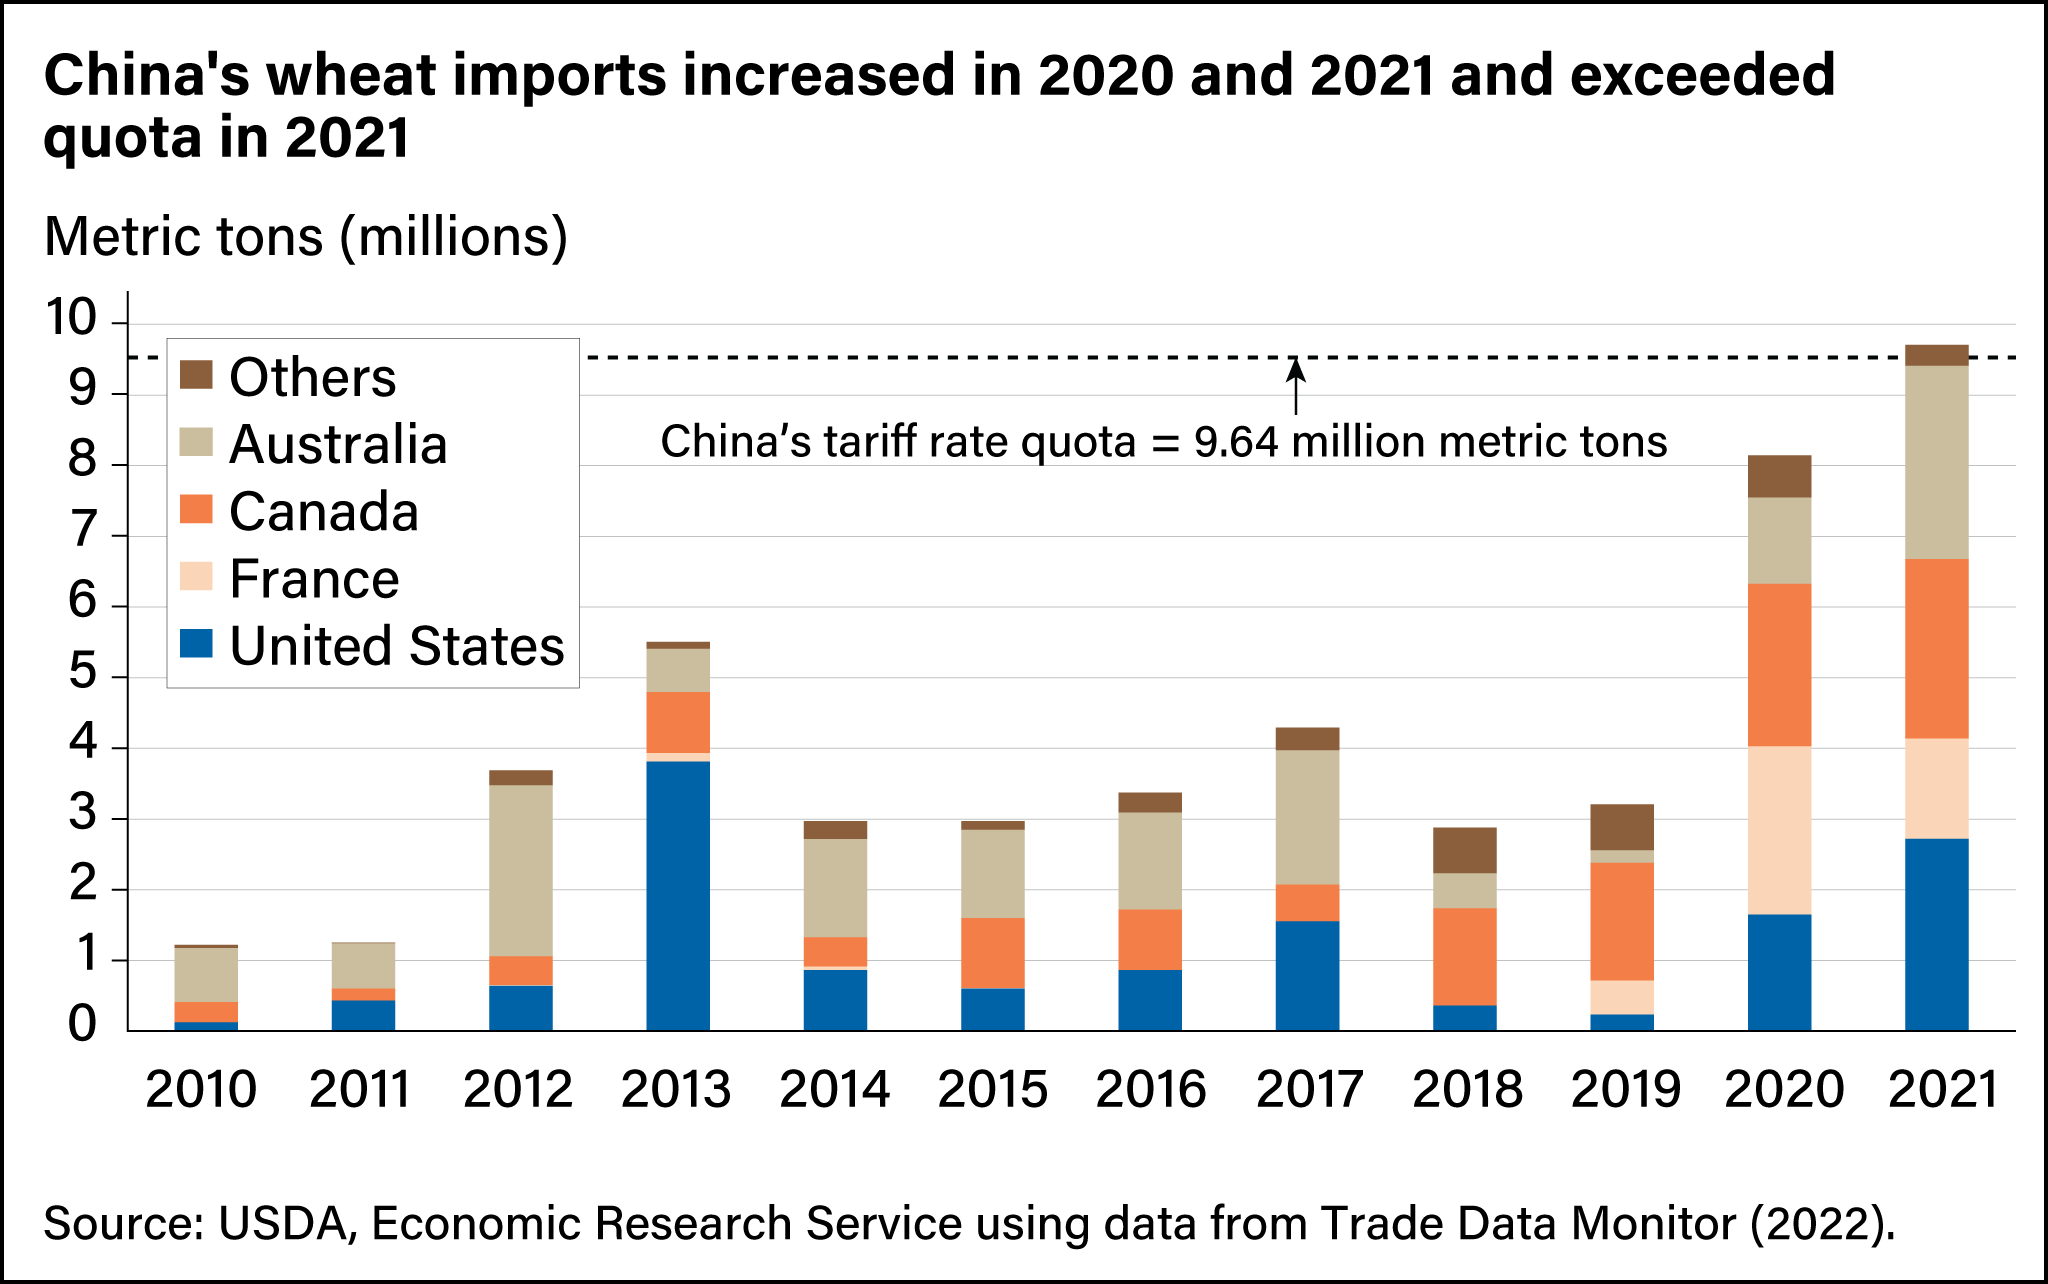
Wheat: China’s Producers Protected From Competition Through Tariffs, High Domestic Prices
China has been the world’s largest consumer of wheat since 2016 and has been the first- or second-largest wheat producer in the world since its accession to the World Trade Organization in 2001. As with corn, China has protected its domestic wheat producers from international competition with a TRQ that applies a 1-percent tariff to the first 9.64 million metric tons of wheat imported into China and a 65-percent tariff to any imports beyond the quota. Also, 90 percent of the wheat import quota is reserved for one state-trading enterprise, leaving 10 percent for other importers. China’s wheat TRQ had not been filled until 2021, when imports reached 9.7 million metric tons. With those policies in place, the price of imported wheat typically has been considerably lower than the domestic price. The volume of wheat imports is influenced by Chinese authorities’ accumulation and release of reserve stockpiles.
In the short run, removal of nontariff barriers is expected to increase China’s imports by 13 to 117 percent across the four commodities. In the medium and long run, estimates suggest increases from 46 to 402 percent.
For example, ERS estimates that after 5 to 10 years (a medium to long run scenario), China’s wheat imports will increase by 249 percent. In that scenario, producers would have enough time to shift their resources from the less profitable wheat sector to more profitable uses, and a greater proportion of the demand for wheat would be filled by imports instead of production. Looking at just the first year after the wedges were removed, however, wheat imports were estimated to increase by a more modest 48 percent. Producers would not be able to respond to changes in prices as quickly and domestic production presumably still would primarily fill demand. Researchers project that removing these nontariff barriers eventually would increase sales for wheat producers in the United States and other exporting countries while lowering food prices for China’s consumers.
This article is drawn from:
- Beckman, J., Gale, F., Morgan, S., Sabala, E., Ufer, D.J., Valcu-Lisman, A., Zeng, W. & Arita, S. (2022). China's Import Potential for Beef, Corn, Pork, and Wheat. U.S. Department of Agriculture, Economic Research Service. ERR-310.
You may also like:
- Morgan, S., Arita, S., Beckman, J., Ahsan, S., Russell, D., Jarrell, P. & Kenner, B. (2022). The Economic Impacts of Retaliatory Tariffs on U.S. Agriculture. U.S. Department of Agriculture, Economic Research Service. ERR-304.
- Gale, F. (2021). Potential Wheat Demand in China: Applicants for Import Quota. U.S. Department of Agriculture, Economic Research Service. ERR-295.
- Beckman, J. (2021). Reforming Market Access in Agricultural Trade: Tariff Removal and the Trade Facilitation Agreement. U.S. Department of Agriculture, Economic Research Service. ERR-280.
- Gale, F. (2021). China's Refusals of Food Imports. U.S. Department of Agriculture, Economic Research Service. ERR-286.
- Beckman, J., Gale, F. & Lee, T. (2021). Agricultural Market Access Under Tariff-Rate Quotas. U.S. Department of Agriculture, Economic Research Service. ERR-279.