

Examining Financial Risk Measures on Family and Nonfamily Farms
- by Christine Whitt, Noah Miller and Ryan Olver
- 6/22/2023
The Agricultural Resource Management Survey (ARMS) provides data on two measures of financial performance: the operating profit margin (the share of gross income that is profit) and the current ratio (the ratio of short-term assets to short-term debt). Researchers use these data to gain a sense of risk faced by different types of farms.
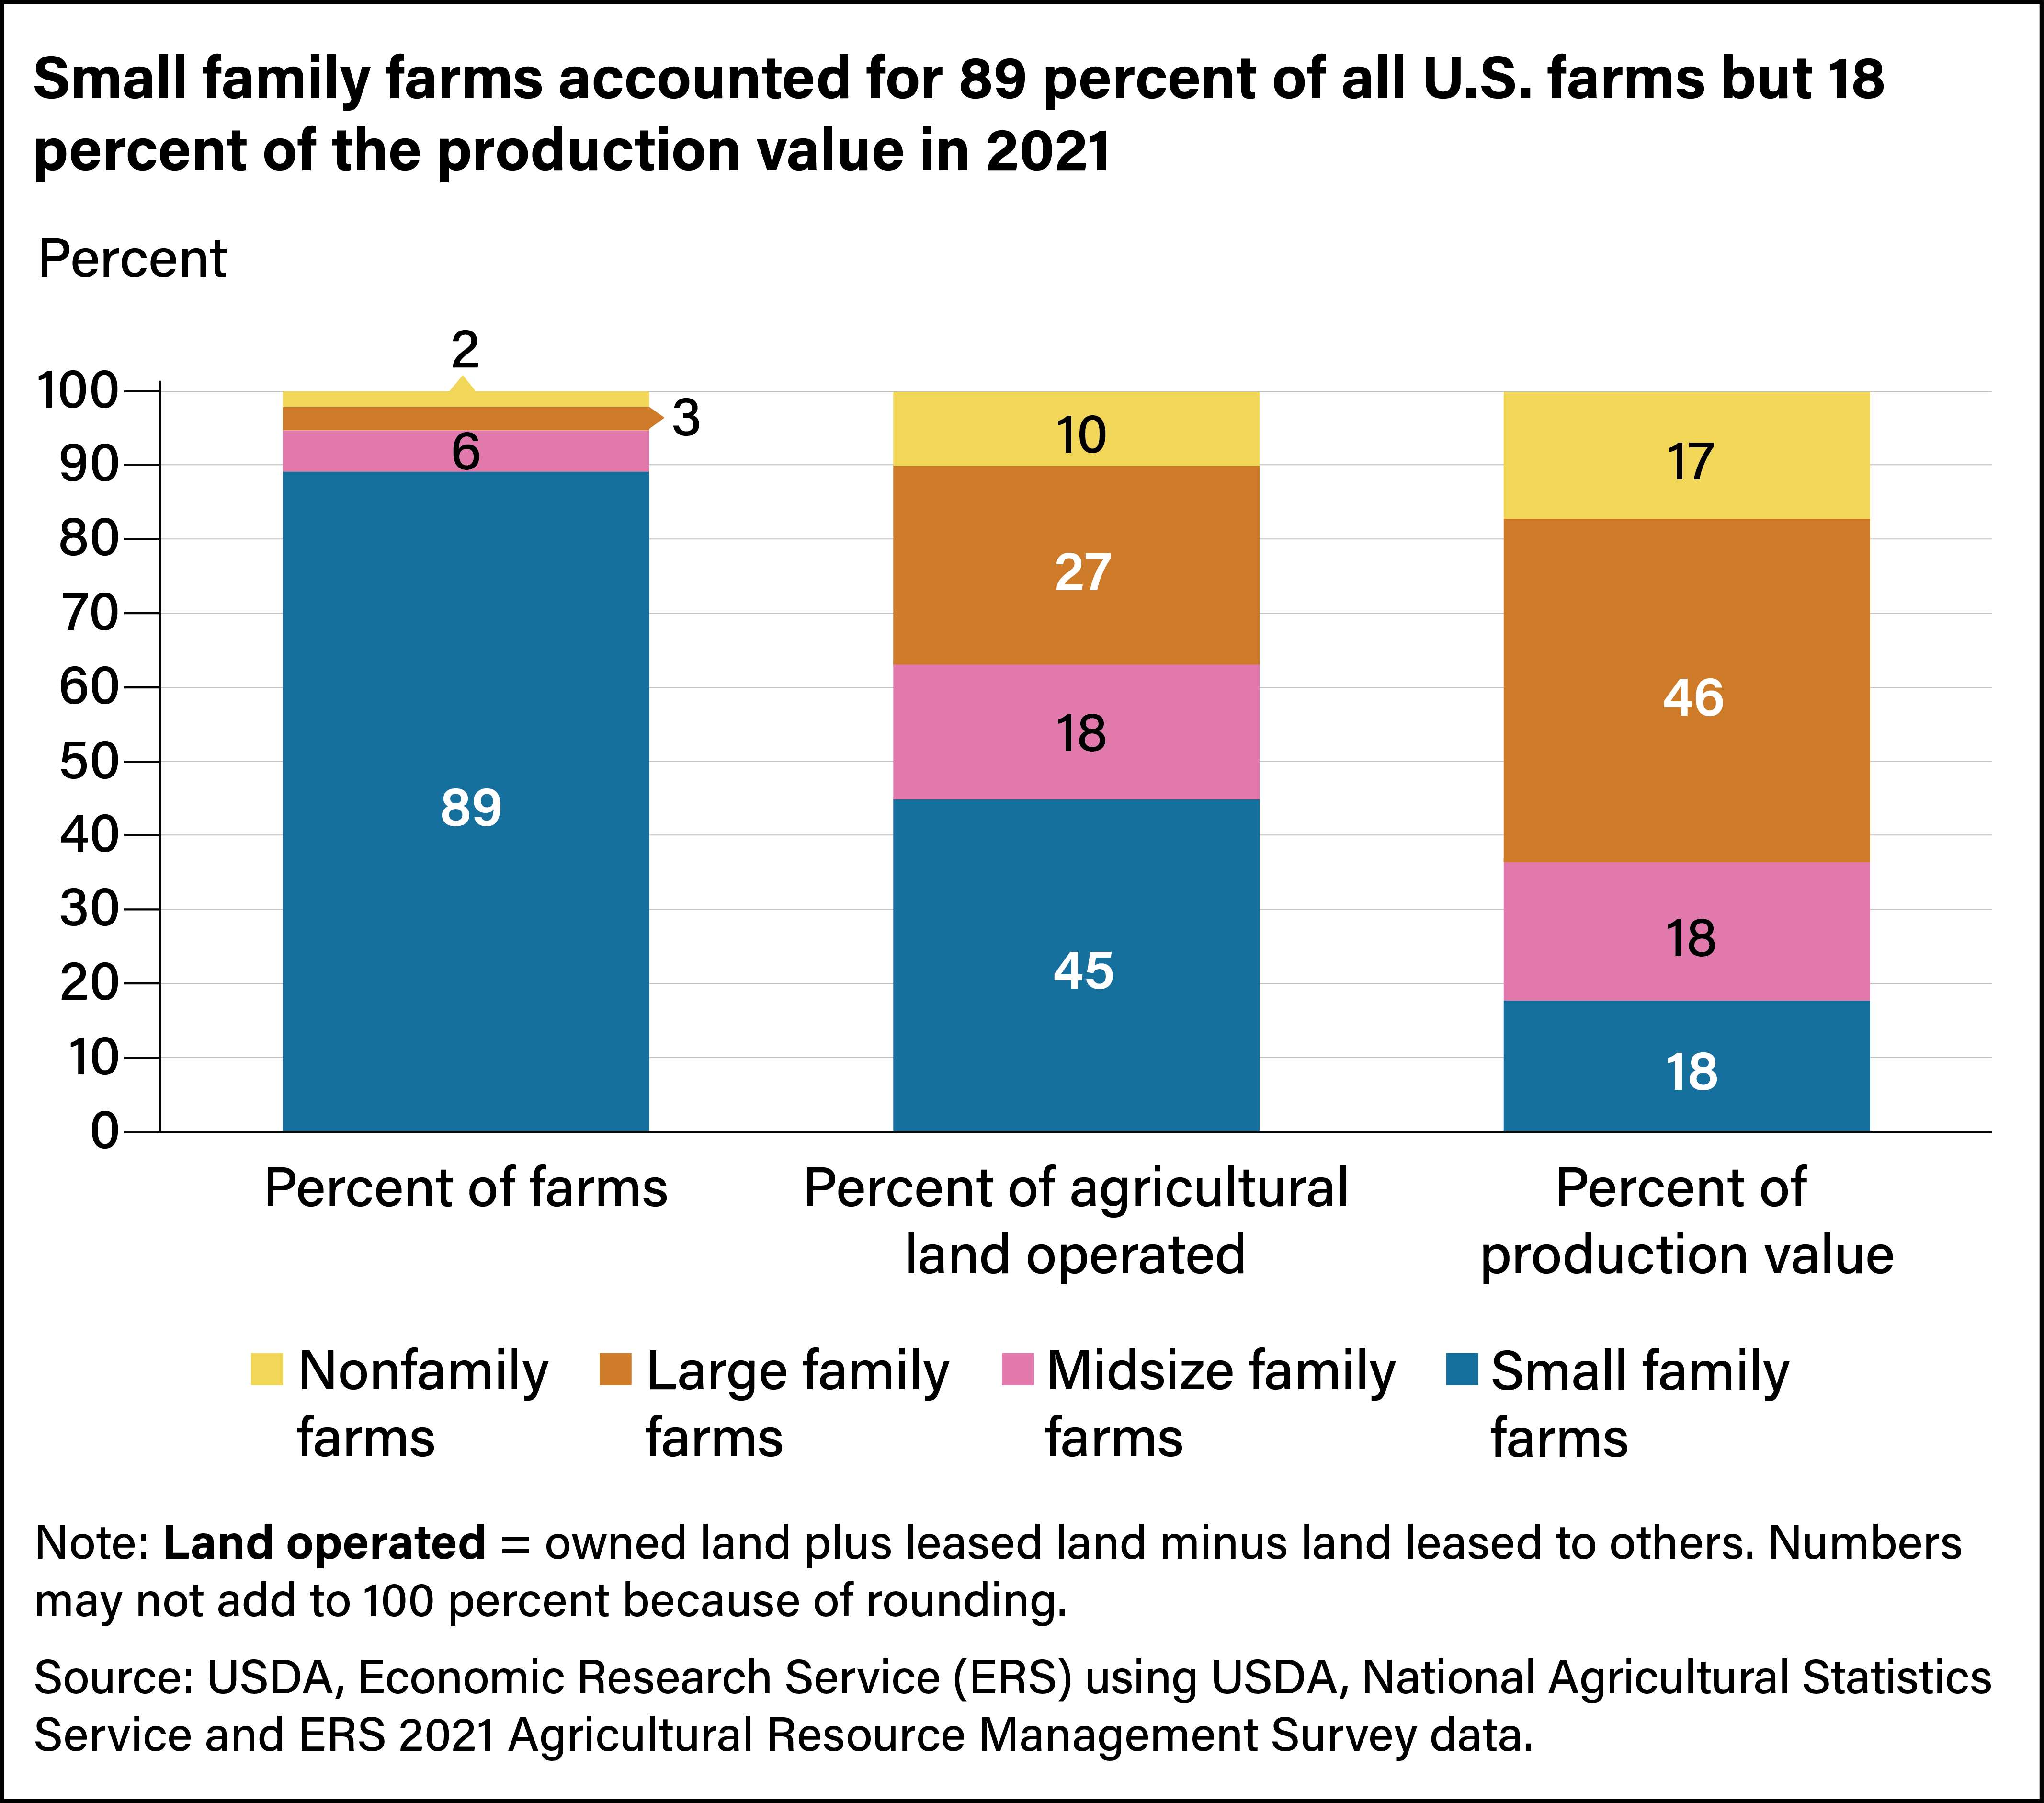
USDA, Economic Research Service classifies farms according to their ownership type (family or nonfamily) and their size (small, midsize, or large) as measured by gross cash farm income (GCFI). A family farm is any farm in which an operator and their relatives own more than half the business’ assets. In 2021, 98 percent of the 2 million U.S. farms were family owned and operated. Additionally, 89 percent were classified as small farms, meaning their GCFI was less than $350,000. Small family farms operated 45 percent of U.S. farmland but accounted for only 18 percent of production by value. Large family farms operated 27 percent of U.S. farmland and accounted for 46 percent of production value. Large farms are those with GCFI of $1 million or greater, and those with GCFI above $5 million are categorized as very large farms. Midsize farms, with GCFI between $350,000 and $999,999, operated 18 percent of farm acreage and accounted for 18 percent of production value.
Nonfamily farms include (but are not limited to) those operated by partnerships of unrelated partners, nonfamily corporations, and farms with a hired manager unrelated to the owners. The share of nonfamily farms remained at 2 percent between 2020 and 2021, although their share of production value increased from 13 to 17 percent. Twenty-one percent were also classified as “large,” and those accounted for 93 percent of the total value of production for nonfamily farms.
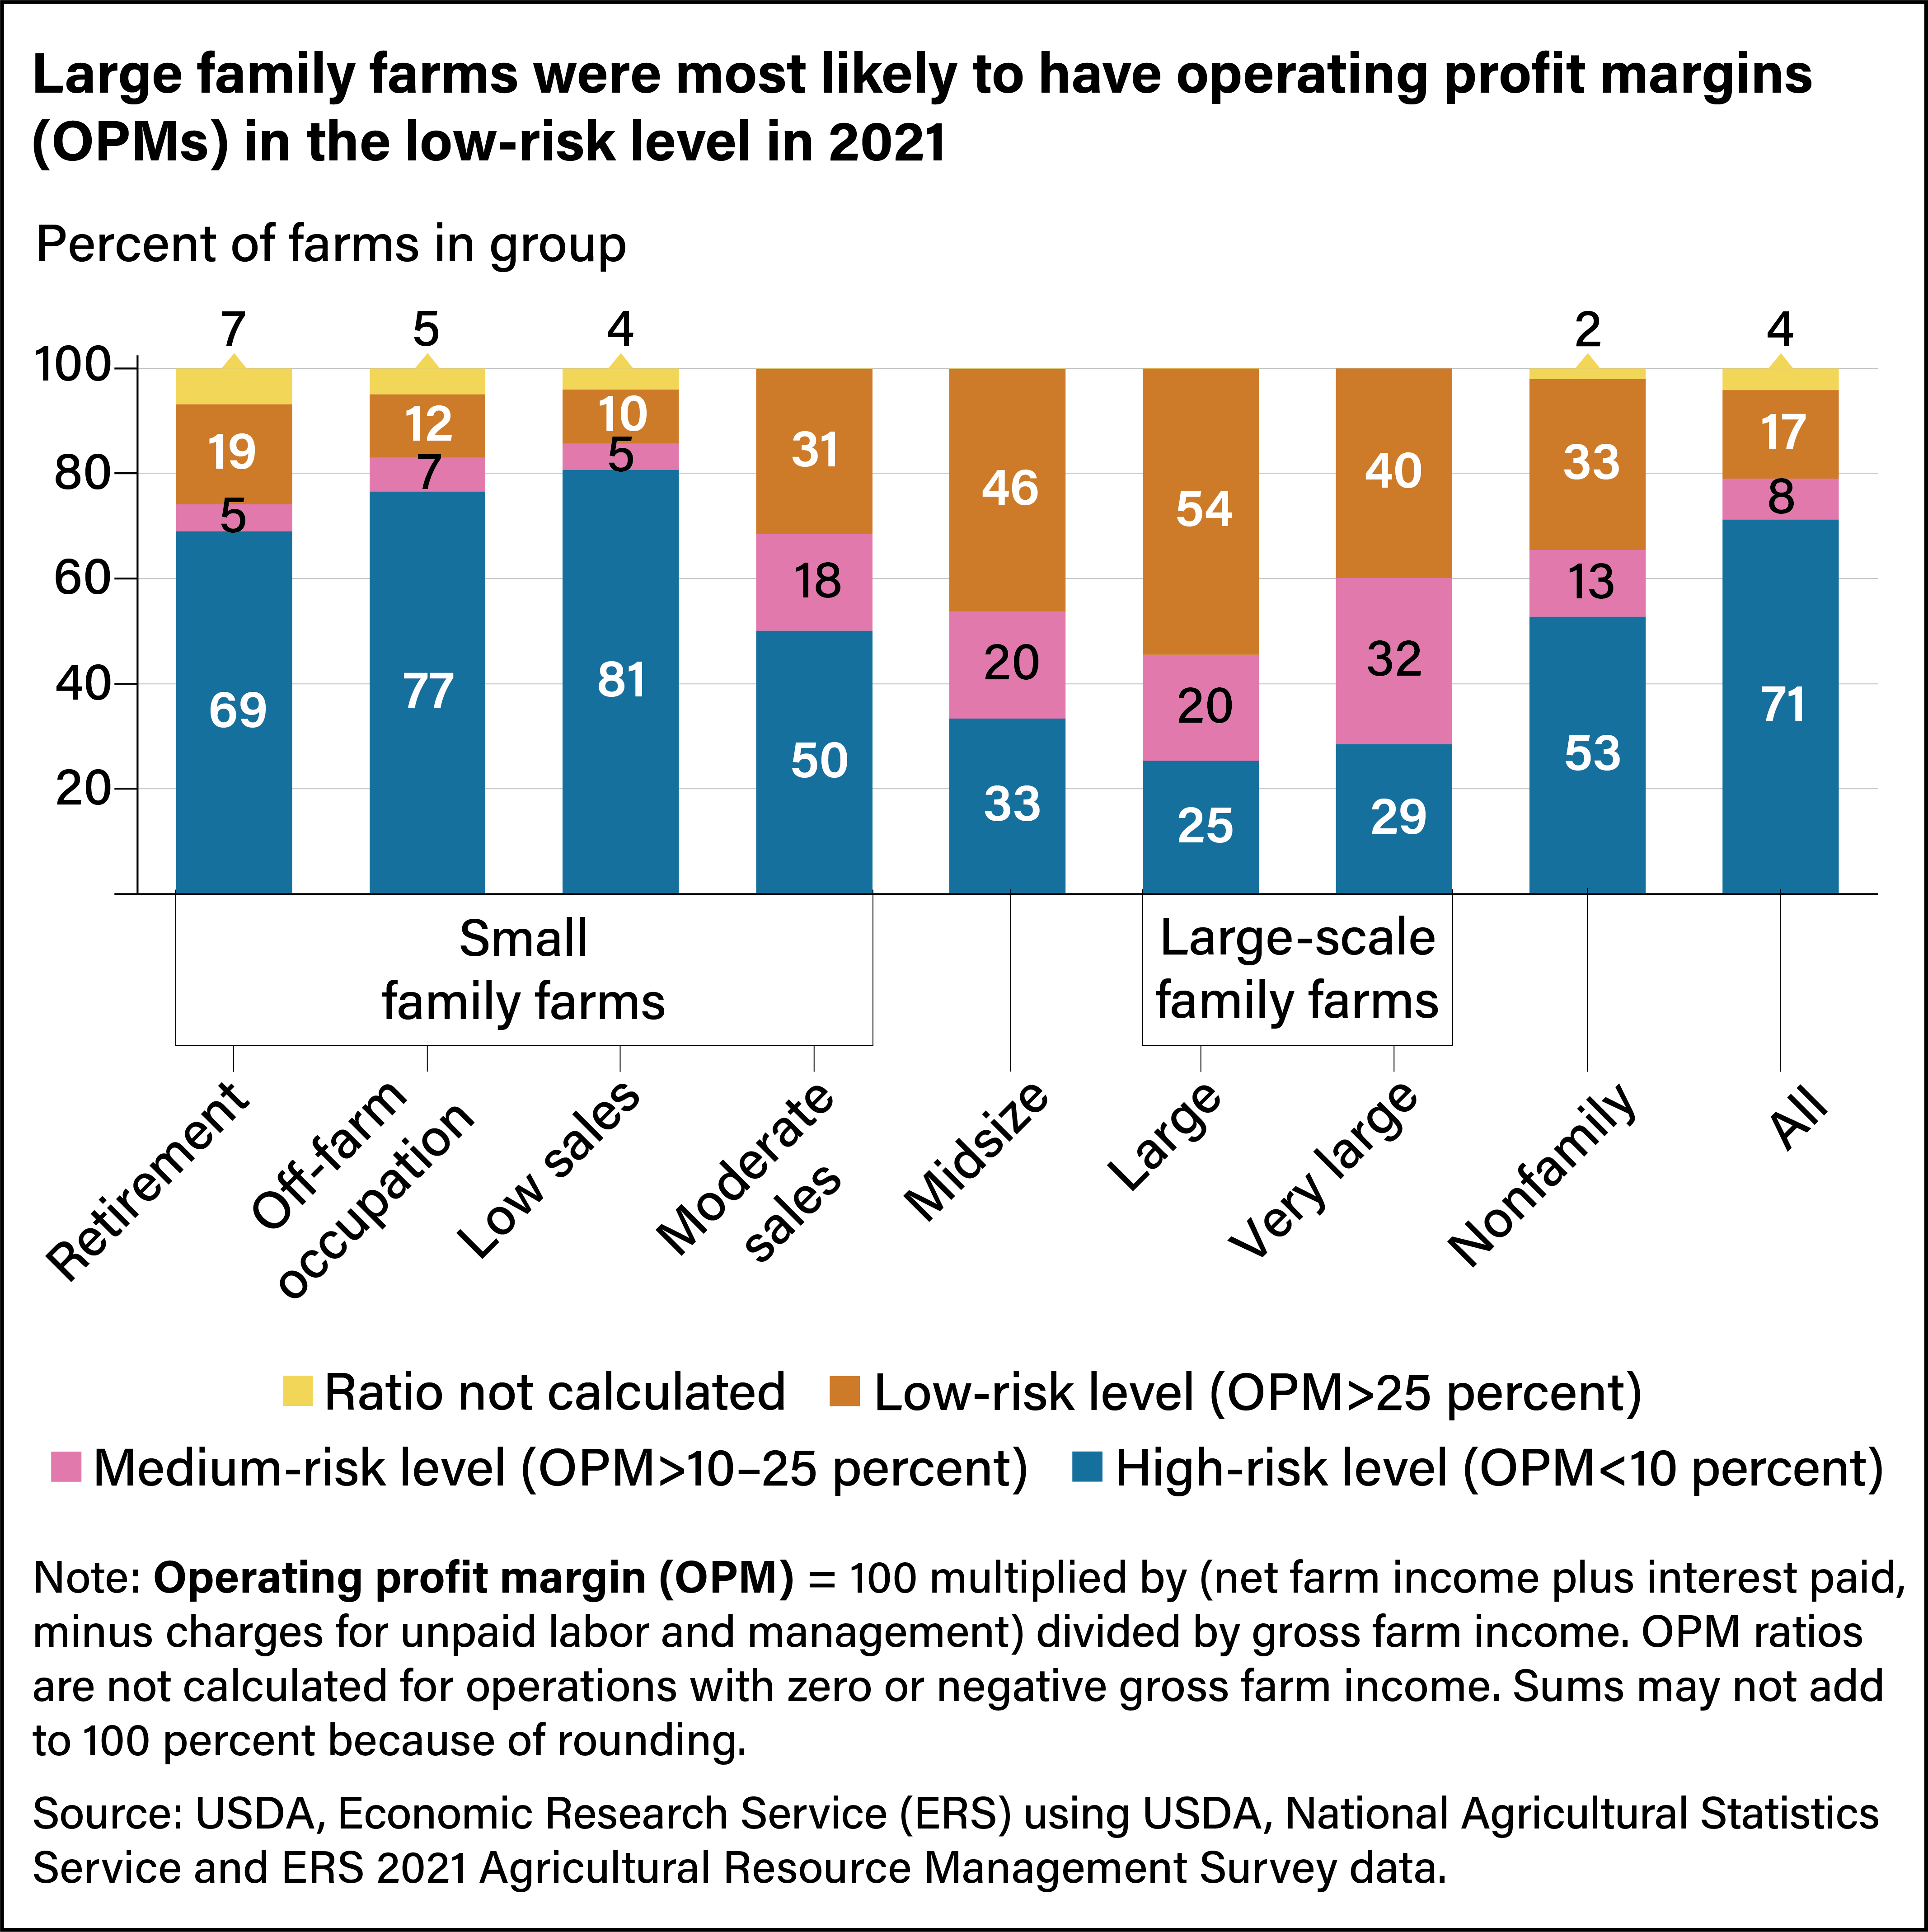
An operating profit margin under 10 percent indicates higher risk of financial problems, while margins above 25 percent are considered low risk, and margins between 10 and 25 percent are moderate risk. In 2021, most small family farms were classified as high risk, while midsize, large, and very large farms generally reported higher margins and lower risk. However, many farms categorized as small farms—including retirement farms, off-farm occupation farms, and low-sales farms (the categories of which are determined by the occupation of the principal operator)—also earn most of their income from off-farm sources, which is not reflected in operating profit margin. During the Coronavirus (COVID-19) pandemic, the proportion of low-risk farms increased from 2020 to 2021 (from 14 percent to 17 percent) across all categories except retirement farms.
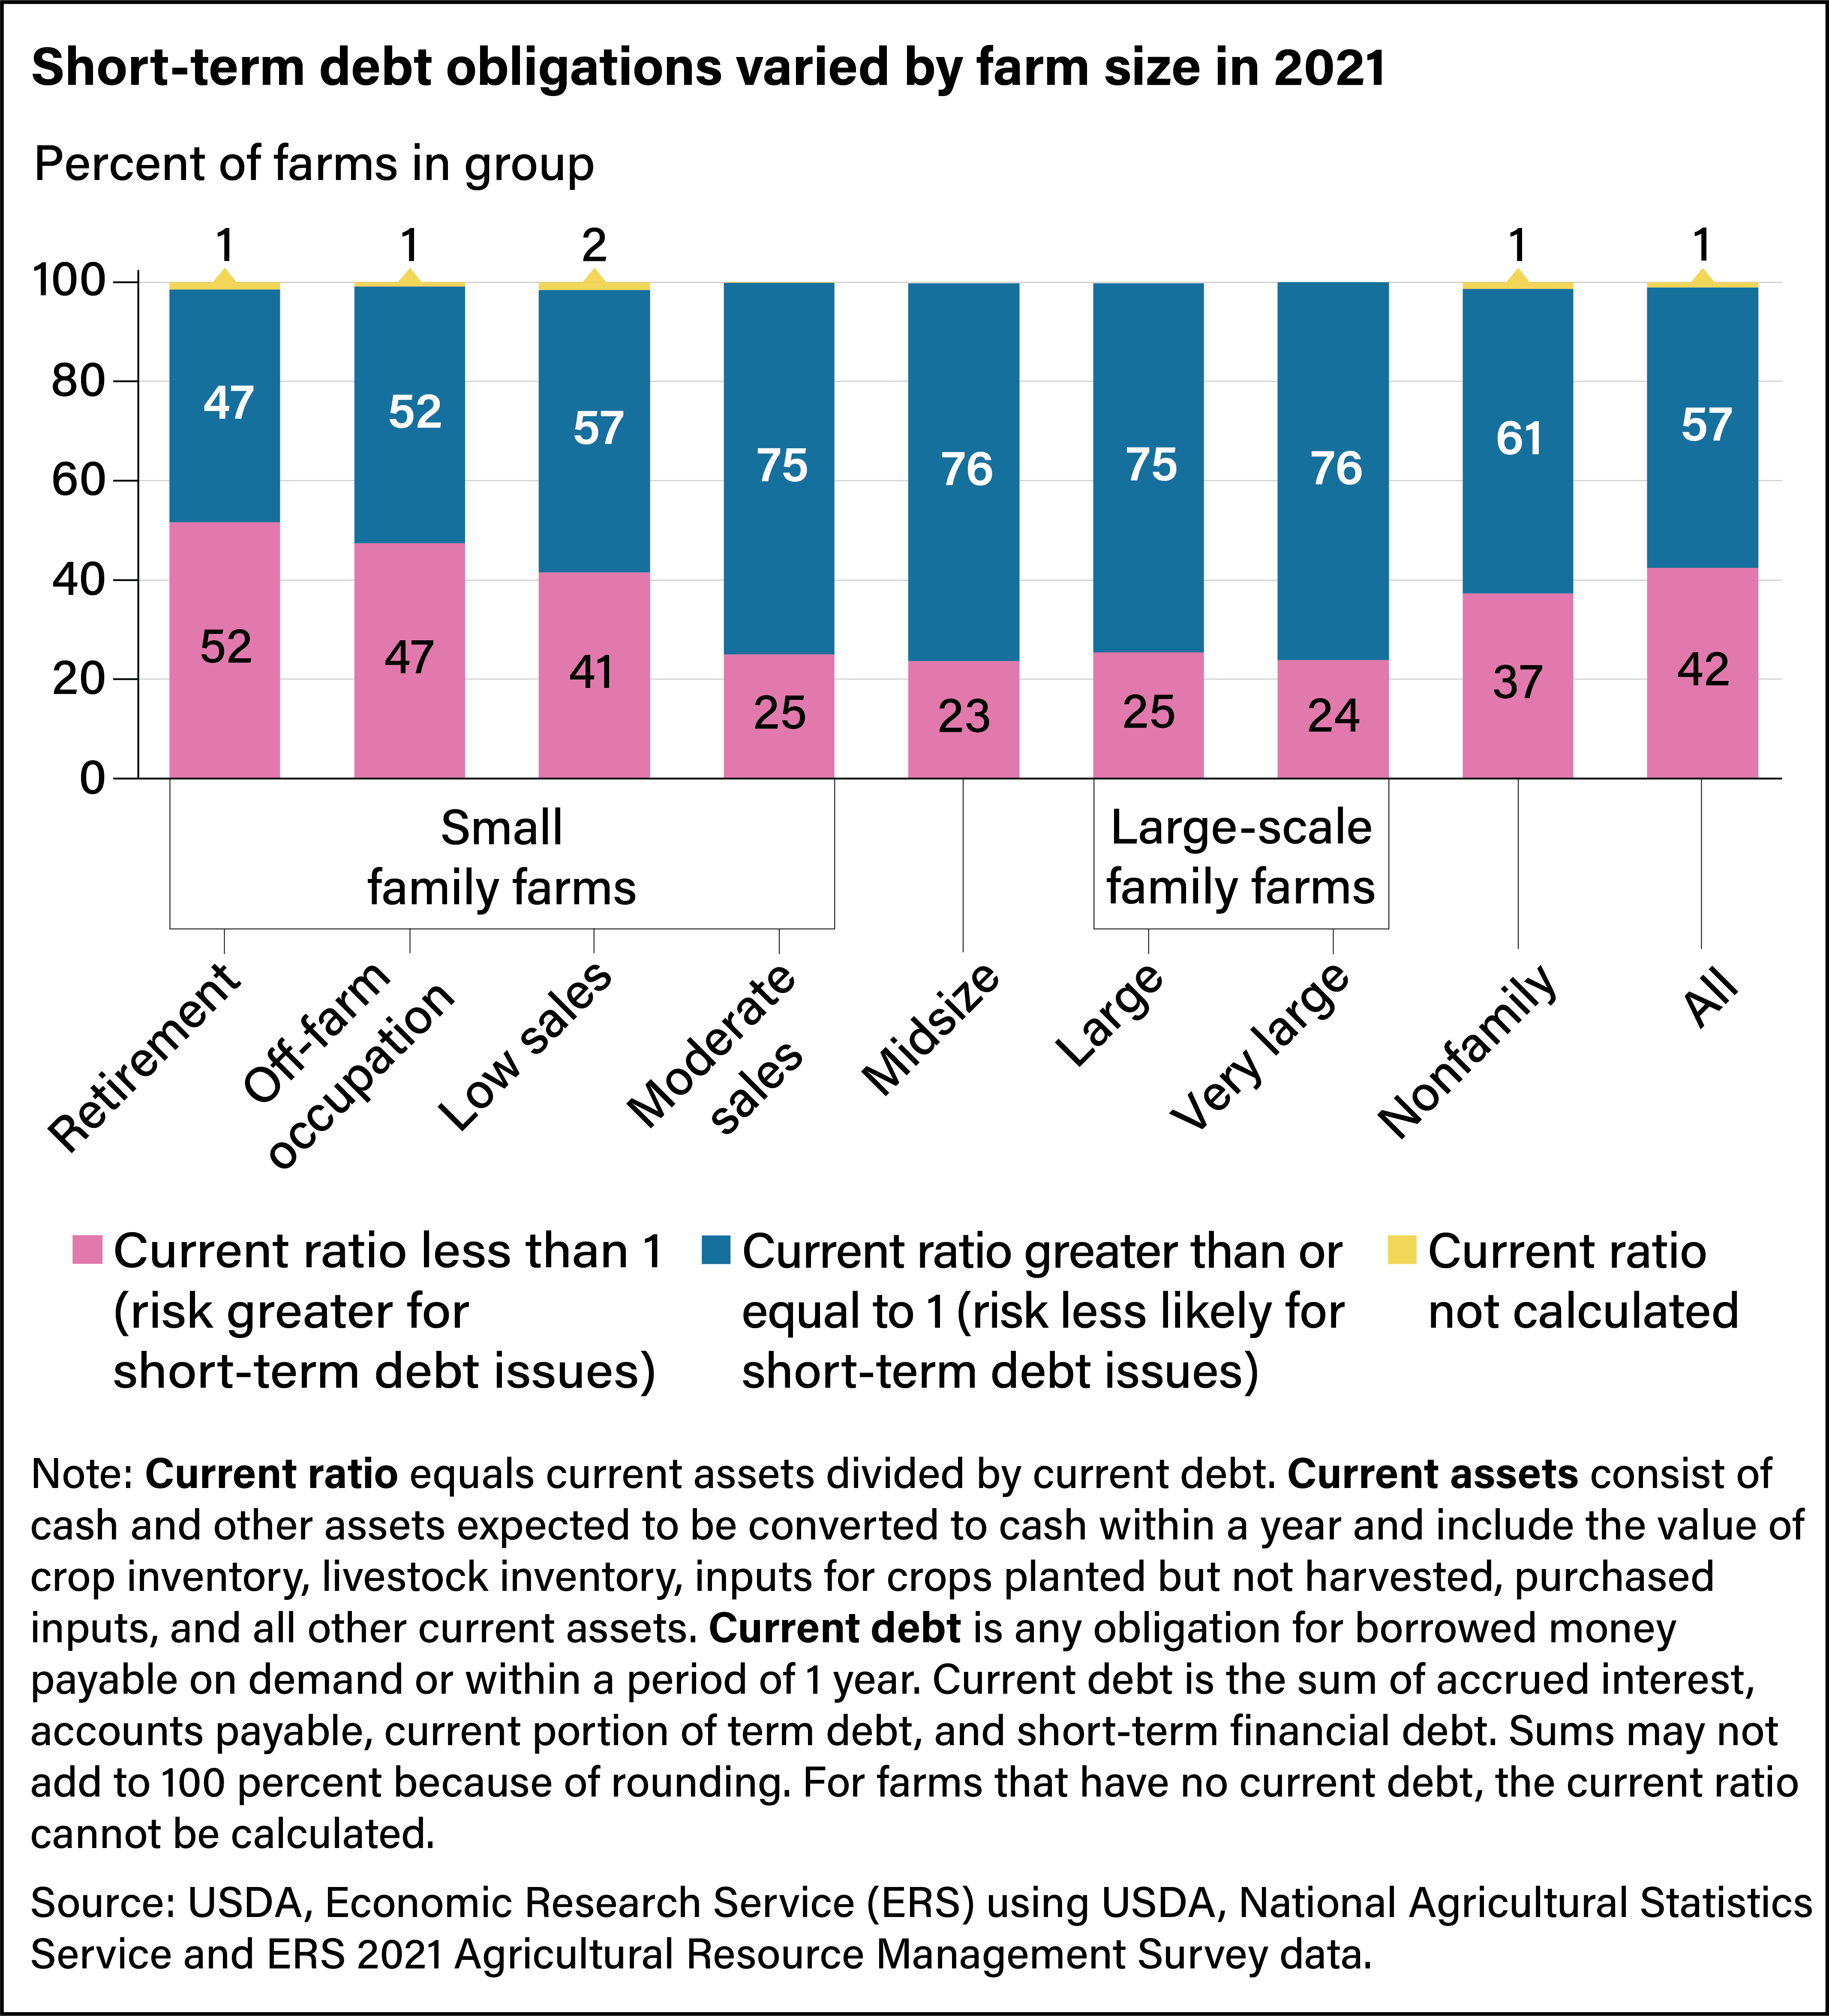
Another measure of financial performance is the current ratio, which indicates whether an operation has enough assets to convert into cash to meet debt obligations that need to be paid off within a year. A current ratio less than 1 suggests the farm is unable to fulfill its current debt by selling its current assets. Based on this measure, 57 percent of all farms do not have a short-term liquidity issue, even though 71 percent had an OPM in the high-risk zone. In 2021, about 25 percent of all farms categorized as “moderate sales” or larger had a current ratio less than 1, and about half of the retirement and off-farm occupation categories fell below this value. However, like the OPM measure, the current ratio does not account for off-farm household income, which many of these farms could use to fulfill short-term farm debt obligations.
This article is drawn from:
- Whitt, C., Miller, N. & Olver, R. (2022). America’s Farms and Ranches at a Glance: 2022 Edition. U.S. Department of Agriculture, Economic Research Service. EIB-247.
You may also like:
- Risk Management. (n.d.). U.S. Department of Agriculture, Economic Research Service.
- Farm Household Well-being. (n.d.). U.S. Department of Agriculture, Economic Research Service.