

U.S. Farm Sector Financial Measures Show Little Variation From Prepandemic Expectations
- by Anil K. Giri, Carrie Litkowski, Dipak Subedi and Tia M. McDonald
- 8/9/2023
In early 2020, the U.S. farm sector appeared to be on track for steady financial performance for the year. In February 2020, USDA, Economic Research Service (ERS) forecast net farm income would rise slightly that year from 2019 and net cash income would decrease to slightly below its long-run average (2000–18) in inflation-adjusted dollars. The next month, however, the U.S. Government declared a national emergency over the Coronavirus (COVID-19) pandemic, setting off disruptions to the overall economy and affecting both supply and demand for agricultural commodities. Stay-at-home orders and travel reductions resulted in a sudden sharp decrease in fuel consumption. That, in turn, led to a drop in ethanol prices and, therefore, prices for commodities, such as corn, used to make ethanol. Schools and restaurants closed or curtailed their hours, reducing demand for many food commodities. The supply chain was also disrupted because meat-processing plants shut down. For the U.S. farm sector, the pandemic resulted in diminished sales, lower prices, and other losses such as milk dumping by dairy farmers when schools and restaurants canceled orders.
The Government responded to the economic crisis with laws providing financial assistance to large and small businesses as well as individuals. Farmers were eligible for funds from the Coronavirus Food Assistance Program (CFAP) and the Paycheck Protection Program (PPP), as well as existing programs such as Agriculture Risk Coverage (ARC), Price Loss Coverage (PLC), Conservation programs, and others. In total, the farm sector received $45.6 billion in 2020, a record high for Government payments. In inflation-adjusted 2023 terms, that is $52.2 billion.
Despite the disruptions to supply and demand and fluctuations in prices paid and received, farm income increased in 2020 relative to 2019. However, farm income alone does not provide a holistic measure of the sector’s financial standing and stress because it cannot assess vulnerability to financial risk and performance. Financial ratios provide a more complete picture, blending balance sheet and income statement variables to give additional indications of the sector’s financial performance and position. ERS calculates and reports key financial ratios in its Farm Income and Wealth Statistics data product, which is released three times a year.
The first U.S. calendar year forecasts for 2020 were released on February 5, 2020, 6 weeks before the official pronouncement of the pandemic and before the Government passed any of the COVID-related laws to provide economic assistance to all sectors, including agriculture. So, the 2020 February release represents prepandemic income and balance sheet forecasts for 2020. The most recent release, February 7, 2023, represents the latest estimates through 2021 and captures all COVID-19-related assistance provided to farms in 2020. ERS researchers compared 2020 values for key farm sector financial ratios before the pandemic (from the February 2020 release) with the latest values (from the February 2023 release) to examine how the sector performed in the first pandemic year of 2020. The researchers also examined the forecast values for the same ratios for 2023 to provide insight into the farm sector financial performance this year.
Two closely watched common and popular markers of financial performance are solvency and liquidity, and each has ratios that measure how well the sector is doing in those areas. Analyzing those ratios for 2020 shows that even when some values worsened, the magnitude was not large. That suggests the solvency and liquidity of the farm sector was not affected significantly in the first year of the pandemic despite significant disruptions.
| February 2023 estimates for 2020 compared with: | |||||||
|---|---|---|---|---|---|---|---|
| Category | Ratio | Preferred value | Long-run average (2000–20) | February 2020 release, 2020 forecasts | February 2023 release, 2020 estimates | Long-run average (2000–20) | February 2020 forecasts for 2020 |
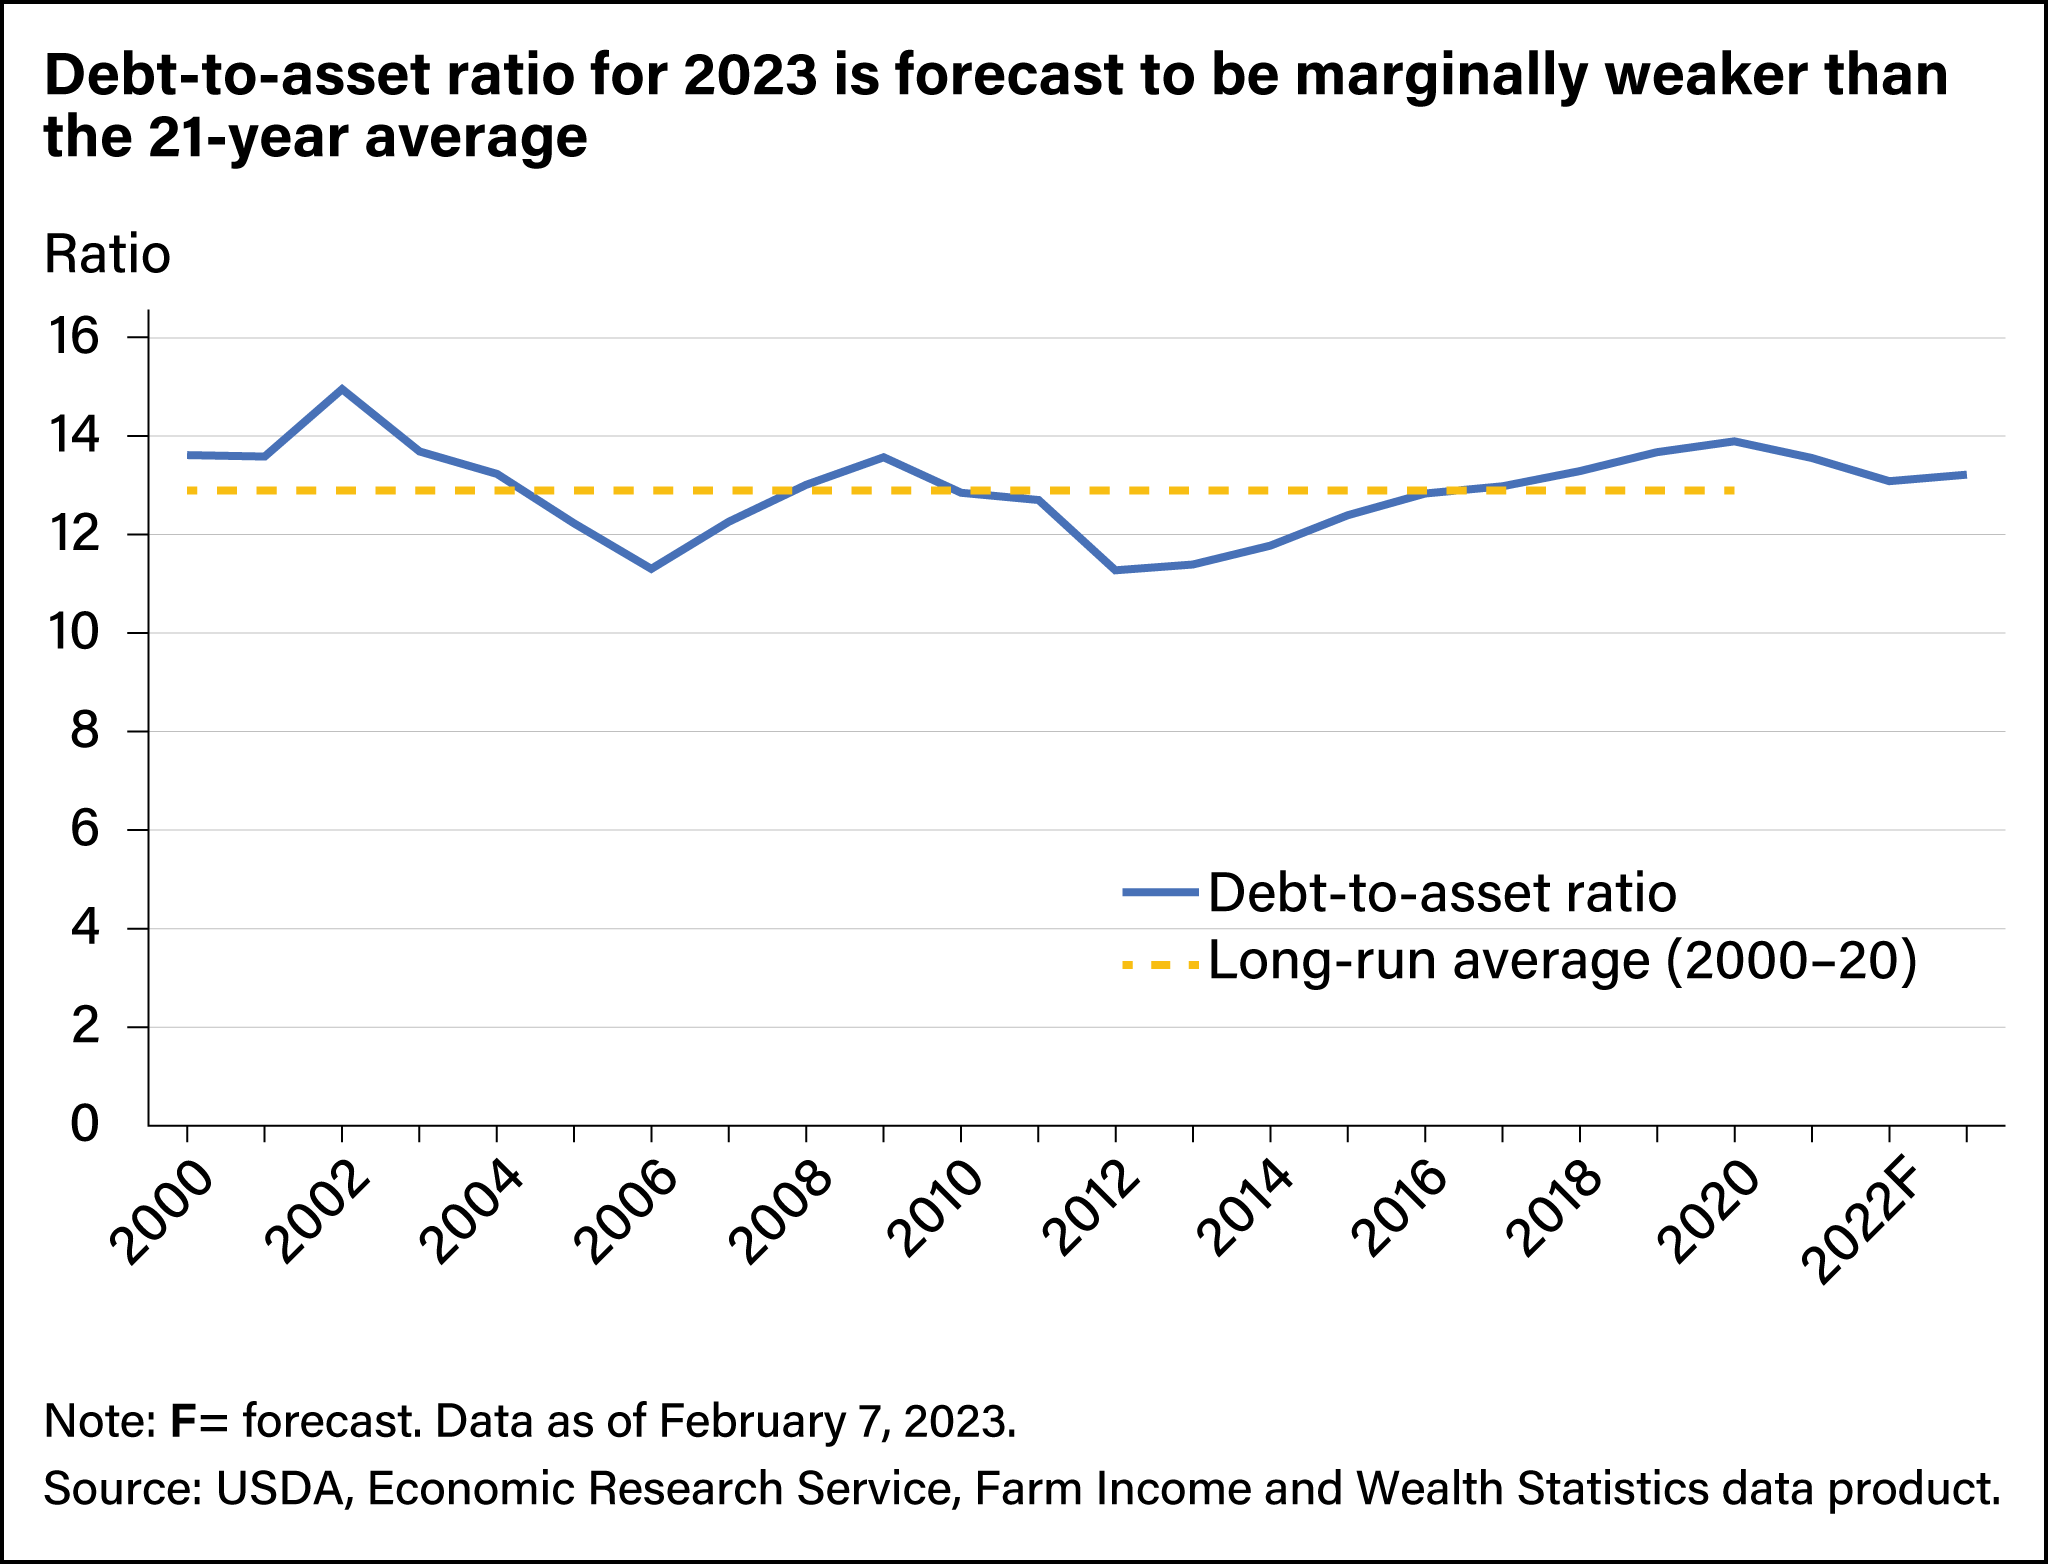
| Solvency ratios | Debt to asset | Low | 12.89 | 13.59 | 13.90 | Weaker | Worsened |
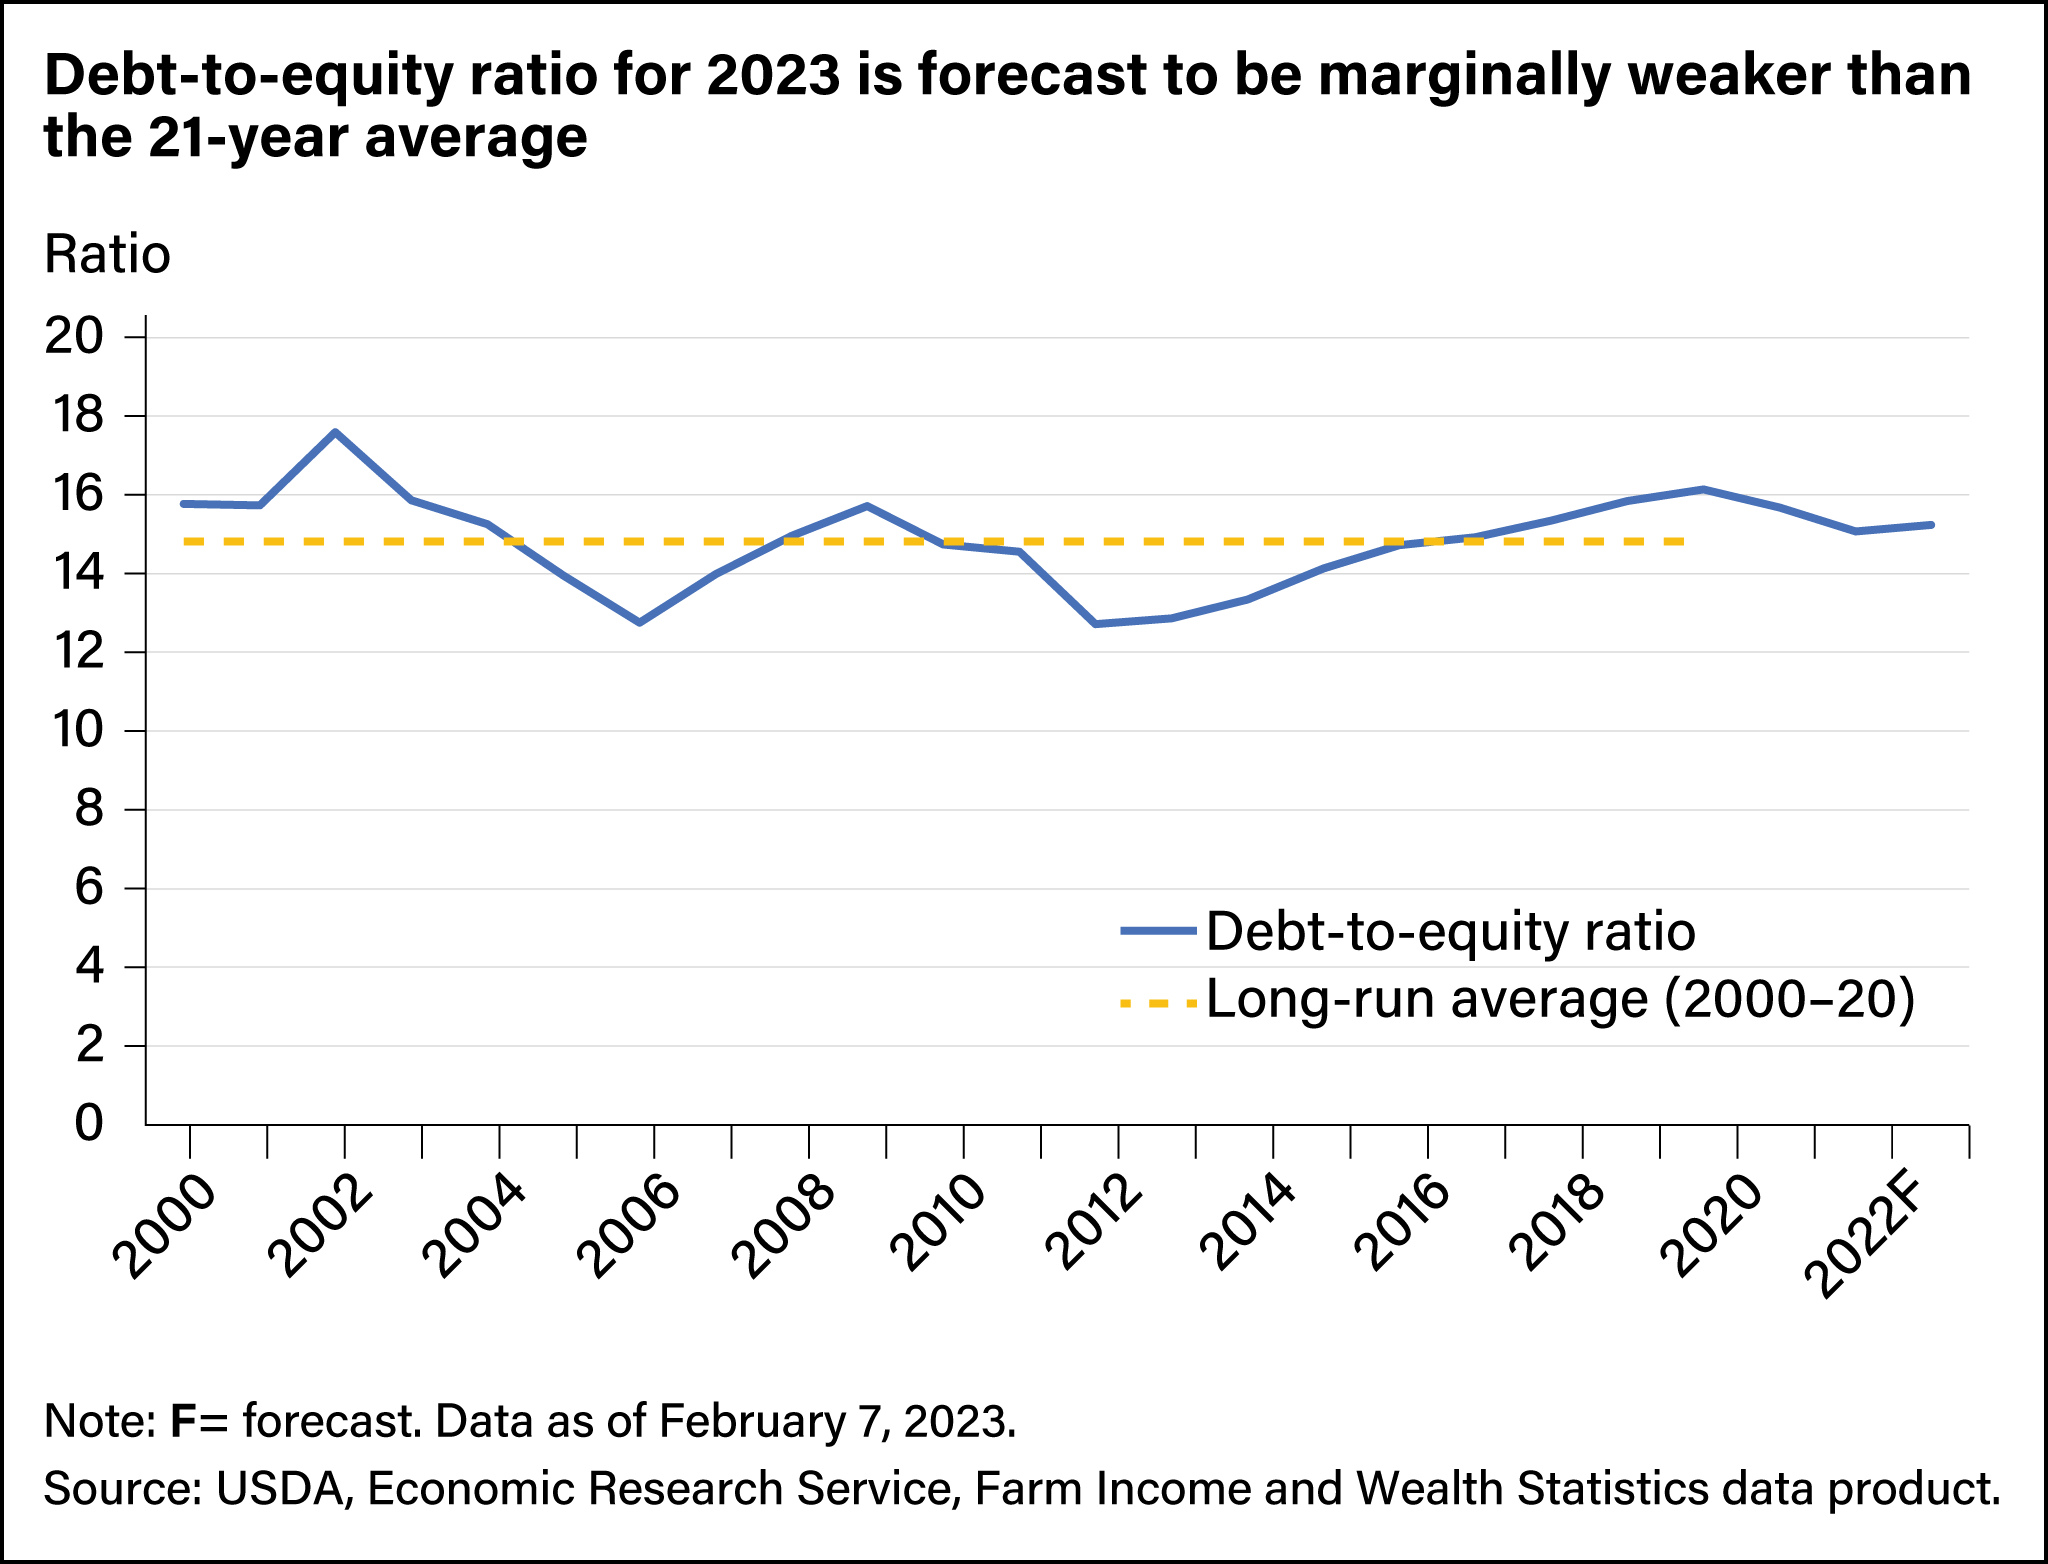
| Debt to equity | Low | 14.81 | 15.73 | 16.14 | Weaker | Worsened | |
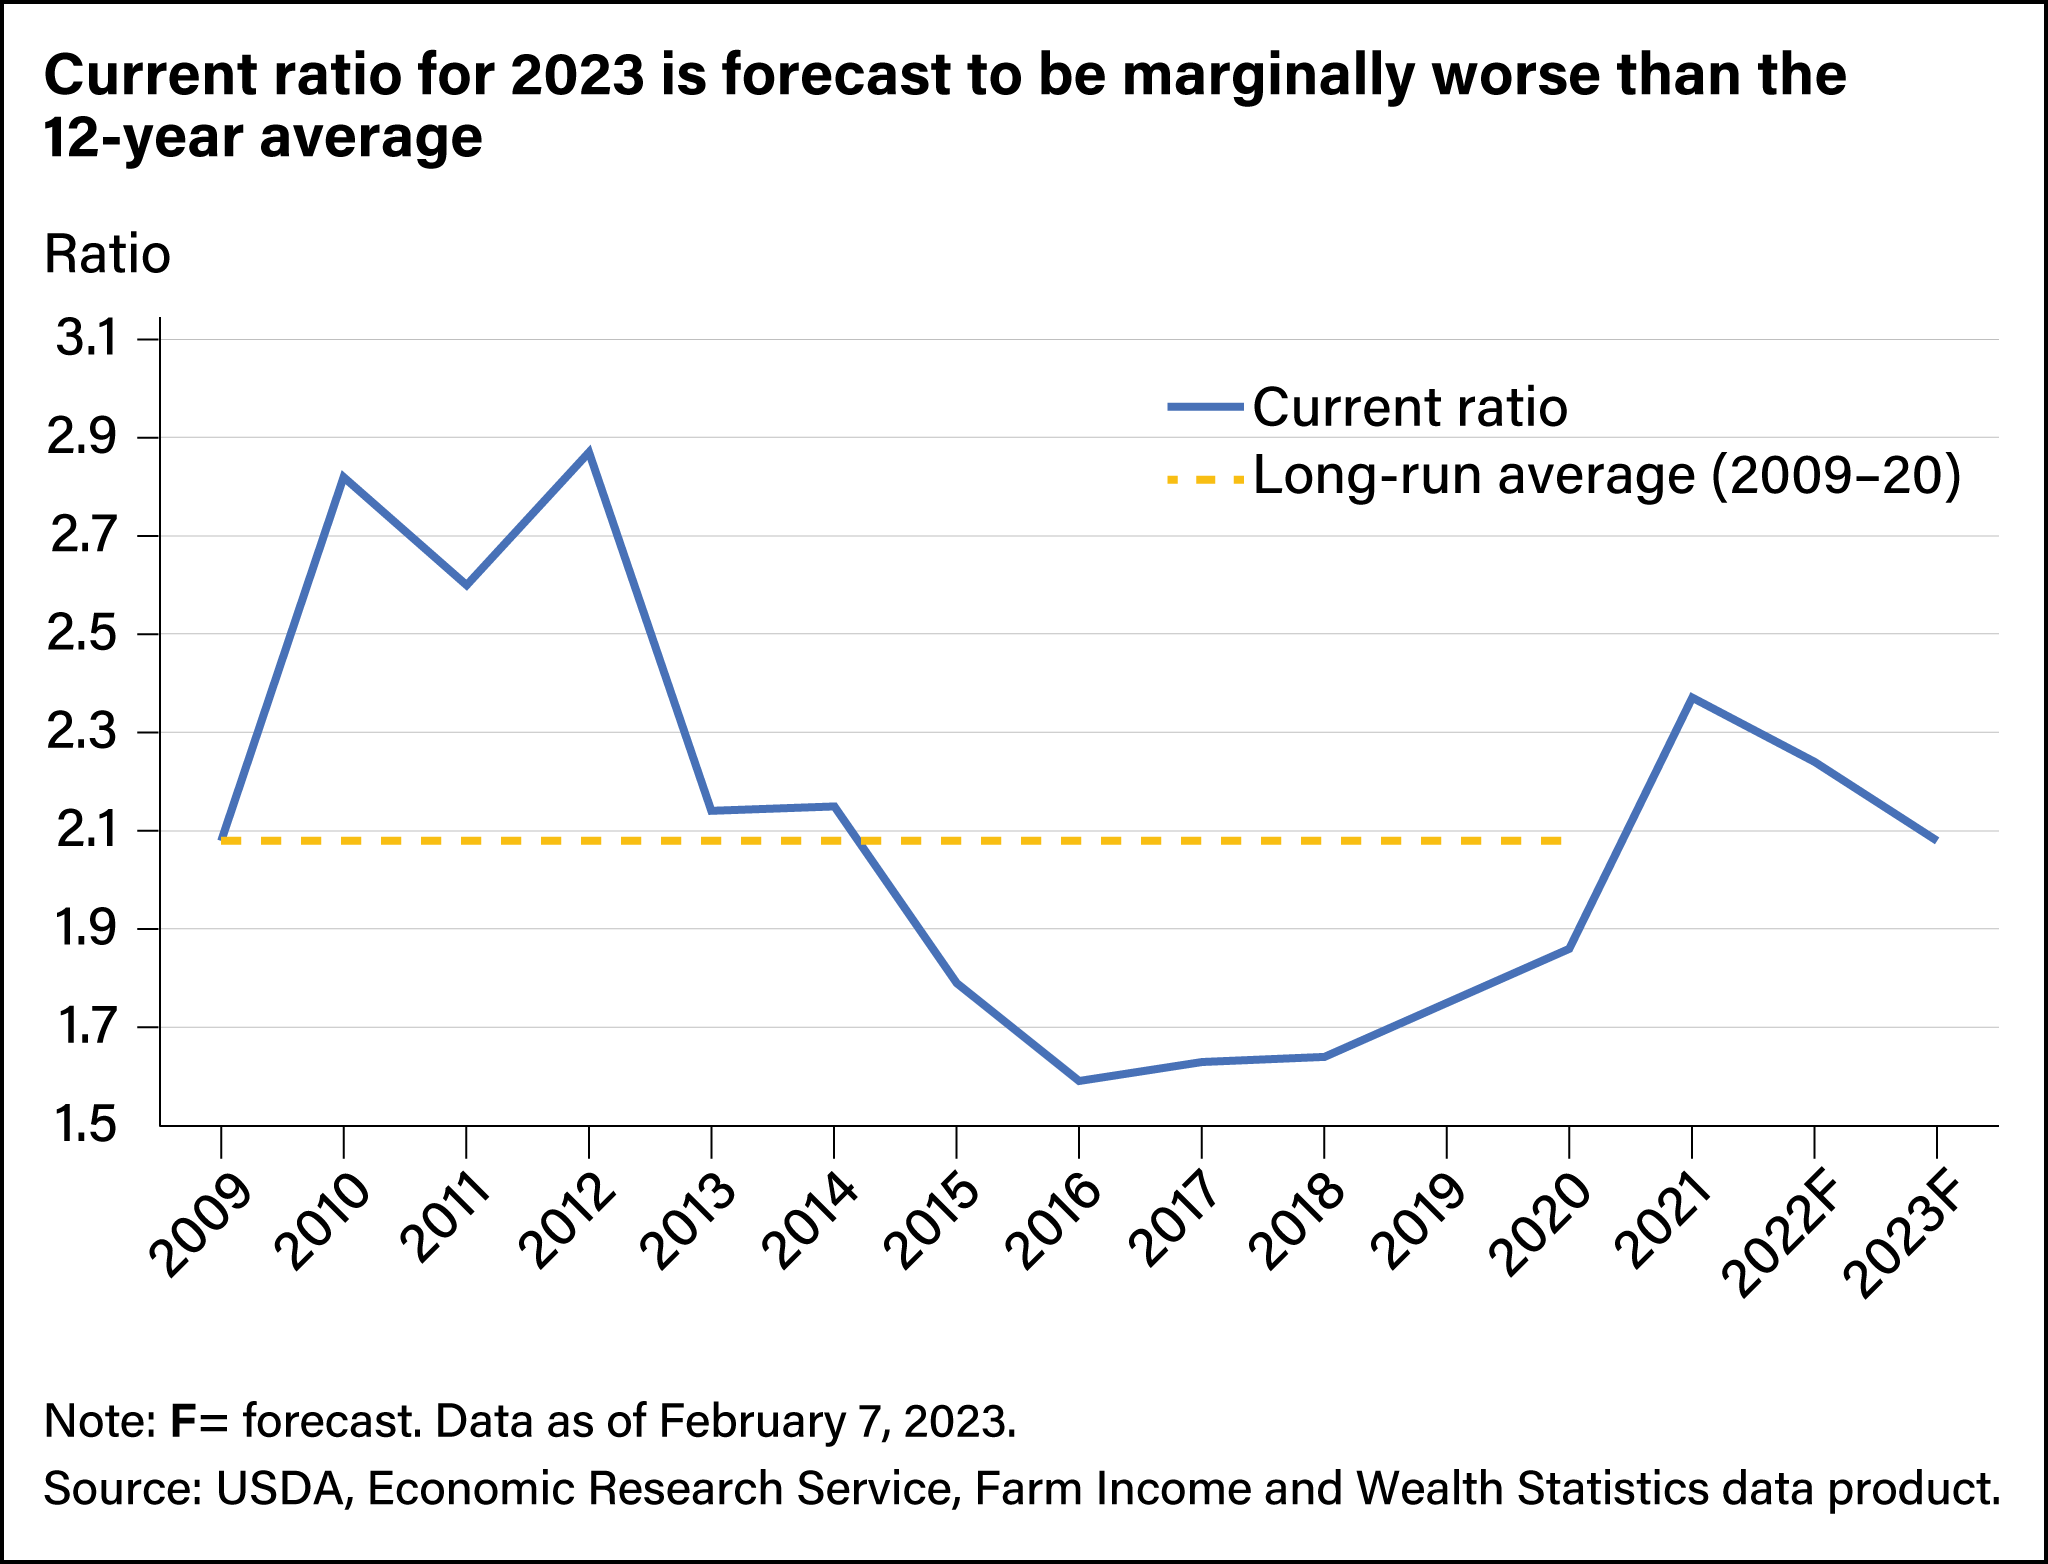
| Liquidity ratios | Current | High | 2.08 | 1.42 | 1.86 | Weaker | Improved |
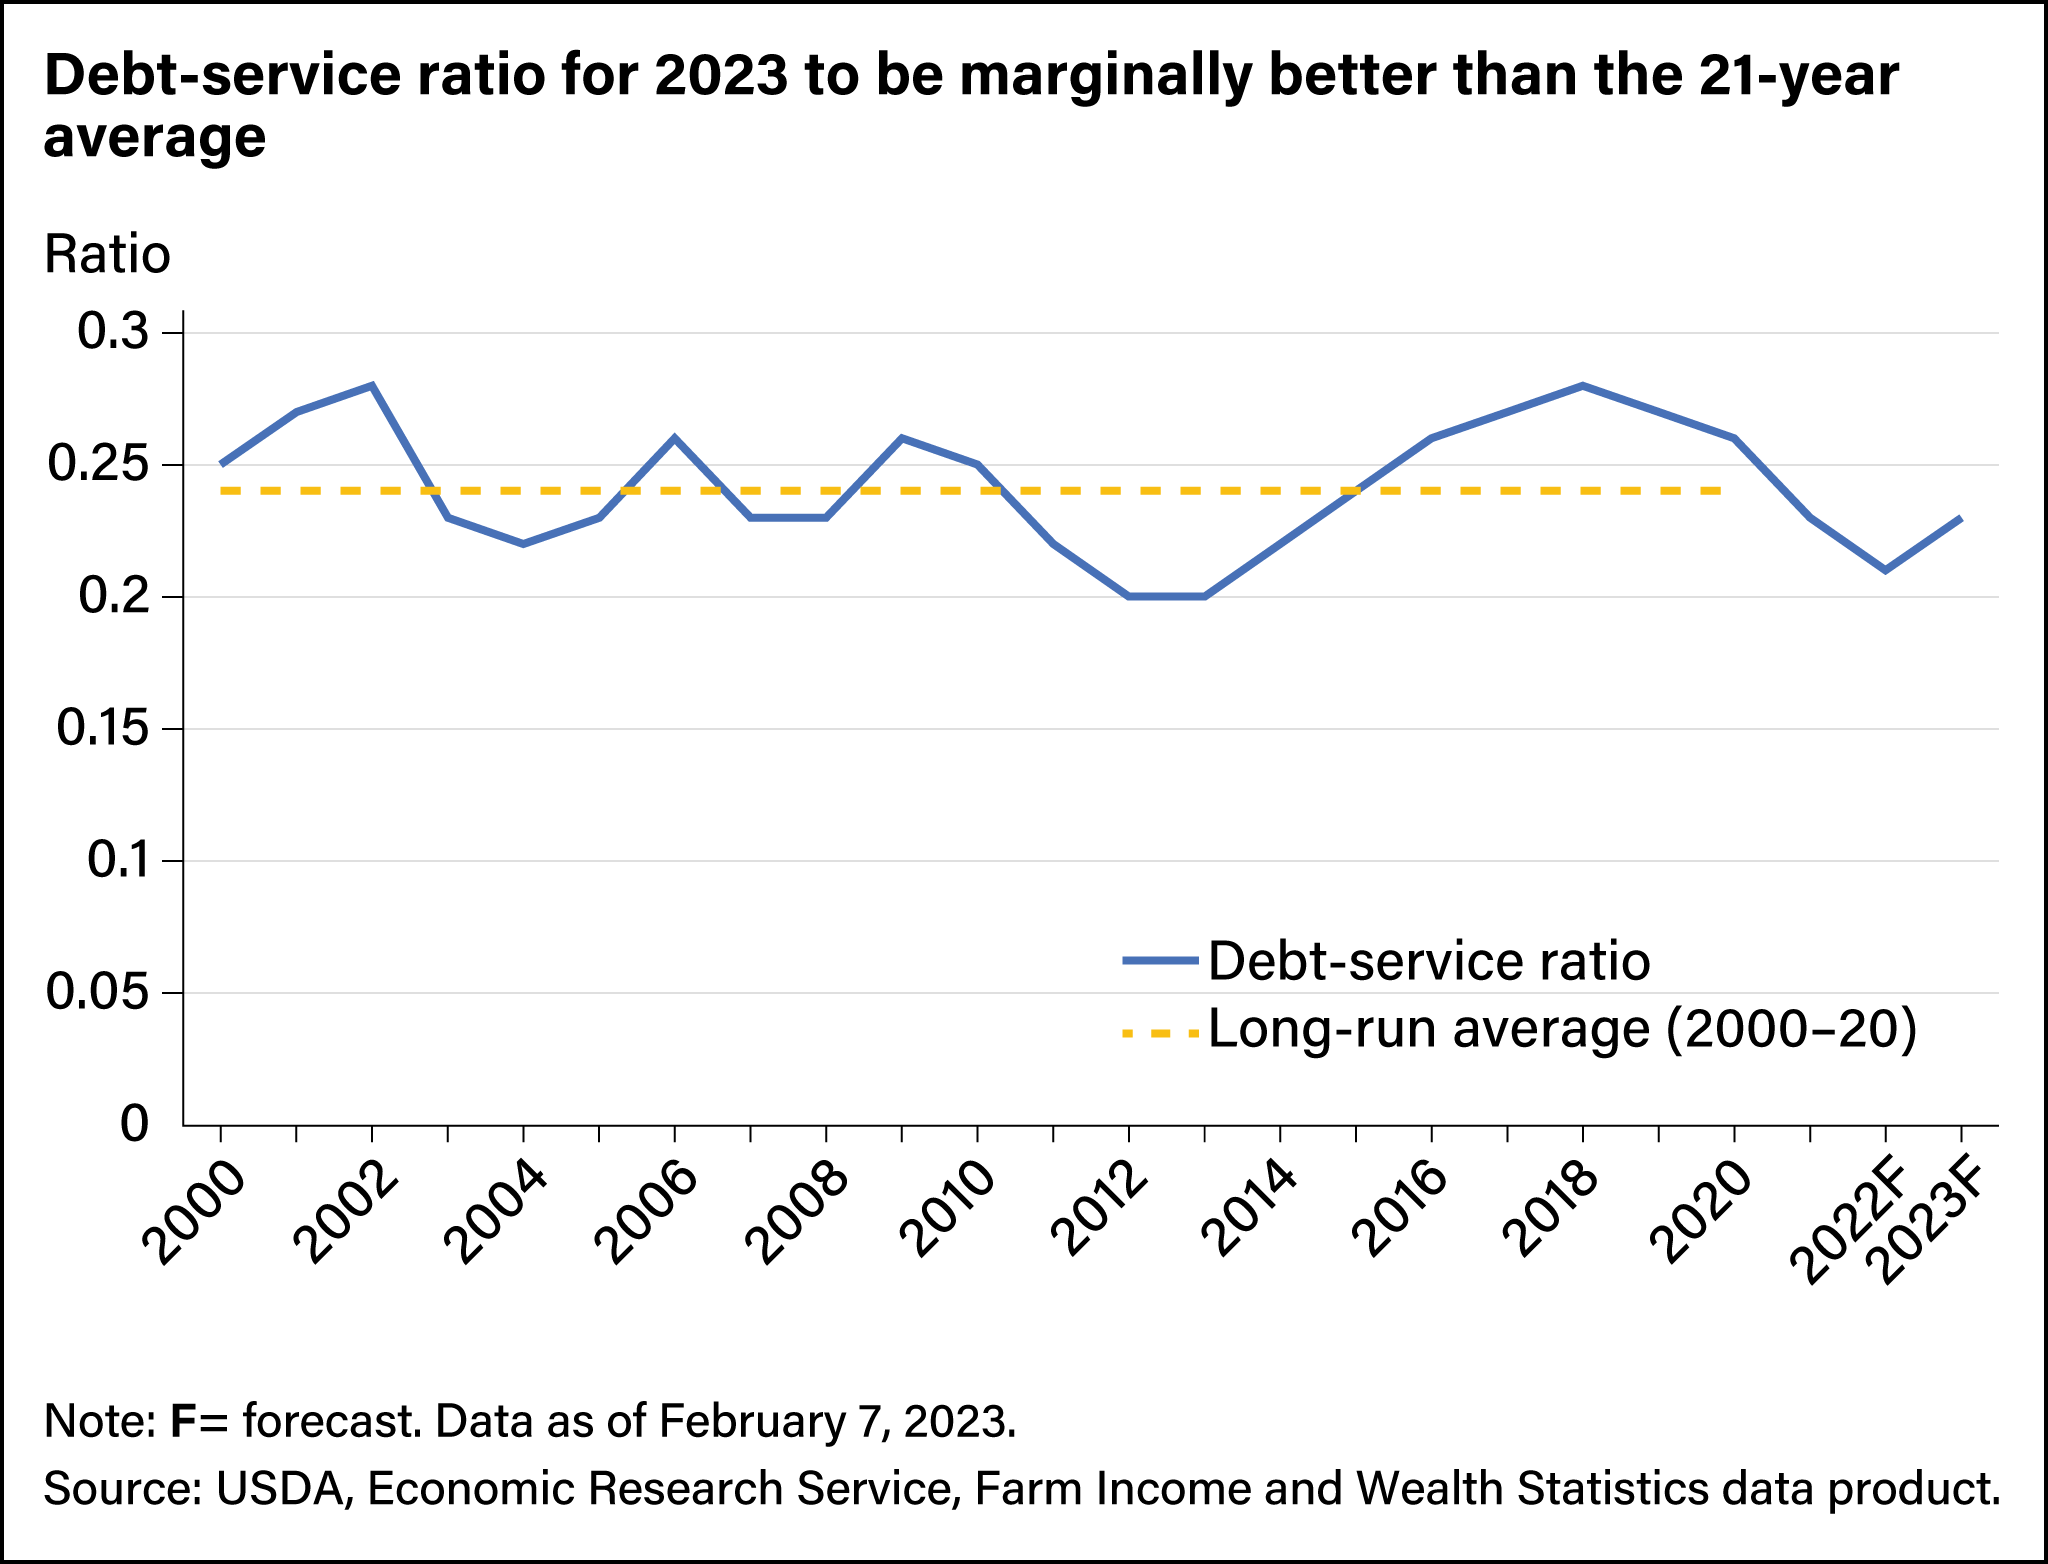
| Debt service | Low | 0.24 | 0.26 | 0.26 | Weaker | No change | |
Note: The long-run average for the current ratio is measured from 2009–20.
Source: USDA, Economic Research Service, Farm Income and Wealth Statistics.
Solvency Ratios
Solvency refers to the ability of the farm sector to satisfy its debt obligations when due. Solvency ratios compare the amount of debt in the farm sector to equity or assets invested. The ratios often are considered measures of leverage, which is the amount of debt used to finance assets. Solvency ratios provide a measure of the sector’s ability to repay financial liabilities through the sale of assets at a given price. By providing a picture of the sector’s current financial position, the ratios also indicate the farm sector’s risk exposure, ability to overcome adverse financial events, meet long-term debt obligations, and continue future operations.
ERS provides estimates and forecasts for three indicators of solvency: the debt-to-equity ratio, the debt-to-asset ratio, and the equity-to-asset ratio. Each is inherently linked because all assets must be either claimed by the farm owner or owed to a creditor, so the ratios provide similar conclusions on sector solvency. Higher debt-to-asset and debt-to-equity ratios indicate a lower level of solvency. Conversely, a lower equity-to-asset ratio indicates a lower level of solvency. The debt-to-asset ratio is calculated by dividing total debt by total assets for a given year, and a lower resulting value is preferred. The debt-to-equity ratio is calculated by dividing total debt by total equity for a given year, and a lower value is preferred. The equity-to-asset ratio is calculated by dividing total equity by total assets for a given year, and a higher value is preferred. Because assets are the sum of liabilities and equity, the debt-to-asset and equity-to-asset ratios always add to 1.0 (the equivalent of adding to 100 percent).
ERS forecast a debt-to-asset ratio of 13.59 percent for 2020 in its last prepandemic release. In February 2023, the ratio was revised and estimated at 13.90 percent. Since a lower value is preferred to a higher value, the 2020 debt-to-asset ratio ended up worse than prepandemic expectations for 2020 and even more so compared with the 21-year (2000 through 2020) average of 12.89 percent. The forecast value for the 2023 debt-to-asset ratio is 13.22 based on the February 7, 2023, release. This suggests that the debt-to-asset ratio for 2023 will be weaker than the 21-year average.
Similarly, the 2020 debt-to-equity ratio (for which lower values are preferred), forecast at 15.73 percent before the pandemic, ended up worse at 16.14 percent in the postpandemic release. That also was worse than the 21-year average of 14.81 percent. For 2023, the ratio is forecast to be higher than the 21-year average at 15.24 percent, suggesting a slightly weaker state of solvency for the farm sector.
Liquidity: Current Ratio
Liquidity refers to how quickly assets can be converted into cash, which is the most liquid asset. Liquidity ratios help assess the farm sector’s ability to make scheduled payments as they come due. Liquidity indicators are focused on the ability to meet short-term debt, as well as to sell assets quickly to raise cash.
The current ratio and debt-service ratio are two of the most common and popular liquidity ratios. The current ratio measures the ability of current assets, if sold and converted to cash, to cover current debt obligations. It is calculated by dividing current assets by current debt. Current assets are assets that may be converted into cash, sold, or consumed within a year. Current debt is the value of liabilities owed to lenders within the next 12 months. This includes short-term production loans with a total term of 12 months or less as well as the current portion of longer term real estate and nonreal estate loan balances. For the current ratio, higher values are preferred.
ERS forecast the 2020 current ratio at 1.42 in February 2020 and estimated it at 1.86 in February 2023. That means the current ratio for 2020 improved slightly from prepandemic expectations. Even so, it was below the 12-year average (2009 through 2020, the only period for which data is available) of 2.08. The current ratio for 2023 is forecast at 2.08, the same as the 12-year average.
Liquidity: Debt-Service Ratio
The debt-service ratio measures the share of production, plus direct Government payments, used for debt payments. It is calculated by dividing interest expenses (minus principal payments) by the sum of the value of production and Government payments for a given year.
ERS forecast the debt-service ratio (for which lower values are preferred) at 0.26 for 2020 in its last prepandemic release. This was unchanged in the February 7, 2023, estimate and above the 21-year average (2000 through 2020) of 0.24. The forecast value for the 2023 debt-service ratio is 0.23 based on the February 7, 2023, release. This suggests that the debt-service ratio for 2023 will be marginally better than the 21-year average.
The analysis of some of the key financial ratios for the farm sector shows that the sector’s solvency and liquidity in 2020 were not impacted significantly because even when some values worsened, the magnitude was not significant. Two of the popular solvency ratios—debt-to-asset ratio and debt-to-equity ratio—for 2020 ended up slightly worse than their prepandemic expectations and the long-run average. One of the more popular ratios used to measure liquidity, the current ratio, improved slightly in 2020 compared with prepandemic expectations but was still worse than the long-run average. The other popular liquidity ratio, debt service, remained unchanged compared with prepandemic expectations but was weaker compared with the long-run average. Finally, for 2023, two liquidity ratios, debt-to-asset and debt-to-equity, are forecast to be worse than their long-run average. At the same time, the debt service ratio is forecast to be better than its long-run average, and the current ratio is forecast to be the same as its long-run average.
This article is drawn from:
- Giri, A.K., Litkowski, C., Subedi, D. & McDonald, T.M. (2022). COVID-19 Working Paper: Farm Sector Financial Ratios: Pre-COVID Forecasts and Pandemic Performance for 2020. U.S. Department of Agriculture, Economic Research Service. AP-104.
You may also like:
- Farm Income and Wealth Statistics. (n.d.). U.S. Department of Agriculture, Economic Research Service.
- Farm Sector Income & Finances - Farm Sector Income Forecast. (n.d.). U.S. Department of Agriculture, Economic Research Service.