

Farm Households’ Consumption of Market Facilitation Payments Differed by Farm Type and Year
- by David J. Williams and Jessica E. Todd
- 11/7/2022
Farm incomes are volatile and farm households employ a variety of financial strategies to generate the necessary cash flows to maintain a standard of living that is based on their expected average income over time—a process called “consumption smoothing.” Households save, invest, and work fewer hours off the farm when farm income is higher than expected and spend down their savings, borrow, disinvest, or work more at off-farm jobs when farm income is lower than expected. The marginal propensity to consume (MPC) out of income—how much an additional dollar of income increases consumption spending—tells researchers how well households are able to smooth their consumption. The larger the MPC, the less the household is smoothing consumption.
USDA created the Market Facilitation Program (MFP) to assist farmers in response to trade disruptions resulting from retaliatory tariffs in 2018 and 2019. The 2018 program was announced in August 2018 and was distributed in two tranches—in fall 2018 and in early 2019. The 2019 program consisted of three tranches, two in 2019 and one in early 2020.
USDA, Economic Research Service researchers and a collaborator at Purdue University estimated the MPC from off-farm income, net farm income less Government payments, MFP payments received in 2018, MFP payments received in 2019, and other direct Government payments between 2014 and 2019. They estimated the MPCs separately for households operating three types of farms:
- commercial farms, those with gross cash farm income (GCFI) of $350,000 or more a year,
- intermediate farms, those with GCFI less than $350,000 a year and in which the principal operator reports that the main occupation is farming
- and residence farms, those with GCFI less than $350,000 a year and the principal operator reports being retired from farming or that the main occupation is something other than farming.
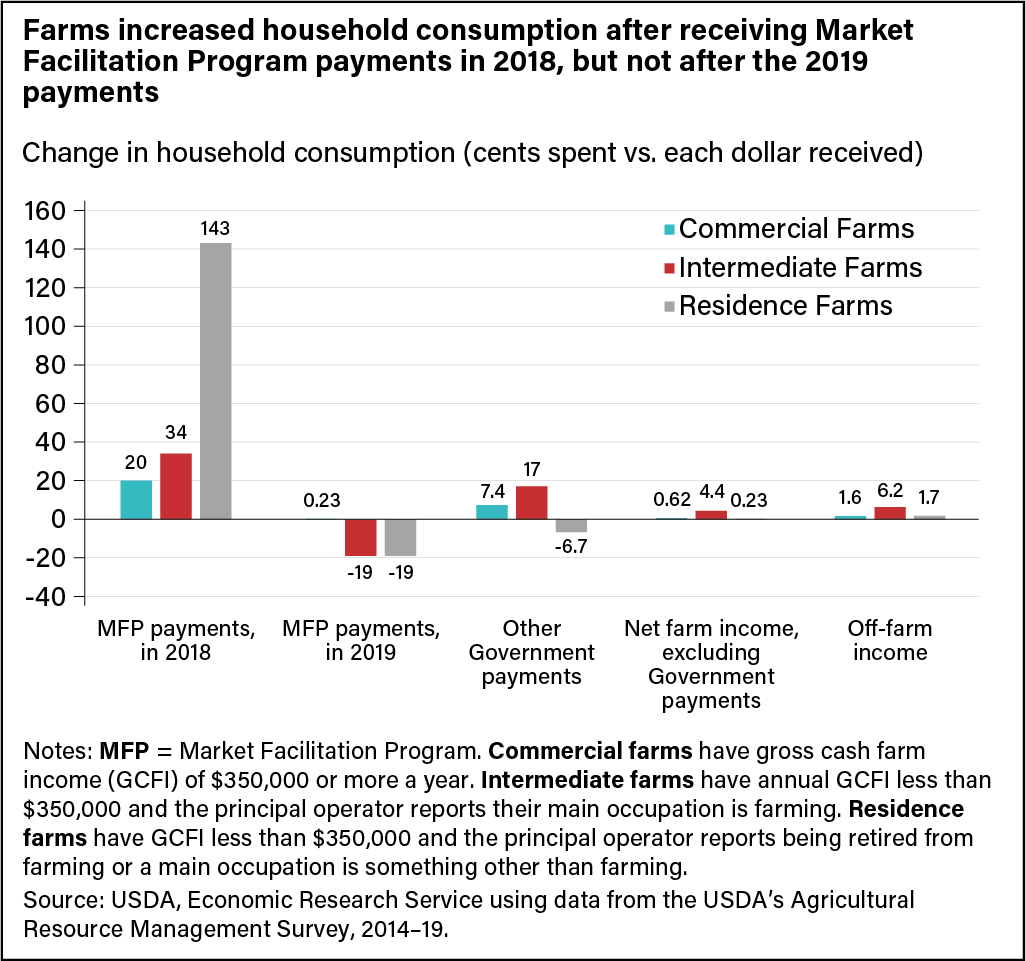
Researchers found that changes in off-farm income, net farm income less Government payments, and Government payments excluding the MFP payments changed household consumption relatively little. That indicated the households were able to smooth the consumption of these sources of income. The MPC’s from the MFP payments were considerably larger, particularly for residence farms. Even so, they differed between the 2 years.
Researchers estimated that in 2018, commercial farm households increased their consumption spending by 20 cents for every dollar of Market Facilitation Program payment they received. Intermediate farm households consumed 34 cents on the dollar. Residence farm households consumed more than the MFP payments they received in 2018, increasing their consumption by 143 cents on the dollar. The response to the MFP payments in 2019 was different. In response to MFP payments received in 2019, commercial and residence farm households did not change their consumption and intermediate farm households decreased their consumption by 19 cents for every dollar that they received. This suggests that in 2018, farm households may have spent some of their second MFP payment that was to be disbursed in early 2019. They did this by borrowing money or spending down savings, and then paying back the loans or restoring their savings once they received the second tranche in 2019. The negative consumption effect in 2019 also indicates that farmers may have moved planned consumption expenditures that ordinarily would have occurred in early 2019 into late 2018. This anticipatory spending was possible because farmers were able to reliably estimate their expected second MFP payment before it was received.
Researchers also found evidence that farm households’ consumption of the MFP payments varied by their debt-to-asset ratio (a measure of their overall leverage). Those with higher debt-to-asset ratios consumed the MFP payments they received in 2018 at lower rates than those with lower debt-to-asset ratios. For the payments received in 2019, however, farm households with higher debt-to-asset ratios consumed at higher rates than those with lower debt-to-asset ratios. Farmers with a lower debt-to-asset ratio were able to borrow and spend in anticipation of forthcoming MFP payments. The same was not true for farmers with a higher debt-to-asset ratio.
This article is drawn from:
- Williams, D.J., Brewer, B.E. & Todd, J.E. (2022). “Farm households' consumption of ad hoc program payments". Applied Economic Perspectives and Policy. DOI: 10.1002/aepp.13266 .
You may also like:
- Morgan, S. (2022, March 7). Retaliatory Tariffs Reduced U.S. States’ Exports of Agricultural Commodities. Amber Waves, U.S. Department of Agriculture, Economic Research Service.
- Farm Household Well-being. (n.d.). U.S. Department of Agriculture, Economic Research Service.
- Farm Household Income and Characteristics. (n.d.). U.S. Department of Agriculture, Economic Research Service.