

Retaliatory Tariffs Reduced U.S. States’ Exports of Agricultural Commodities
- by Stephen Morgan
- 3/7/2022
Highlights
- In 2018, the United States imposed tariffs on steel and aluminum imports from major trading partners and separate tariffs on imports from China.
- Six trading partners imposed retaliatory tariffs: Canada, China, the European Union (EU, including the United Kingdom), India, Mexico, and Turkey imposed retaliatory tariffs on many U.S. exports, including a wide range of agricultural and food products.
- Across all commodities and States, annual U.S. losses from retaliatory tariffs were estimated to be $13.2 billion.
- Losses from retaliatory tariffs were concentrated among Midwestern States, with the largest losses among producers of soybeans, sorghum, and pork.
Taxes on imports, also called tariffs, are typically used to protect domestic industries or raise government revenue. However, tariffs may also be implemented in response to unfavorable policy actions taken by trading partners. In these cases, the import tax is typically referred to as a retaliatory tariff (see blue box below, “Retaliation in trade policy”). Retaliatory tariffs increase the price of imports for foreign consumers relative to alternatives that are either domestically produced or available from competing international sources. Producers in exporting countries may find opportunities to sell their products to other non-retaliating trade partners, but retaliatory tariffs typically reduce an exporting nation’s overall sales for targeted commodities.
In 2018, the United States imposed tariffs on steel and aluminum imports from major trading partners and separately placed tariffs on a broad range of imports from China. In response, Canada, China, the European Union (EU, including the United Kingdom), India, Mexico, and Turkey imposed retaliatory tariffs on many U.S. exports, including a wide range of agricultural and food products.
USDA, Economic Research Service (ERS) researchers studied how these tariffs affected U.S. farmers across different States and commodities in an economic research report, The Economic Impact of Retaliatory Tariffs on U.S. Agriculture. Using data from the ERS State Exports, Cash Receipts Estimates, researchers estimated losses from retaliatory tariffs and analyzed how the recent trade dispute affected farm cash receipts from exports by State and commodity. Researchers found total losses were concentrated among Midwestern States, with the largest losses among producers of soybeans, sorghum, and pork. Across all commodities and States, annual U.S. losses from retaliatory tariffs were estimated to be $13.2 billion from mid-2018 through 2019.
Six Trading Partners Implemented Retaliatory Tariffs Affecting U.S. Agricultural Exports
Beginning in 2017, the United States initiated two trade actions. In April 2017, the U.S. Department of Commerce initiated an investigation under Section 232 of the Trade Expansion Act of 1962 to determine whether aluminum and steel were being imported in such quantities or under such circumstances to affect U.S. national security. In August 2017, the U.S. Trade Representative initiated a Section 301 investigation to determine whether China’s policies related to intellectual property and technology transfer were actionable under U.S. trade law. As a result of the Section 232 investigation, the United States applied tariffs of 25 percent on steel imports and 10 percent on aluminum imports from all suppliers, although exceptions were made for certain countries. Additionally, the Section 301 investigation found China’s policies were actionable, and the United States imposed a 25-percent tariff on a broad range of goods from China.
In April 2018, China responded to the tariffs on steel and aluminum by implementing retaliatory tariffs affecting U.S. exports (see chart below). This round of retaliatory tariffs covered several U.S. agricultural products, including horticultural products, pork, and tree nuts. In July 2018, China responded to the United States’ action against Chinese imports stemming from the Section 301 investigation by imposing additional tariffs ranging from 5 to 25 percent on many agricultural products worth $22.5 billion.
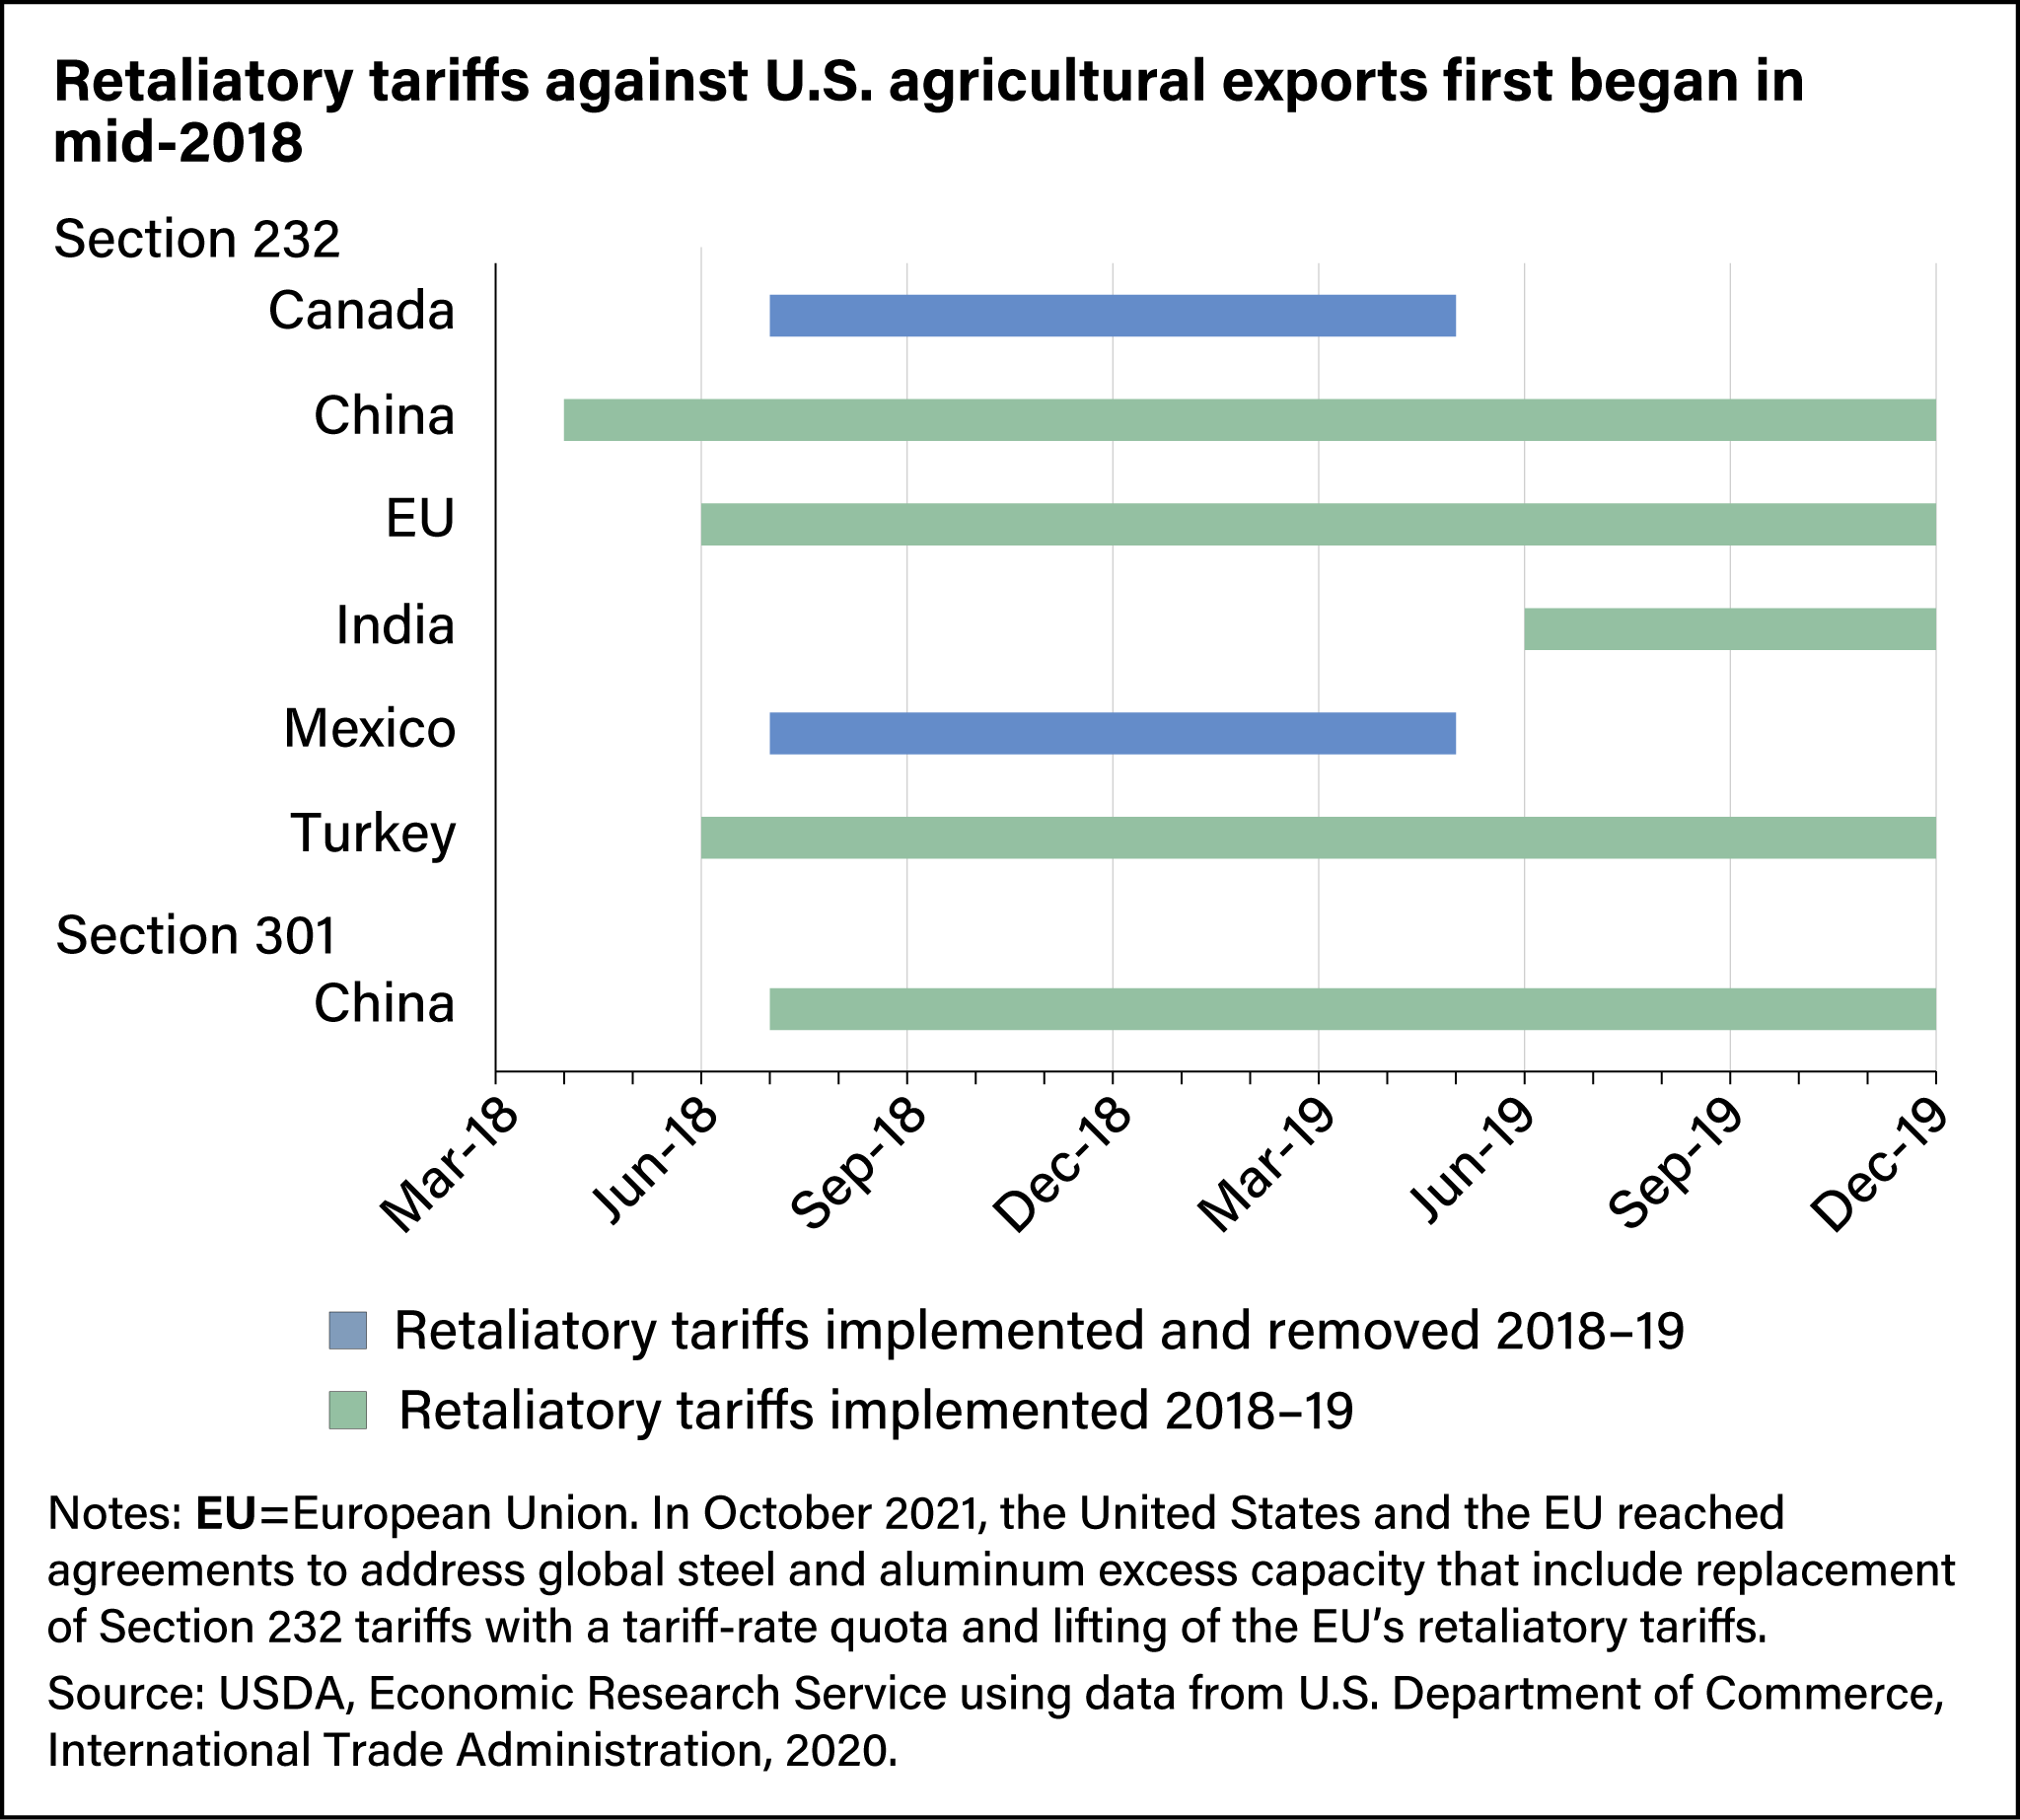
Also in June 2018, the EU imposed retaliatory tariffs of 25 percent on U.S. agricultural products, including whiskies, corn, and processed fruits and vegetables. At the same time, Turkey imposed tariffs ranging from 10 to 70 percent on tree nuts, rice, food preparations, whiskey, and tobacco products. Turkey would later double its retaliatory tariffs, before lowering them back to June 2018 levels.
In July 2018, Canada and Mexico also imposed retaliatory tariffs on U.S. agricultural products. Canada imposed tariffs of 10 percent on goods including prepared food products, coffee, and orange juice. Mexico imposed tariffs ranging from 15 to 25 percent on products including pork, fresh and processed fruit, and processed vegetables. Leading up to the signing of the United States-Mexico-Canada Agreement (USMCA, formerly the North American Free Trade Agreement), the three trading partners reached a deal to have an import-monitoring mechanism for steel and aluminum. In turn, Canada and Mexico lifted their retaliatory tariffs in May 2019.
In June 2019, India imposed tariffs on U.S. almonds, walnuts, apples, chickpeas, lentils, and brine shrimp. The additional tariff rates ranged from 2 to 20 percent. India’s retaliatory tariffs were implemented after the United States removed India’s duty-free access to the U.S. market for a wide range of products, both agricultural and non-agricultural.
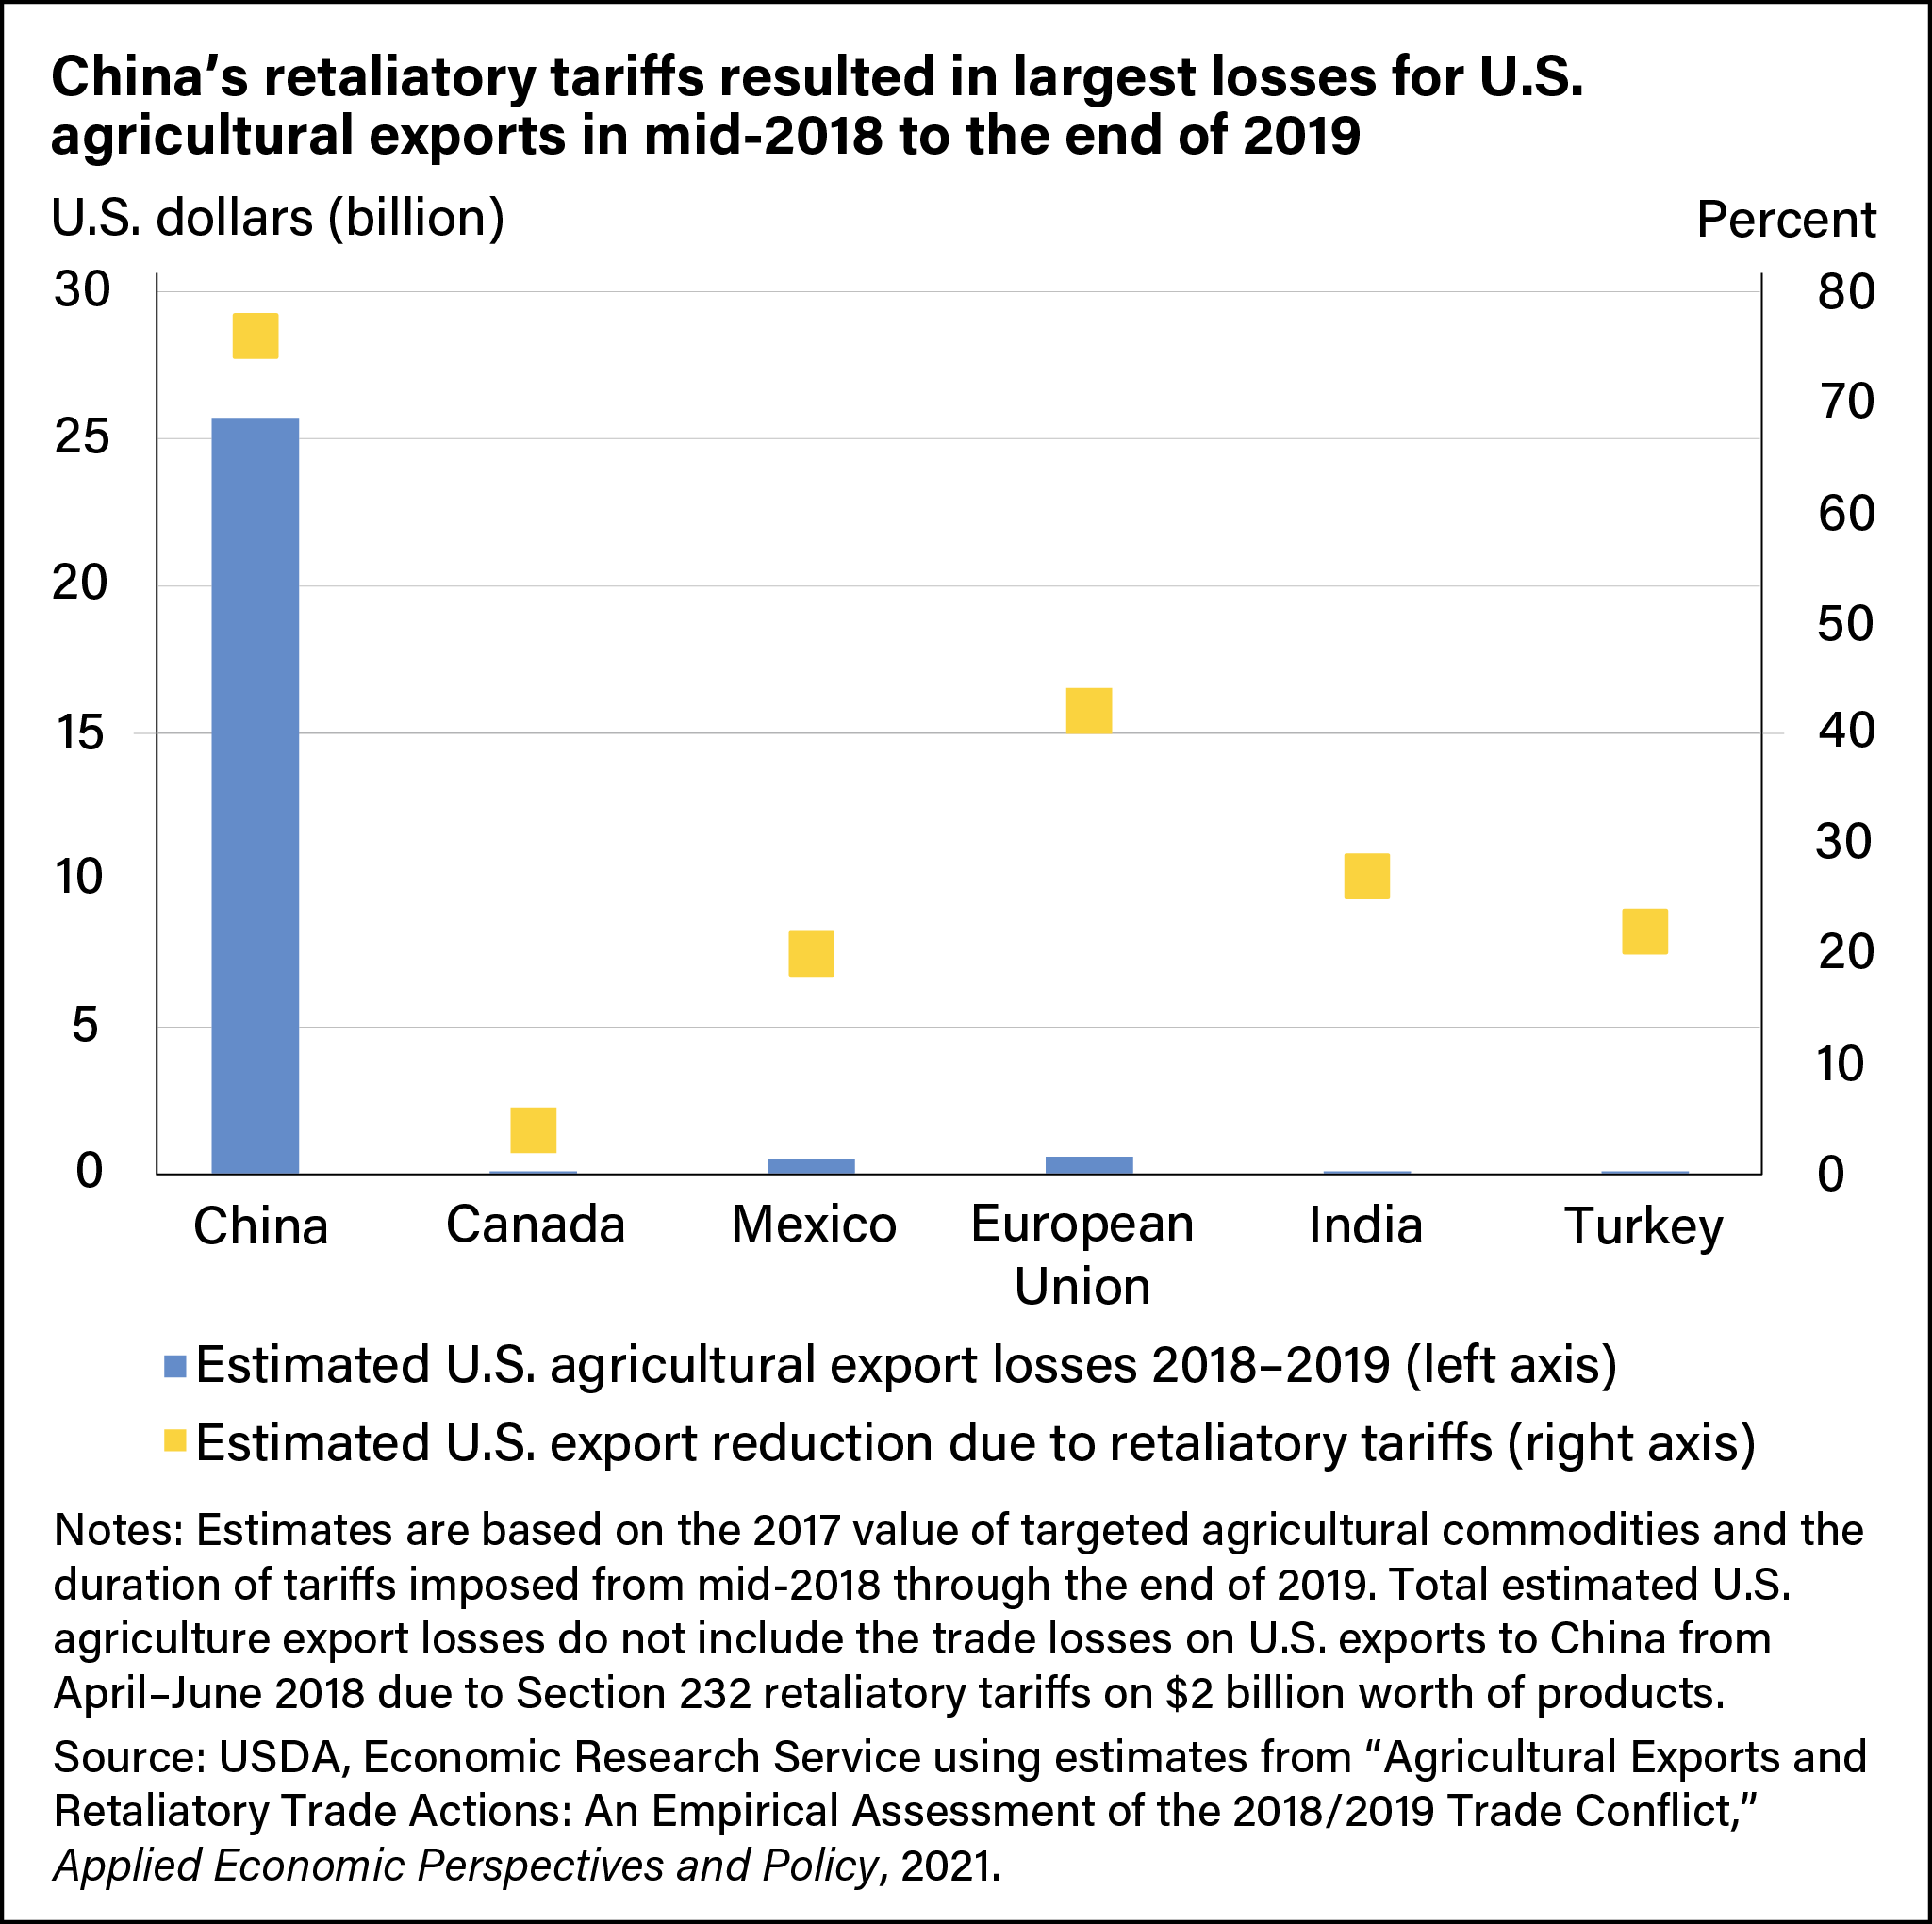
In total, the estimated value of U.S. agricultural export losses associated with retaliation by the six trading partners was more than $27 billion from mid-2018 through the end of 2019. The chart below shows the value of losses by trading partner. China’s retaliatory tariffs were estimated to reduce U.S. agricultural exports by nearly $26 billion, followed by the EU ($600 million) and Mexico ($500 million) with other partners resulting in smaller losses.
USDA researchers also reported the reduction in the value of U.S. agricultural exports by trading partner from mid-2018 through the end of 2019. While China’s tariffs resulted in a 76-percent reduction in the value of U.S. agricultural exports, the value reductions for other trading partners were also significant (see chart below). For example, the retaliatory tariffs imposed by the EU reduced the value of targeted U.S. exports to the EU by 42 percent.
Trade Losses Varied Across Commodity Groups
Differences in the timing, tariff rates, and product lines affected by retaliatory tariffs across different trading partners led to a variety of losses for different commodity groups. To estimate the effects of retaliatory tariffs on producers, ERS researchers gathered data on the value of commodities produced by each State that were sold to other countries in 2017 as a base for estimates of trade values. The year 2017 was selected because it preceded the start of the trade actions, thus serving as a proxy for what U.S. agricultural exports may have been without the retaliatory tariffs.
Estimated annual U.S. losses from retaliation totaled $13.2 billion, spread across 17 different commodity groups. The chart below shows the share of loss for each commodity group.

Several patterns emerged across commodities. Soybeans accounted for the largest share of total trade loss, making up nearly 71 percent ($9.4 billion) of annual losses. Soybeans account for around 13 percent of the value of total U.S. exports, the highest export value for a single U.S. commodity. China typically imports the most U.S. soybeans. Similarly, China imposed a 25-percent tariff on U.S. sorghum affecting the 2018 marketing year (September through August), accounting for more than 6 percent ($854 million) of annual losses from retaliatory tariffs.
Pork represented nearly 5 percent ($646 million) of estimated annual losses and was a target for retaliation by both China and Mexico. However, some of the losses from retaliation by Mexico may have been mitigated by a duty-free tariff-rate quota for 350,000 tons of pork product that was implemented alongside the retaliatory tariffs. Beef and veal products accounted for a small share of losses (one-tenth of a percent). Trade values were already low since China banned U.S. beef in 2003 and only recently agreed to new import conditions in 2017.
Retaliatory tariffs also affected U.S. fruits, vegetables, and tree nuts. Trade losses were valued at $618 million in the fruit category (more than 4 percent), including $424 million in processed fruit (about 3 percent) and $194 million in fresh fruit (more than 1 percent). There were also $219 million in losses for tree nuts (nearly 2 percent). For fresh vegetables, retaliatory tariffs resulted in annualized losses of $0.4 million. Within these categories, however, some specific commodities may have experienced particularly high losses because they lack alternative markets and therefore rely more heavily on export markets than other commodities. Perishability is also a factor for some of these crops.
Canada and China placed retaliatory tariffs on dairy representing just under 3 percent ($391 million) of the losses. These 2 countries were the second and third largest destinations for U.S. dairy product exports in 2017, accounting for 24 percent of total exports. Cotton represented just under 3 percent ($366 million) of the total amount of export losses, although China was the only country that placed tariffs on cotton.
Tariff retaliation against wheat and corn accounted for more than 2 percent ($309 million) and more than 1 percent ($198 million) of annualized tariff losses, respectively. Wheat products and corn were targets of China’s tariffs, while the EU and Turkey imposed tariffs on U.S. rice exports, which amounted to less than 1 percent ($46 million) of total losses.
Retaliatory Tariff Export Losses Were Concentrated in the Midwest
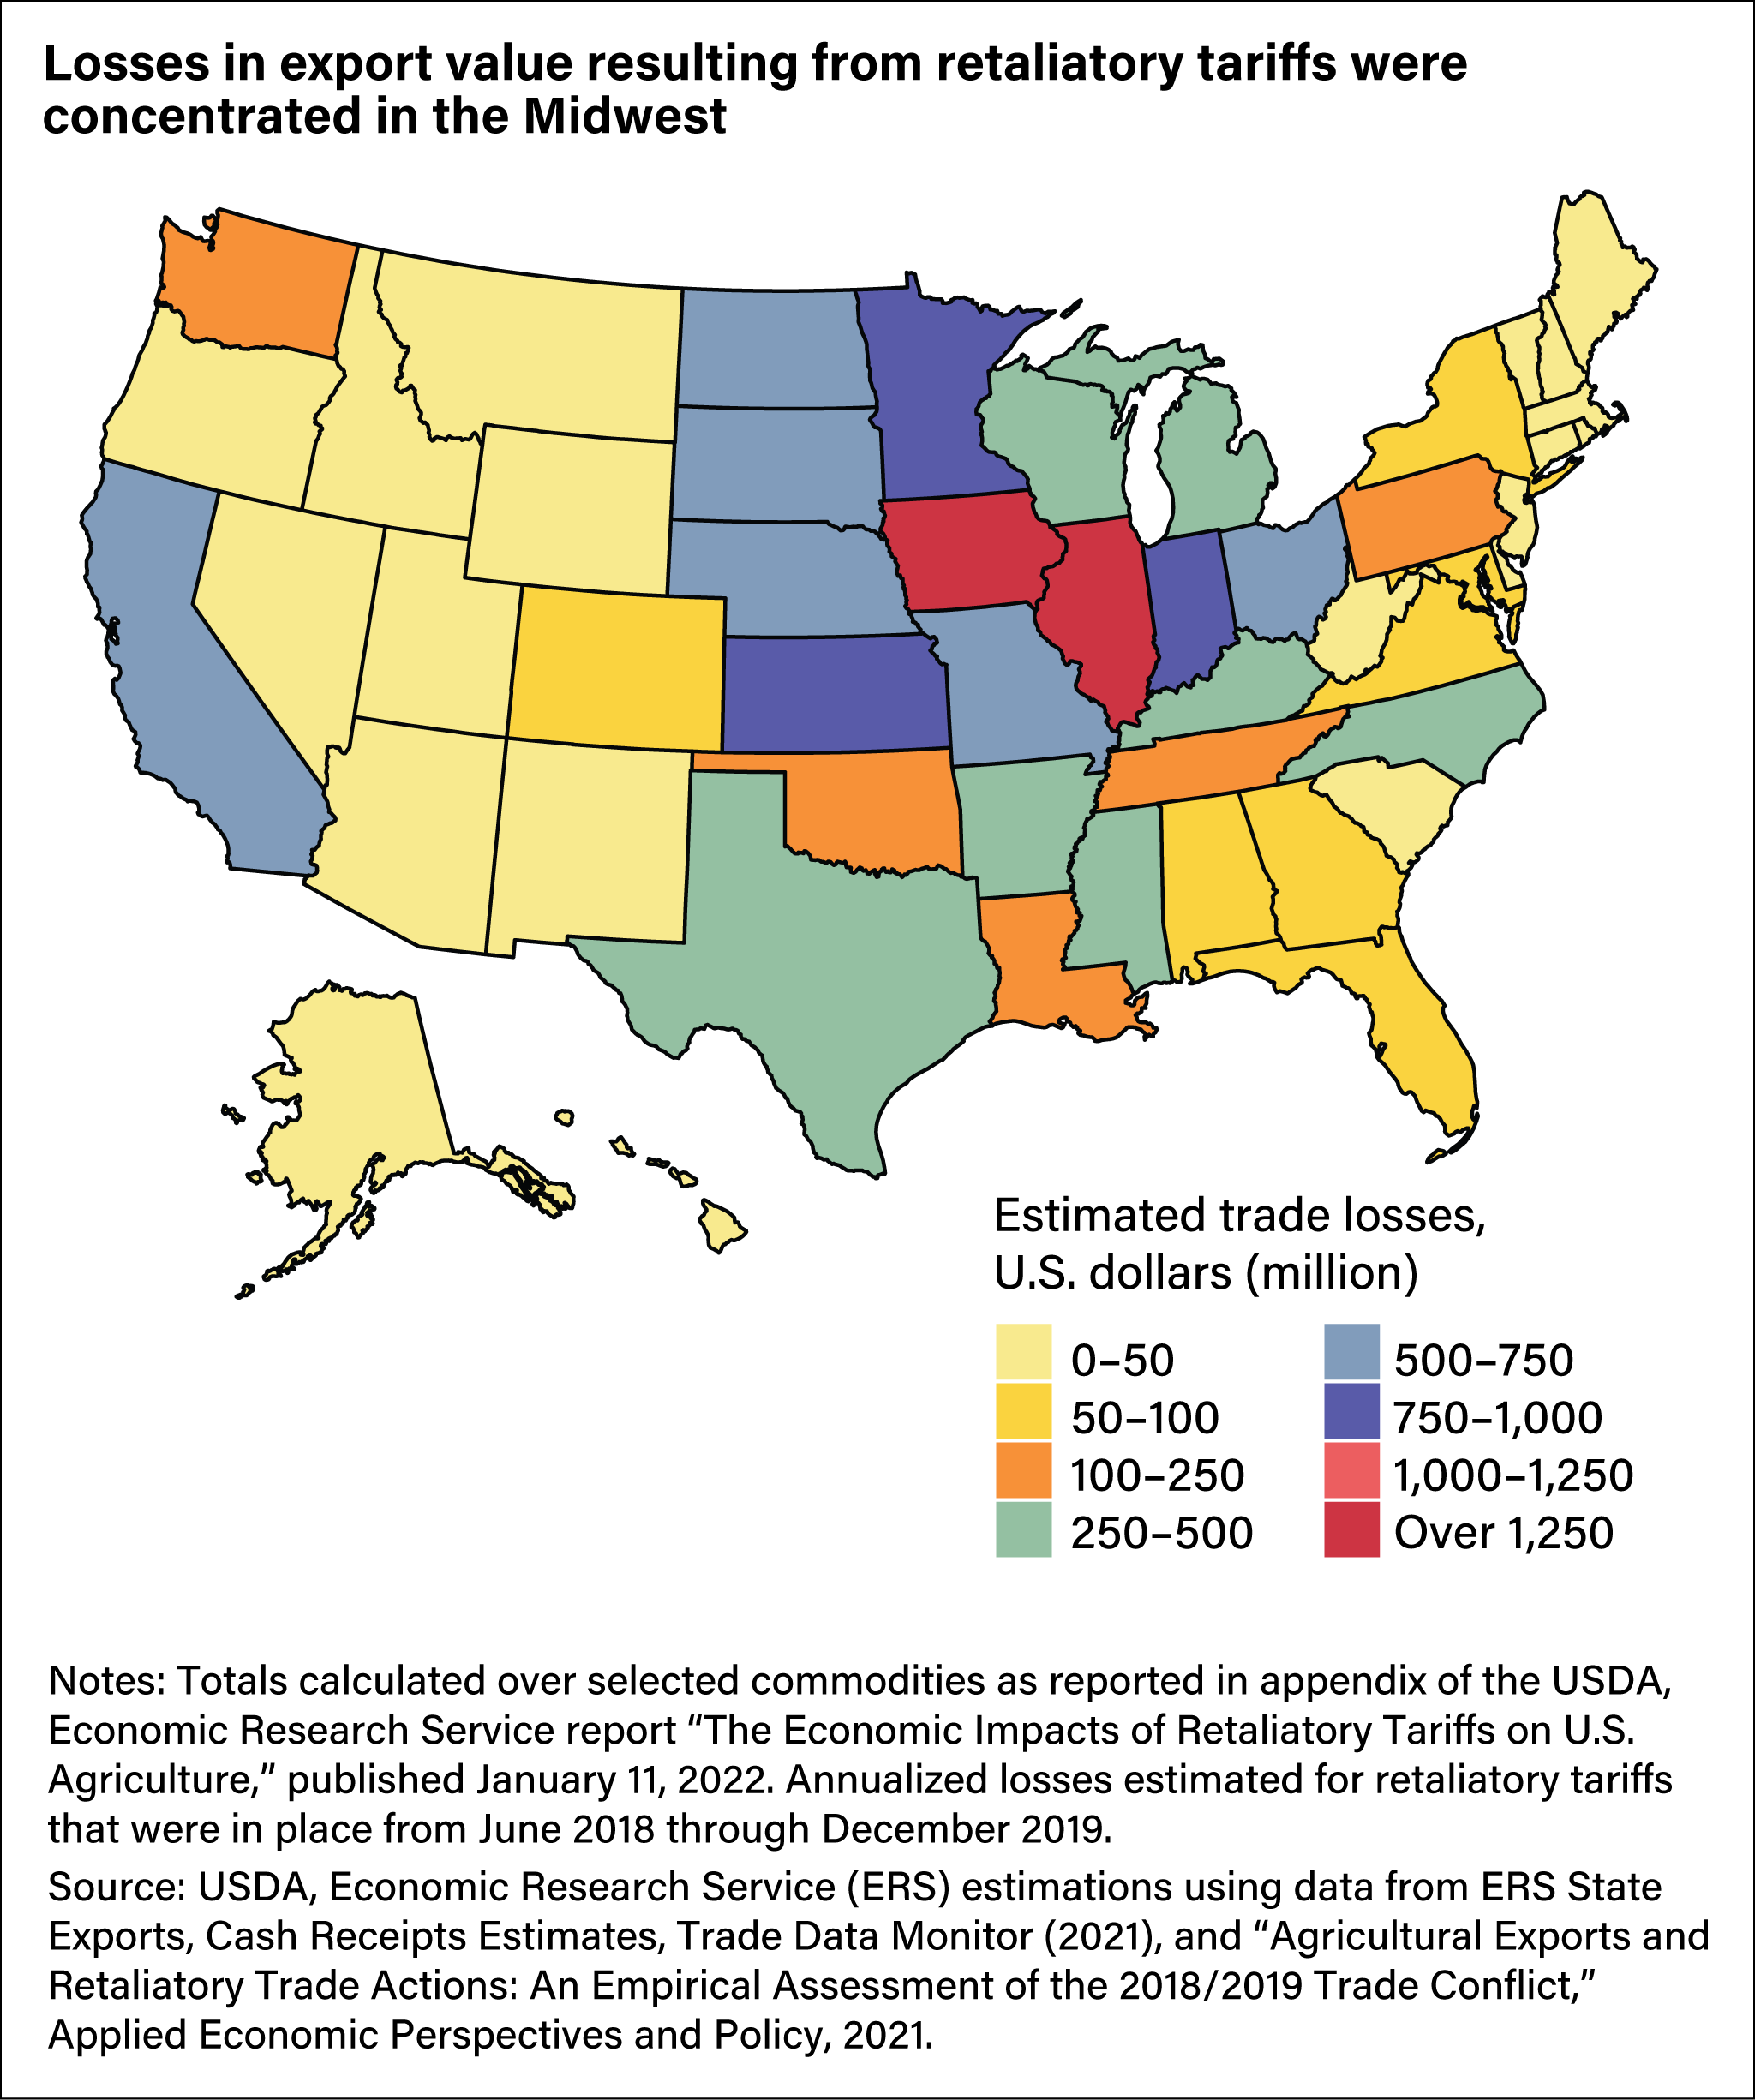
While retaliatory tariffs affected a broad array of agricultural products across the country, the share of losses for individual States from mid-2018 through 2019 varied based on the geographic distribution of commodity production (see figure below). Losses were largely concentrated in the Midwest with Iowa, Illinois, and Kansas incurring annualized losses of $1.46 billion, $1.41 billion, and $955 million, respectively.
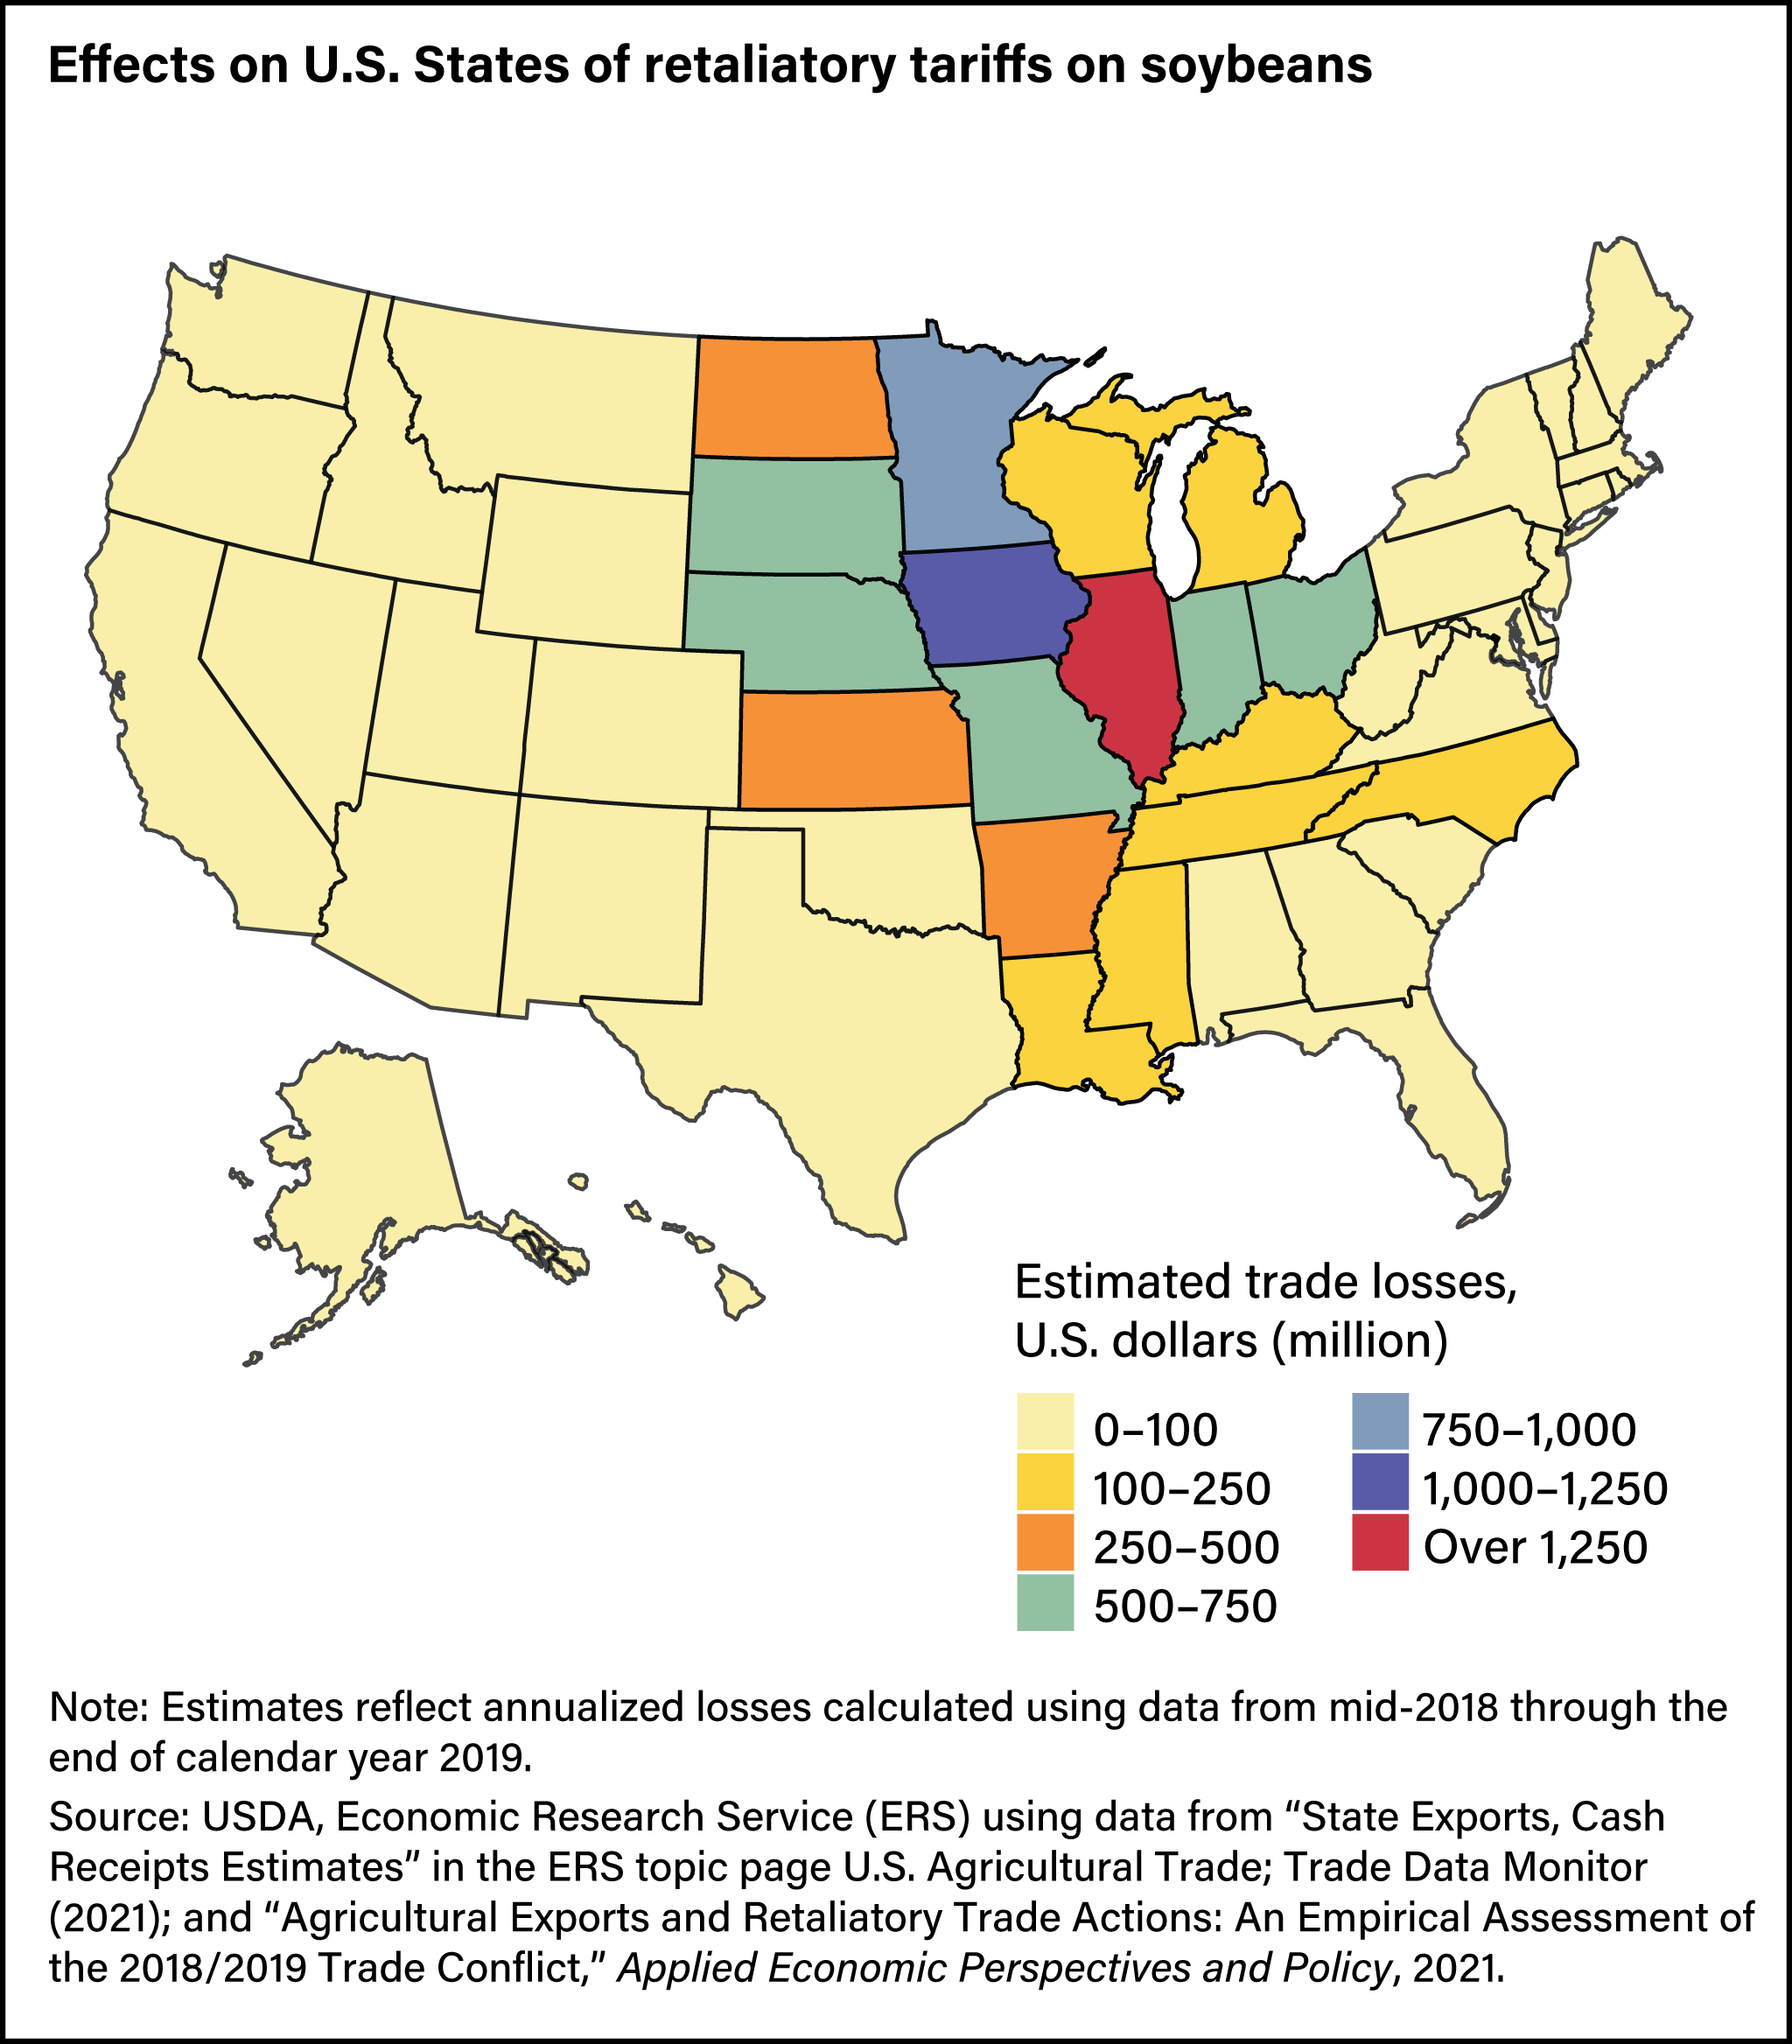
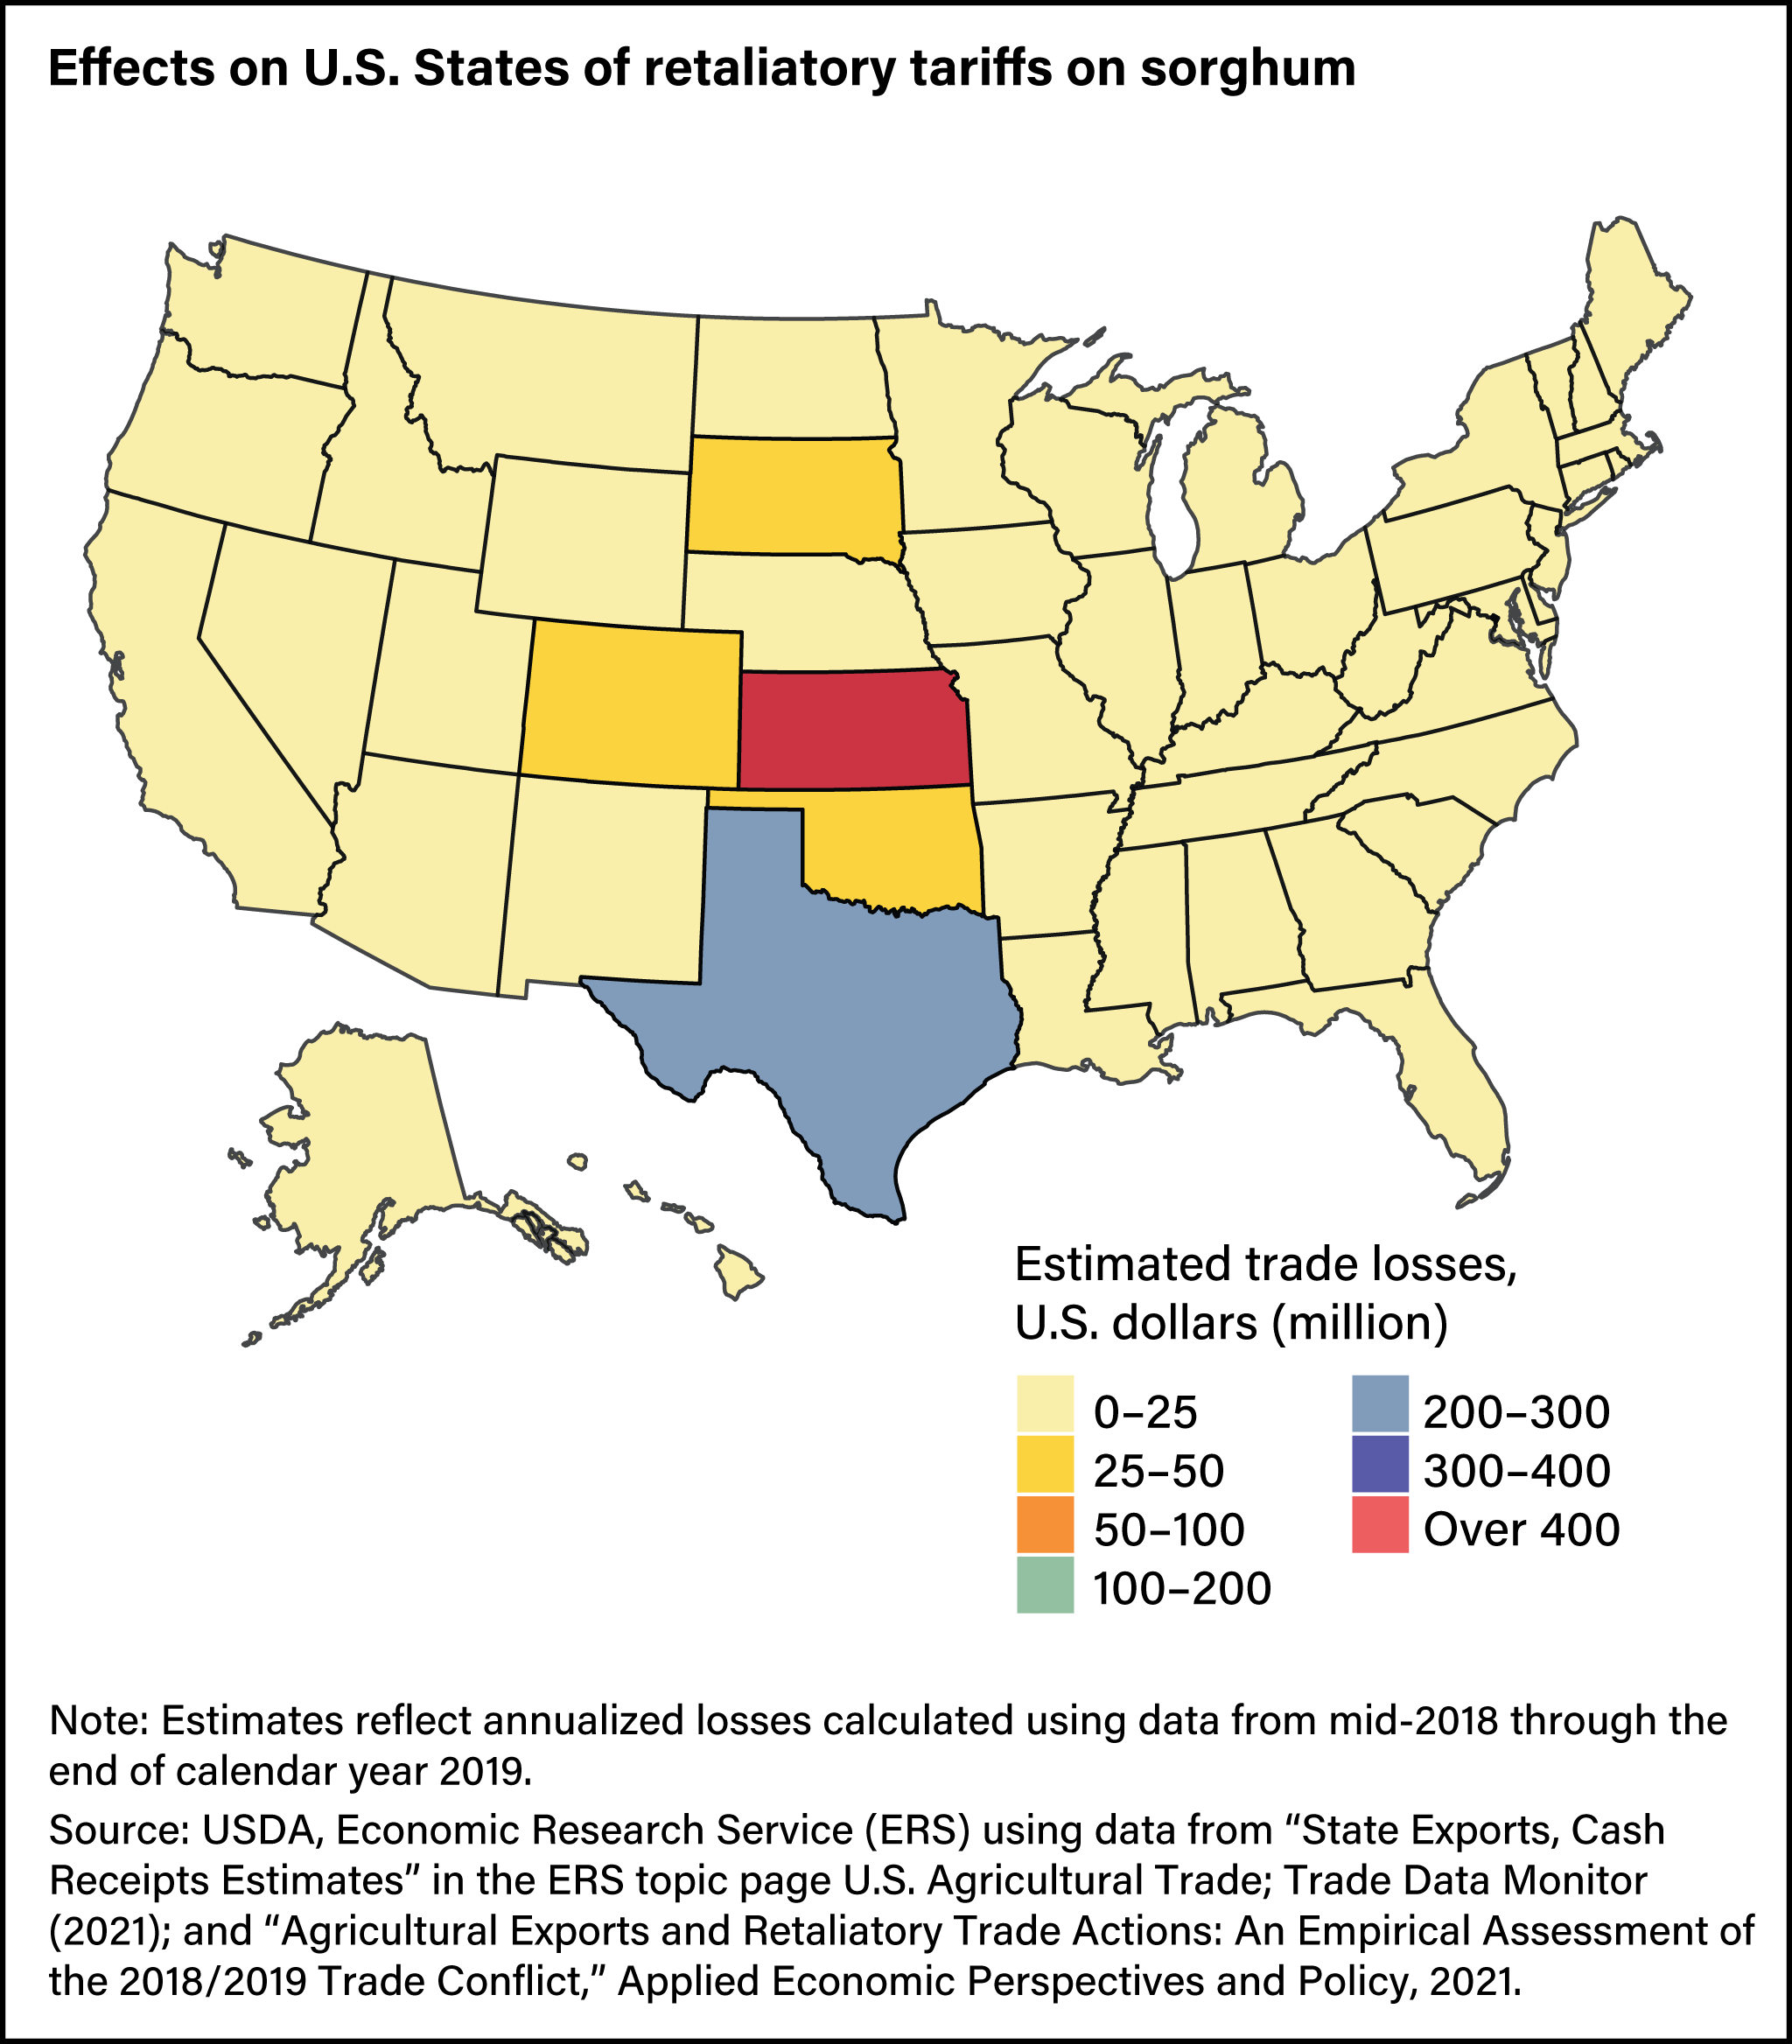
ERS researchers analyzed the geographic distribution of estimated tariff losses by commodity to indicate how much different States were affected by losses. The maps below illustrate the distribution of losses for the two most affected commodities: soybeans and sorghum. Soybean losses were distributed across the Midwest with losses in Illinois and Iowa valued at $1.3 billion and $1.2 billion, respectively. Retaliatory tariffs on sorghum had a large impact on Kansas ($478 million) and Texas ($244 million). For processed fruits, California ($257 million) and Washington ($70 million) experienced the largest share of losses. Losses associated with retaliatory tariffs on tobacco were concentrated in North Carolina ($81 million) and Kentucky ($40 million).
Retaliatory tariffs on U.S. agricultural exports are costly for U.S. States and ultimately affect the revenue that U.S. farmers receive. ERS researchers estimated $13.2 billion in revenues lost annually from 2018–19, with most losses felt by producers in the Midwest and by soybean producers. However, many retaliatory tariffs are still in place and continue to affect U.S. producers. Continued analysis is needed to assess the total costs of retaliatory tariffs to U.S. producers over time.
This article is drawn from:
- Morgan, S., Arita, S., Beckman, J., Ahsan, S., Russell, D., Jarrell, P. & Kenner, B. (2022). The Economic Impacts of Retaliatory Tariffs on U.S. Agriculture. U.S. Department of Agriculture, Economic Research Service. ERR-304.
You may also like:
- State Agricultural Trade Data. (n.d.). U.S. Department of Agriculture, Economic Research Service.
- Beckman, J., Dyck, J. & Heerman, K.E.R. (2017). The Global Landscape of Agricultural Trade, 1995-2014. U.S. Department of Agriculture, Economic Research Service. EIB-181.
- Beckman, J. (2021). Reforming Market Access in Agricultural Trade: Tariff Removal and the Trade Facilitation Agreement. U.S. Department of Agriculture, Economic Research Service. ERR-280.