
USDA’s New Interactive Visualization Tool Aids Exploration of Global Agricultural Trends
- by Adam Gerval
- 7/19/2022
USDA, Economic Research Service (ERS) has developed a new tool to help explore trends in global agriculture from an array of international data. The tool, the International Baseline Visualization, is available on the ERS website. It provides users with access to data for 44 exporting and importing countries and regions in conjunction with USDA’s agricultural commodity and macroeconomic models. The tool includes data for aggregated regional models for which USDA regularly reports, such as “Other Europe” and “Other South America.” The tool not only contains international data, but it also houses domestic data for the United States. Historical and projected data for production, consumption, and trade are available through a custom data query function that allows users to download data by commodity, continent, and region or country.
The visualization will be updated annually in tandem with the USDA’s 10-year international agricultural projections. That data, known as the international baseline dataset, is released in May each year and delivers projections based on recent and historical trends in global agriculture. The visualization includes macroeconomic information on population and Gross Domestic Product (GDP) growth, both of which are key to determining USDA’s long-term projections. These macro-variables inform the USDA’s annual updates to the baseline projections in a variety of ways. Population is the basis for determining basic supply and demand volumes, while GDP growth influences the evolution of dietary habits in each market.
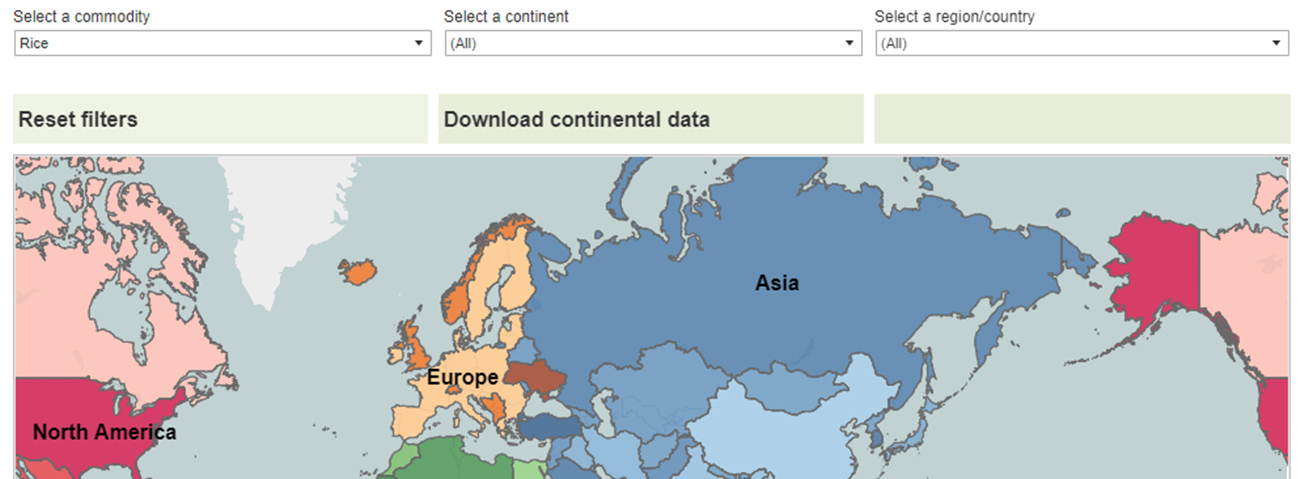
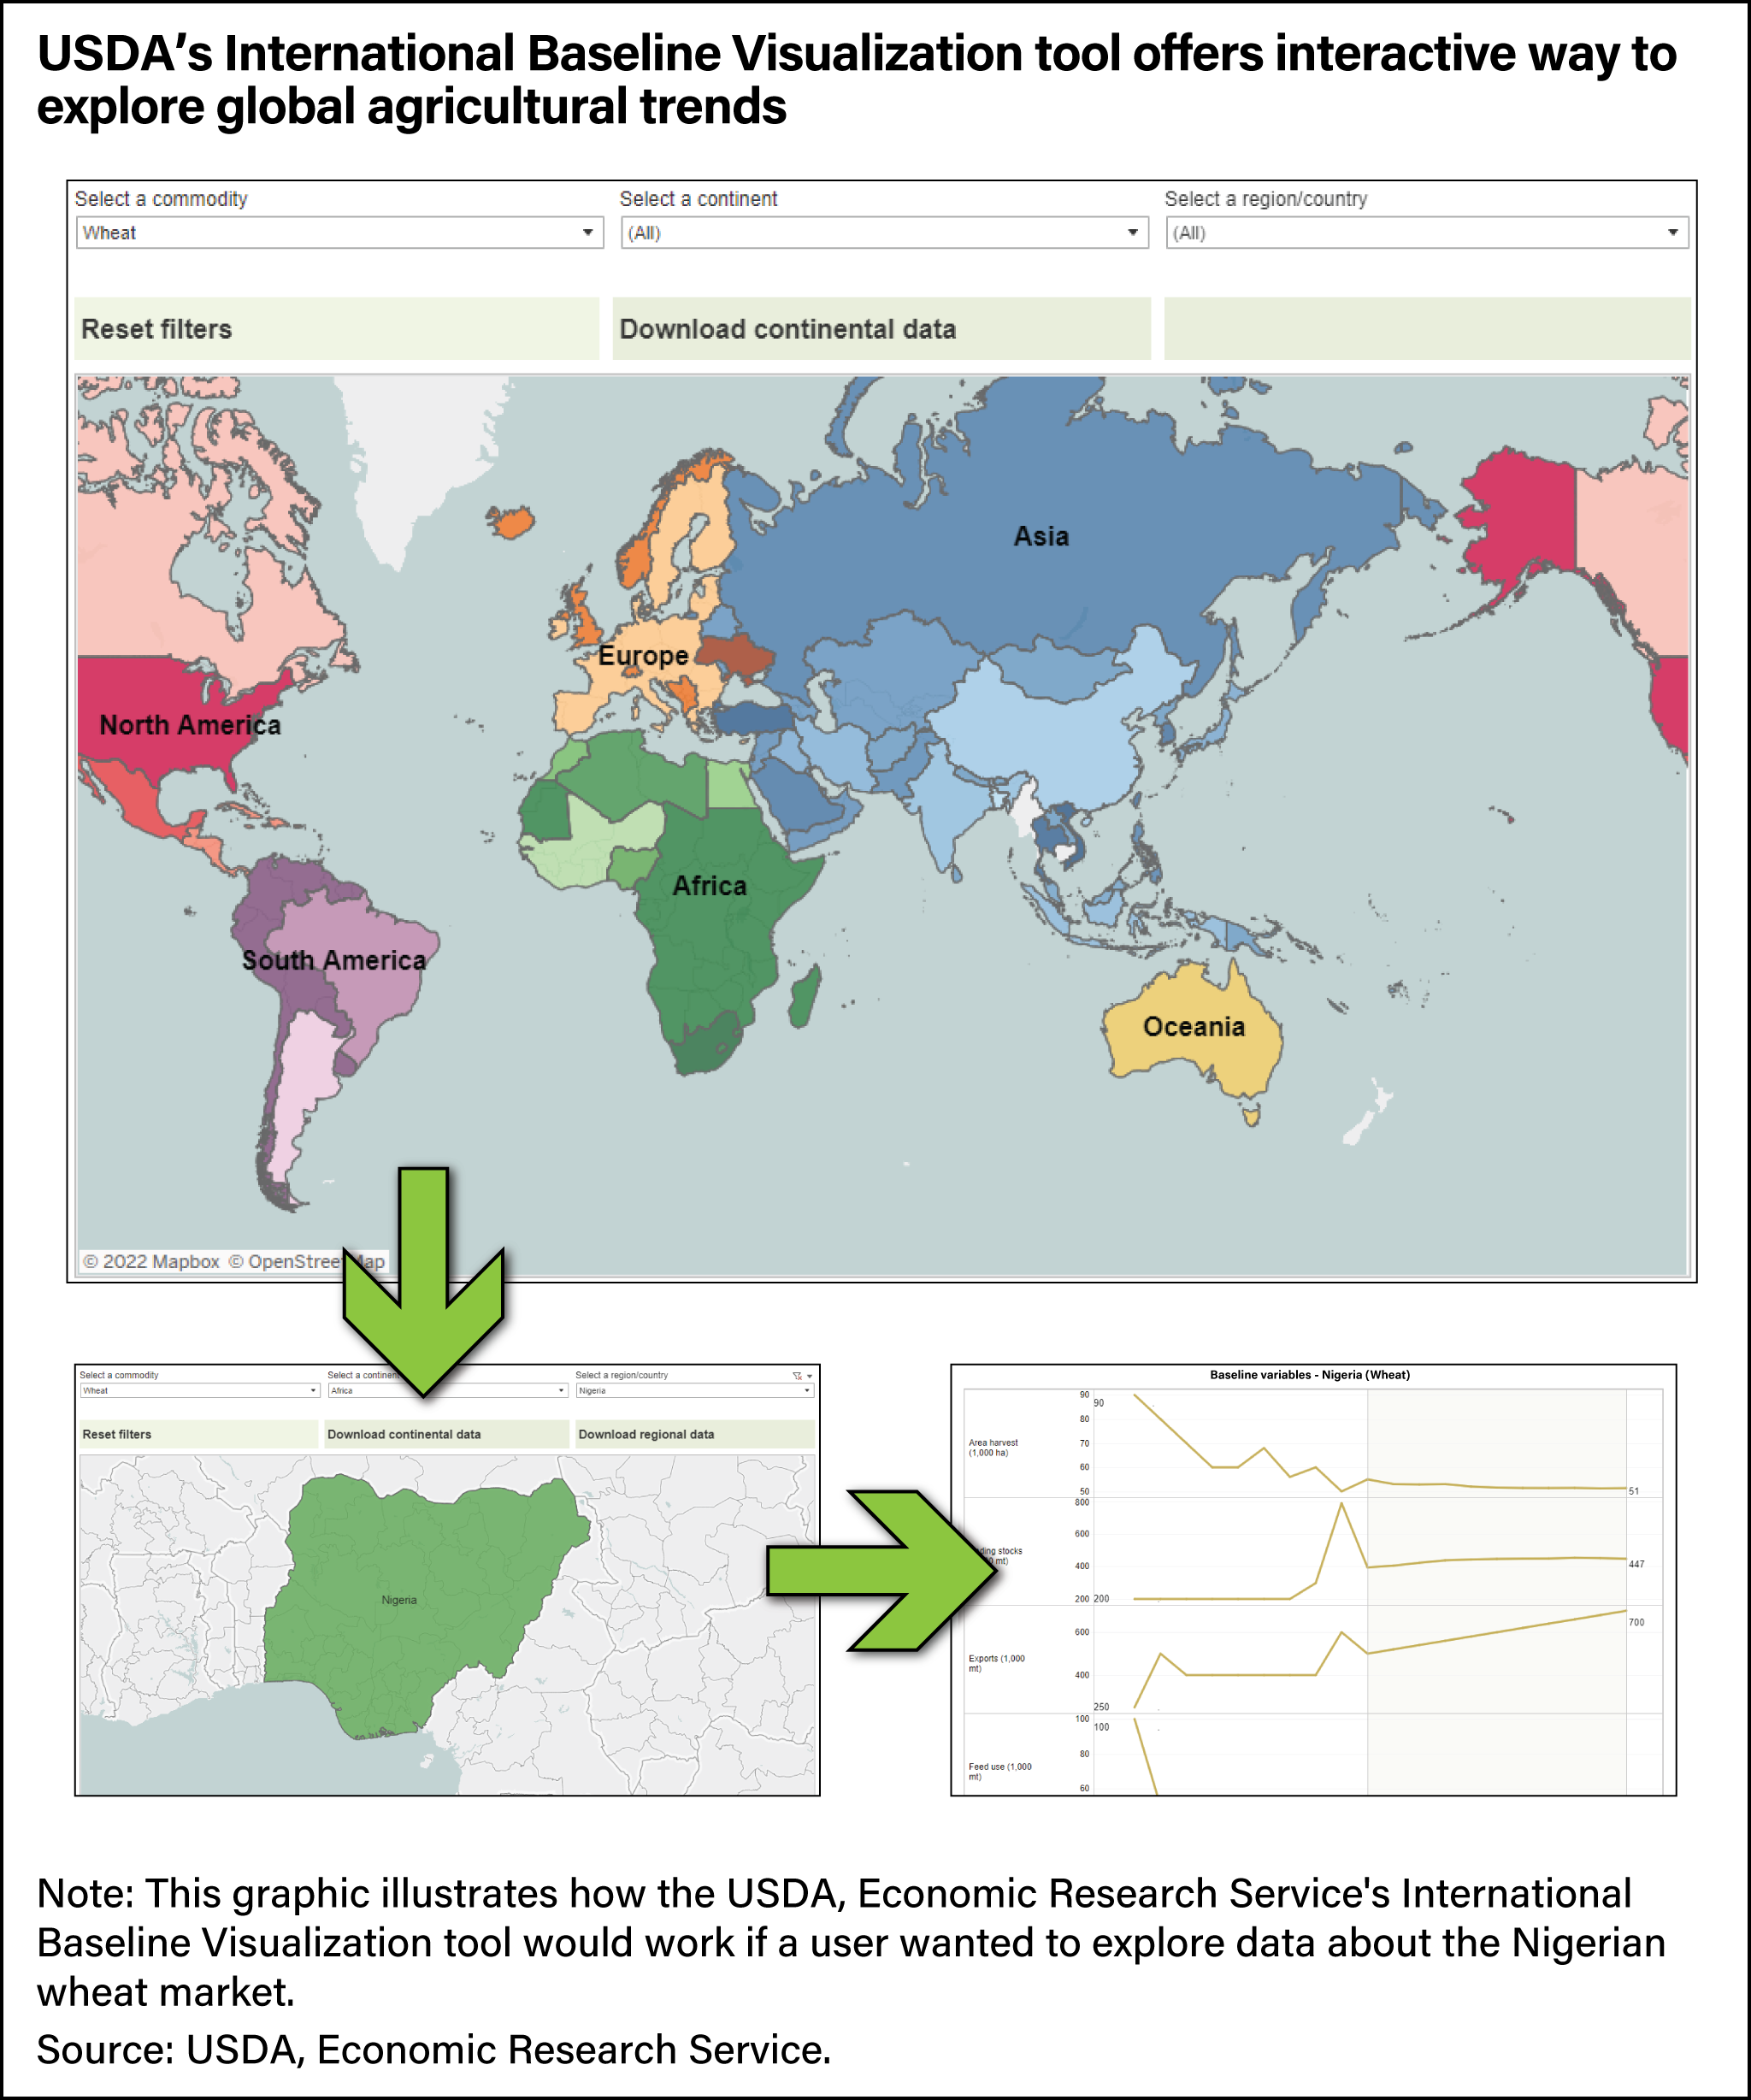
The visualization features a map of the world representing each region and country covered by the international baseline. Three drop-down menus serve as the primary controls of the visualization: “Select a commodity,” “Select a continent,” and “Select a region/country.” When a user selects a country or region, a map of that area pops up, as well as charts showing baseline data (historical and projected), population, and GDP growth. So, if users are interested in variables regarding wheat in Africa, for example, they would select Africa and wheat from the drop-down menus. The visualization will retrieve and chart all relevant data for wheat by model. Users can then select any of the region or country groups in Africa (such as Nigeria, Morocco, or Other North Africa), and the three panels will automatically populate with that data. If users are interested in only one country or region, they can select from the “region/country” drop-down menu, and the visualization will populate with the appropriate data for that specific selection. With numerous options available to users, the International Baseline Visualization aims to provide flexibility to explore a wide array of international agricultural data that ERS publishes.
This article is drawn from:
- International Baseline Data - Visualization: International Baseline Projections. (n.d.). U.S. Department of Agriculture, Economic Research Service.
You may also like:
- International Macroeconomic Data Set. (n.d.). U.S. Department of Agriculture, Economic Research Service.
- International Baseline Data. (n.d.). U.S. Department of Agriculture, Economic Research Service.
- Dohlman, E., Hansen, J. & Boussios, D. (2022). USDA Agricultural Projections to 2031. U.S. Department of Agriculture, Economic Research Service. OCE-2022-01.