

Spending Gap Between Full-Service and Quick-Service Restaurants Widened During Coronavirus (COVID-19) Pandemic
- by Keenan Marchesi
- 4/4/2022
The Coronavirus (COVID-19) pandemic sparked an unprecedented shift in the way U.S. consumers spent money on food, particularly at restaurants and other food-away-from-home (FAFH) establishments. To document changes in consumer FAFH spending, researchers from the USDA, Economic Research Service (ERS) recently worked with proprietary data from a market research organization that were collected before and throughout the pandemic.
Specifically, ERS researchers used The NPD Group’s Consumer Reported Eating Share Trends (CREST), which provide national estimates of dollars spent at restaurants and other FAFH retailers. In an online survey, consumers reported how much they spent at various outlets and the total spent (including tax but excluding tips) on meals, snacks, or beverages. NPD used these individual-level surveys to generate nationally representative projections of consumer expenditures on a rolling 3-month basis to better understand overall trends. Using a rolling 3-month basis also means the timing of spending patterns lags what might have been expected in a given month.
ERS researchers found that while restaurant spending dropped after the onset of the pandemic for all FAFH establishments, the reduction in sales was more pronounced for full-service restaurants than for quick-service restaurants. Quick-service establishments typically specialize in a particular type of food such as hamburgers, pizza, or chicken. At quick-service restaurants, customers usually order and pay at a counter or drive-thru before eating their food. Full-service restaurants typically offer table service and include three categories of establishments: fine dining, casual dining, and midscale. These categories vary according to how much an average meal costs, the size and scope of bar selections, and whether reservations are accepted.
Just before the pandemic (December 2019 to February 2020), consumer spending at quick- and full-service restaurants was near or slightly above where it had been the previous year. Average total dollars spent at quick-service restaurants during this period was $23.2 billion, nearly 5 percent higher than the same period a year earlier. At full-service restaurants, the average amount spent during the same period was $14.1 billion, about the same as the year before. For context, quick-service restaurant spending from December 2019 to February 2020 made up about 62 percent of total restaurant spending, with the remaining 38 percent spent at full-service restaurants.
From March to May 2020, the first 3-month period observed since the pandemic began, average total spending dropped for both restaurant categories. However, there were notable differences. Spending at quick-service restaurants dropped to about $20.1 billion, 15.4 percent lower than average spending from March to May 2019. Full-service restaurants experienced a more severe drop as State and local Governments across the country implemented social distancing mandates that limited in-person dining. During this time, spending at full-service establishments fell to $7.0 billion, almost 52 percent lower than a year earlier.
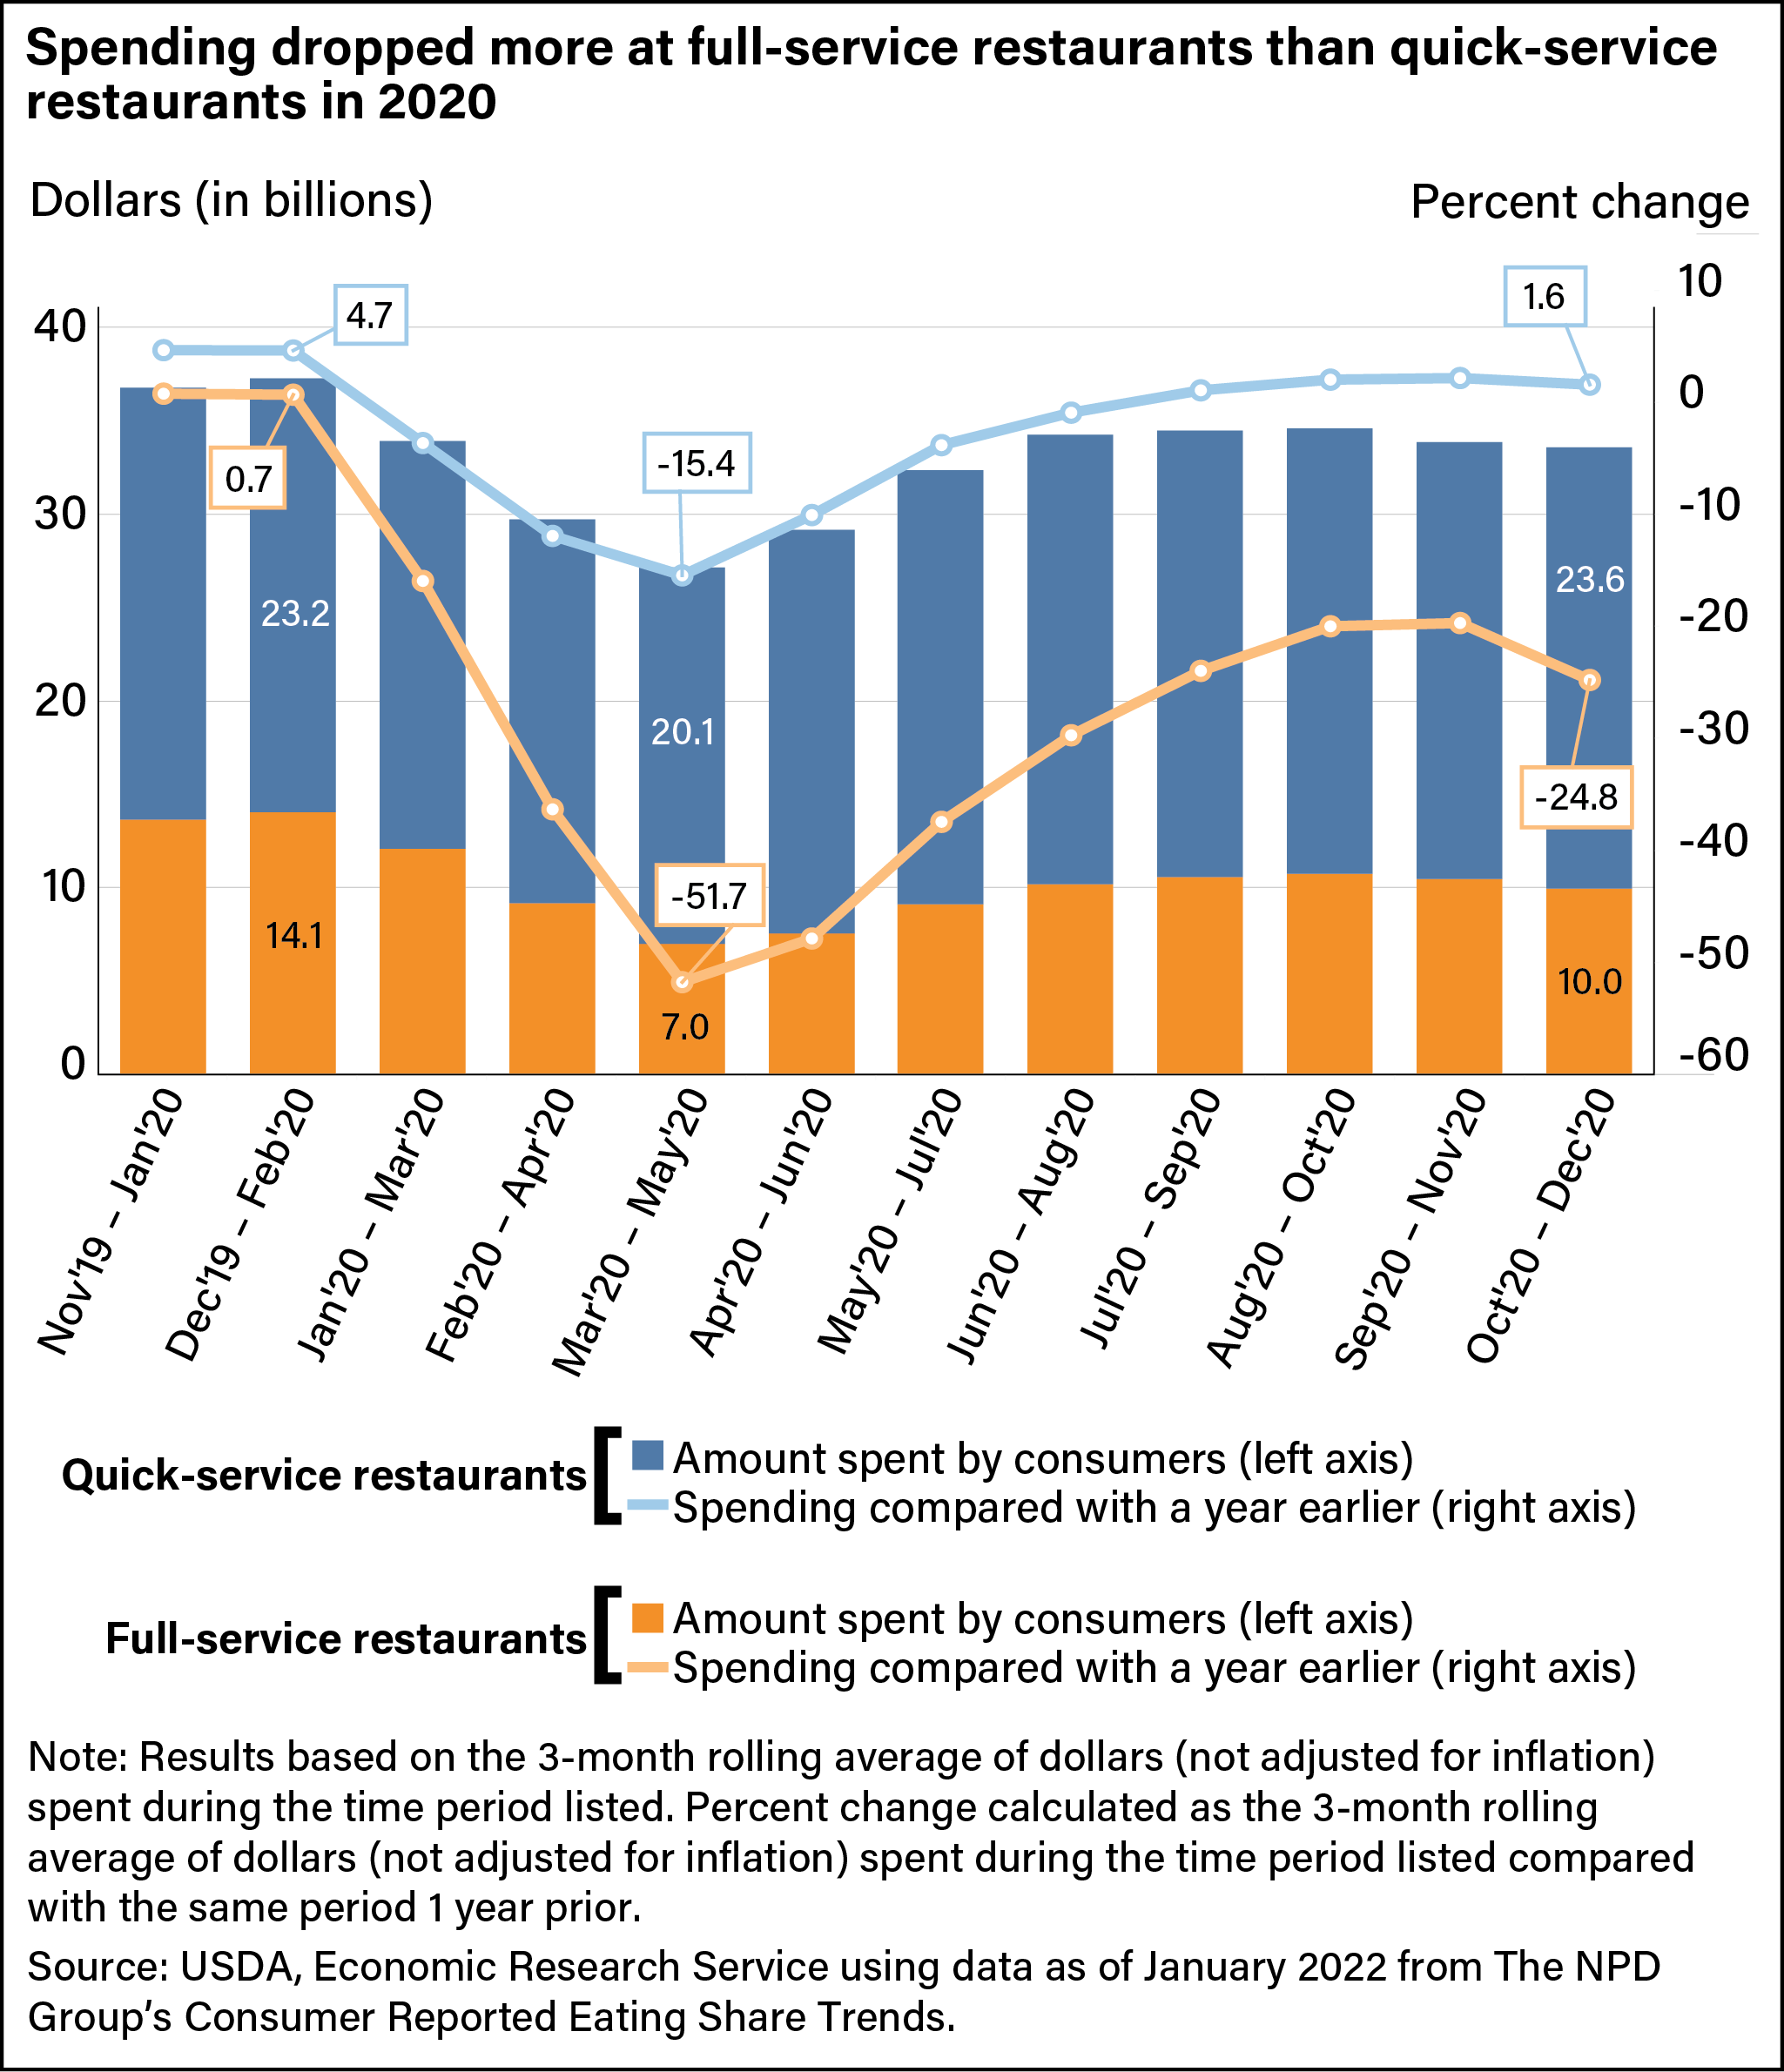
Quick-service restaurants recovered faster than their full-service counterparts in the latter half of 2020. As of July–September 2020 through the end of 2020, spending at quick-service restaurants exceeded that of the same period in 2019. By contrast, as of the end of 2020, spending at full-service restaurants dropped 24.8 percent from the previous year. Quick-service restaurants, such as those with drive-up service, were likely able to adapt more easily to the restrictions of the pandemic than full-service restaurants that previously primarily relied on an in-person customer base.
This article is drawn from:
- Marchesi, K. & McLaughlin, P.W. (2022). COVID-19 Working Paper: The Impact of COVID-19 Pandemic on Food-Away-From-Home Spending. U.S. Department of Agriculture, Economic Research Service. AP-100.
You may also like:
- Food Expenditure Series. (n.d.). U.S. Department of Agriculture, Economic Research Service.