
Innovations in Seed and Farming Technologies Drive Productivity Gains and Costs on Corn Farms
- by Anne Effland, Monica Saavoss, Thomas Capehart, William D. McBride and Amy Boline
- 4/4/2022
Highlights
- Corn yields and planted acres have risen substantially in recent decades as farmers have adopted new technologies, particularly genetically engineered seeds and precision farming systems, that have supported higher yields and expansion into new areas.
- The cost of genetically engineered seed and related increases in costs for fertilizers and herbicides contributed to operating costs per acre of corn more than doubling between 1996 and 2016. However, average total costs per bushel and per acre of corn fell, reflecting the effects of larger farm sizes and greater productivity.
- Characteristics of high-productivity and low-productivity corn farms reflect the effects of farm size and differing natural endowments, and also show regional concentrations.
Corn is a major source of livestock feed, fuel, exports, and derivative products such as starch and sweeteners, as well as paper and bioproducts like plastics and cosmetics. To supply this broad and growing market over the past several decades, U.S. corn production has expanded. Since 1996, the area of corn planted in the United States has risen more than 10 percent, with increases reaching as high as 40 percent in the Northern Great Plains region (see map below). At the same time, average corn yields have increased more than 40 percent. A USDA, Economic Research Service (ERS) report published in July 2021 identified and examined technological and structural changes in U.S. corn production since 1996, focusing on how these changes have affected production costs, net returns, productivity, and yields. To track these trends in corn production, researchers used data covering 1996 to 2016 from the Agricultural Resource Management Survey (ARMS), produced by ERS and USDA’s National Agricultural Statistics Service (NASS), and the NASS Census of Agriculture.

New Seed Technologies Help Increase Corn Acreage and Yields
An analysis of responses to the ARMS survey of corn farms from 1996 to 2016 indicated new and expanded technologies over the two decades factored into acreage and yield changes. In particular, adoption of genetically engineered seed varieties progressed rapidly. For example, plantings of single-pest resistant varieties containing proteins from Bacillus thuringiensis (Bt), a bacterial insecticide, rose from 2 percent of corn acres in 1996 to 21 percent in 2001 and to 78 percent by 2016. Similarly, herbicide-tolerant varieties appeared on 3 percent of acres in 1996 and expanded to 16 percent in 2001 and 84 percent in 2016. In 2016, producers planted 91 percent of corn acres with some form of genetically engineered seed, many of them “stacked” varieties offering three or more protective traits such as resistance to multiple pests, herbicide tolerance, and drought tolerance.
New seed technologies helped increase corn production in several ways. Farmers were able to plant corn seed more densely and earlier in the growing season. In addition, producers expanded corn acreage as pest resistance and drought tolerance allowed for profitable production in previously challenging regions. Genetically engineered seeds led to changes in other production practices as well. For example, increased use of drought-tolerant seed has coincided with a slight decline in irrigated acreage, and greater use of insect-resistant seed with changes in chemical applications.

Precision Farming Technologies Increase Efficiency
“Precision farming” refers to technologies that allow producers to make operating decisions on a site-specific basis, tailoring their methods according to conditions within and between fields. For instance, yield monitors track how much corn is harvested from specific zones in each field. Farmers put this information into a yield map, which visualizes the data from the monitor and lets them address issues such as poor drainage or low nutrient levels in low-yield areas of the field. Soil maps provide site-specific information about soil type and soil quality. Variable-rate technology allows farmers to apply the appropriate amount of seed, fertilizer, or pesticides for a particular site. Guidance systems use GPS technologies to provide tractor operators with visual directions toward rows, or in some instances, automatically steer the tractor to drive directly over rows. This can reduce the number of passes required over the field, reducing fuel costs and wear and tear on machinery.
Adoption of precision production technologies by corn producers has steadily increased over the past few decades. From 2001 to 2016, the use of yield monitors increased from 19 percent of corn acres to 52 percent and the use of yield maps from 6 percent to 31 percent. Use of self-propelled machinery with guidance systems rose from 3 percent of corn acres to 39 percent. Variable-rate fertilizer application grew from 6 to 19 percent, variable-rate seeding from less than 1 to 15 percent, and variable-rate pesticide application from 1 to 7 percent. ERS and NASS added questions on the use of newer technologies such as drones and crop condition sensors to the 2016 ARMS survey; data indicated use of these technologies was limited to 1 to 4 percent of corn acres.

As the use of emerging technologies grew, irrigated corn acres as a share of total corn acres declined slightly. In 1996, 15 percent of U.S. corn acres were irrigated. By 2016, that share had fallen to 11 percent, although that national shift obscures significant regional differences. In the Prairie Gateway, irrigated acreage dropped to 39 percent of corn acres in 2016 from 77 percent 20 years earlier. In the Northern Great Plains regions, the share of irrigated corn acreage fell to 10 percent from 39 percent. In both cases, increasing costs of pumping irrigation water from the depleting Ogallala Aquifer were cited as a contributing factor. In addition, the adoption of drought-tolerant seed varieties reduced the need for irrigation. In contrast, irrigated corn acres increased in the Southern Seaboard region—from none in 1996 to 21 percent in 2001, then falling to 13 percent in 2005 and rising to 18 percent by 2016. Contributing factors to the differences in regional irrigation use include repeated drought conditions, relatively low-cost groundwater access, and rising commodity prices.
New Seed Varieties Lead to Changes in Chemical Applications and Costs Per Corn Acre
Along with the adoption of new genetically engineered corn seed varieties, seeding rates increased about 15 percent between 1996 and 2016. Nutrient application rates also changed. For example, the share of corn acres treated with nitrogen fertilizer was stable (around 95 percent), but the average amount applied per acre rose from 107 to 125 pounds. In contrast, phosphorus and potassium applications declined between 1996 and 2016, from 86 to 76 percent of acres for phosphorus and 80 to 70 percent for potassium. Applications of herbicides and insecticides fluctuated, with herbicide use rising alongside adoption of herbicide-tolerant seed varieties. Insecticide use fell as farmers used more insect-resistant seed varieties. In addition, from 2005 to 2016, the use of conservation tillage practices increased slightly from 60 to 65 percent. These practices reduce tillage costs while conserving soil and water.
Adoption of new seed technologies and the related rise in fertilizer and herbicide use increased operating costs on corn farms over the 1996–2016 period. Costs per acre (not adjusted for inflation) more than doubled, from $161 to $341. Average seed costs increased 263 percent on a steady upward trend from $27 per acre to $98, while fertilizer costs rose 149 percent, from $51 per acre to $127. Costs of applying chemicals such as pesticides, growth regulators, and harvest aids grew by 30 percent. Costs per acre varied regionally, from the highest in 2016 of $712 in the Heartland to $565 in the Northern Great Plains.

Farm Sizes Grow Along With Productivity
Just as total average acreage planted to corn rose over recent decades, so also did the size of farms that planted corn. Based on data from the Census of Agriculture, the average acreage of farms planting corn increased 45 percent, from 501 acres in 1997 to 725 acres in 2017. According to data from the ARMS, average acres devoted to corn on those farms also rose by a similar proportion, from 189 acres in 1996 to 278 acres in 2016, with much of the expansion occurring between 1996 and 2010. The number of acres planted to corn generally plateaued after 2010, with regional variation. In the Heartland, average acreage planted to corn fell slightly (313 to 302 acres), while average corn planted area grew by more than 50 percent in the Northern Great Plains and Eastern Uplands.
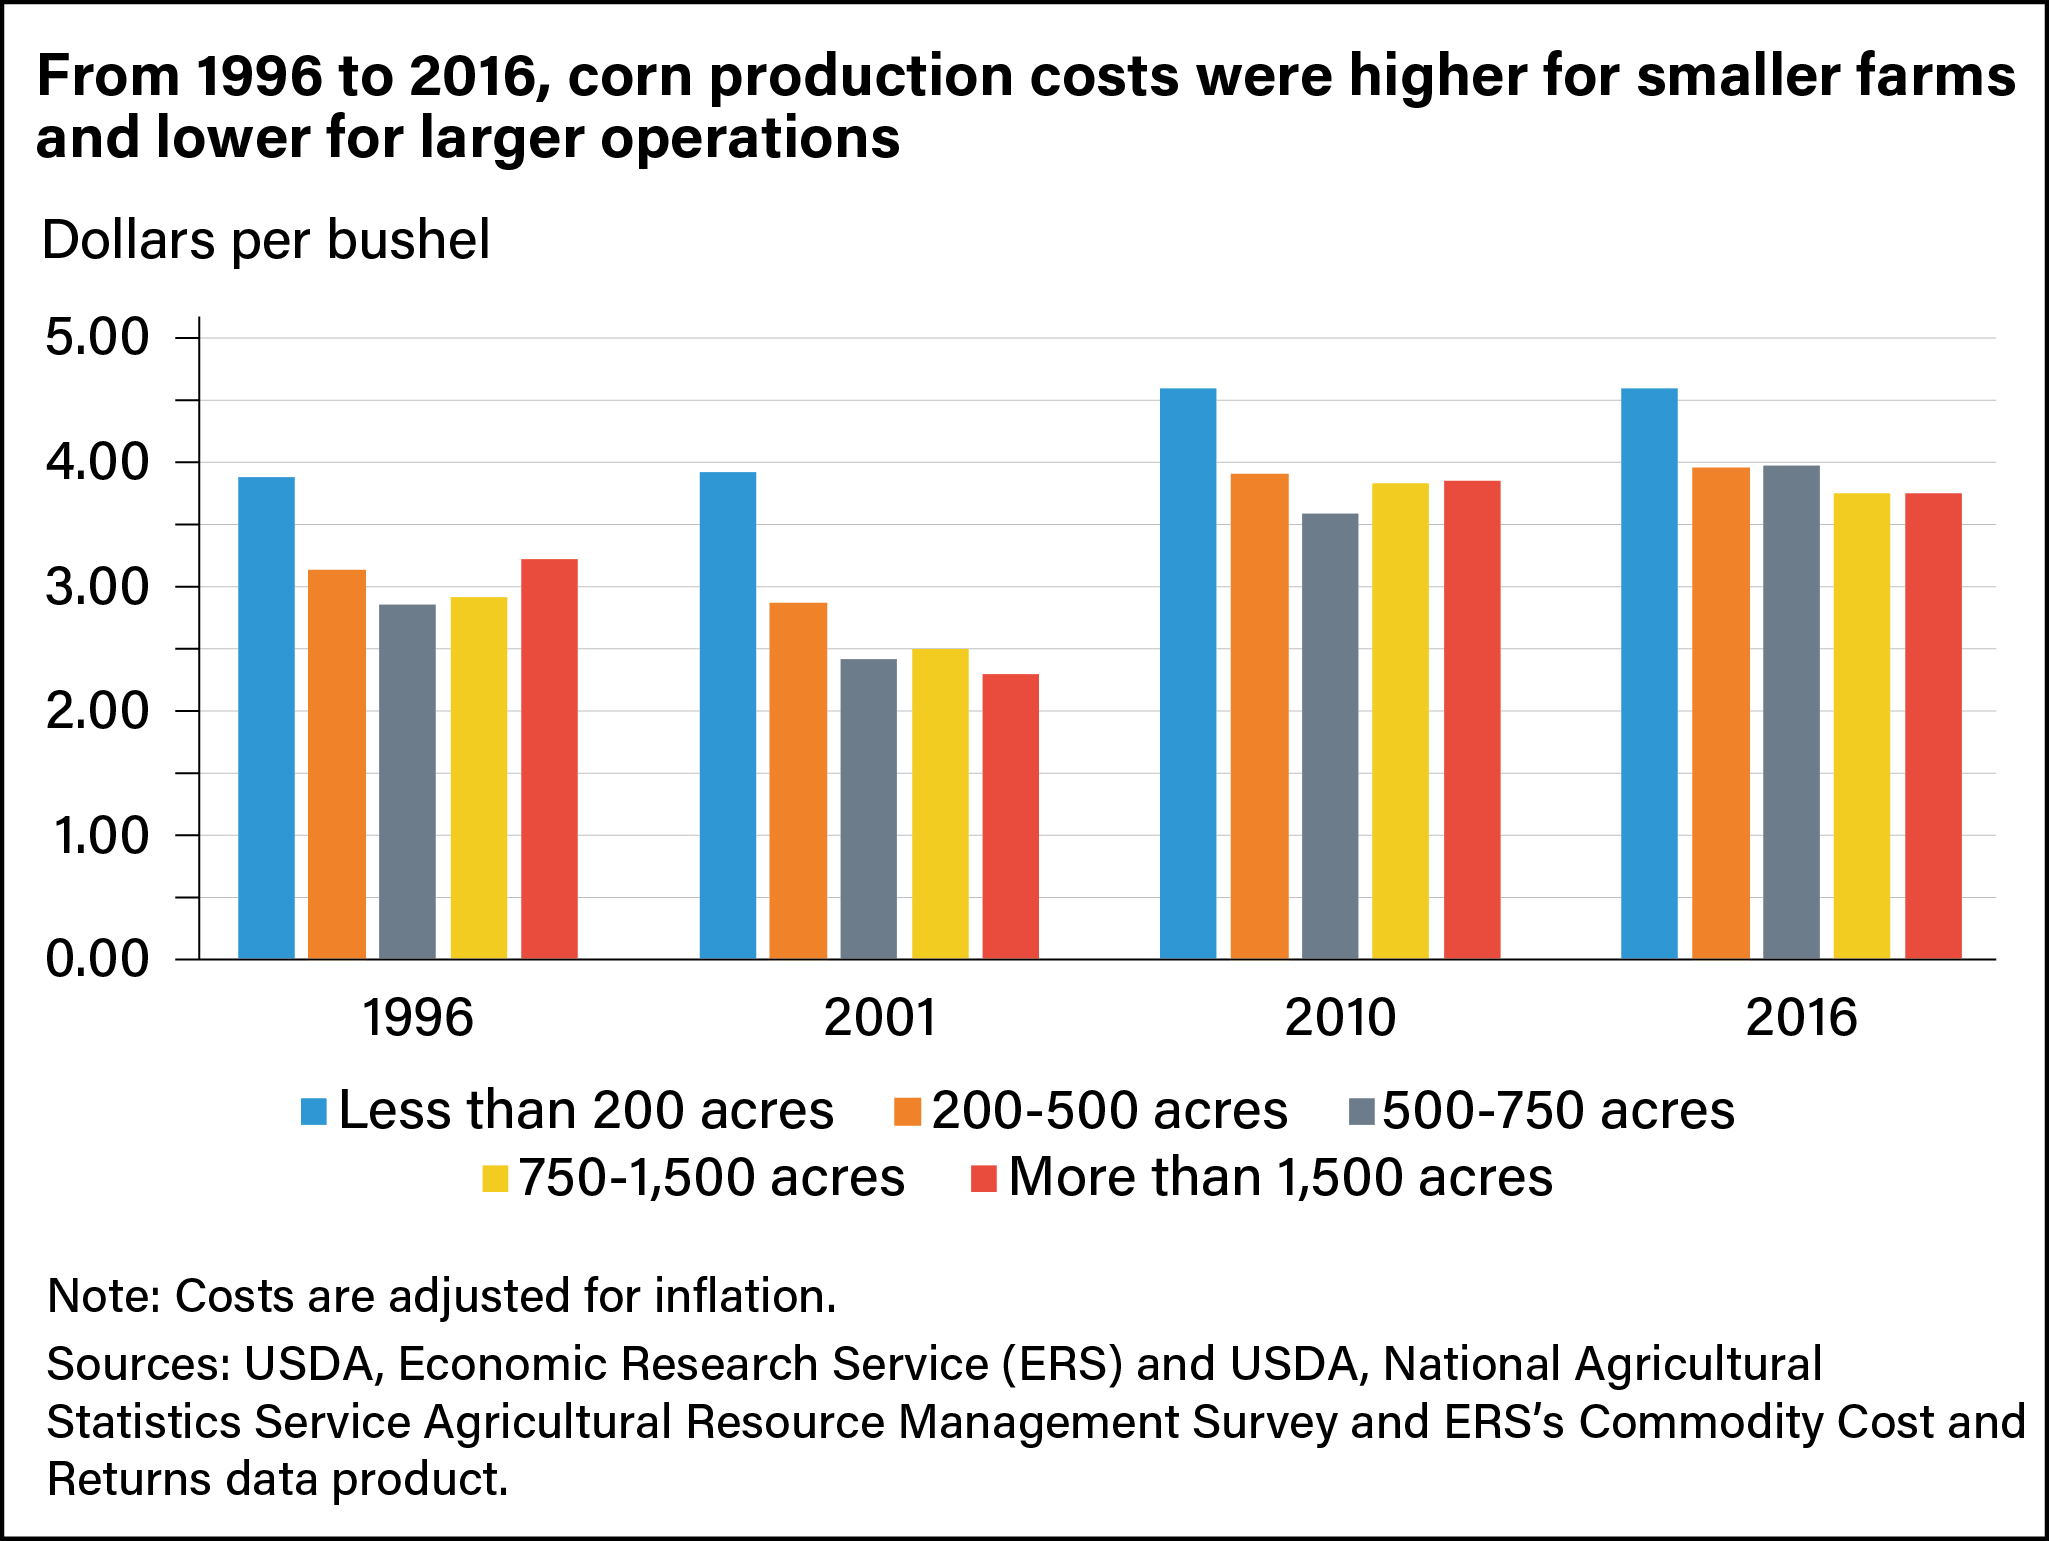
Productivity on corn farms also increased between 1996 and 2016. Based on a 5-year moving average, corn yields increased from 130 bushels to 183 bushels per acre over the period, an average annual growth rate of 1.7 percent. Over the same period, inflation-adjusted production costs per bushel, unlike nominal costs per acre, fell from $5.07 to $3.64 per acre in all regions.
Total costs per bushel were higher for smaller farms and declined as farm size increased, ranging from $4.66 per bushel for farms with fewer than 200 planted acres of corn to $3.75 per bushel for farms with more than 1,500 planted acres of corn. This pattern of lower costs per bushel on larger farm sizes, is known as “economies of size,” in which the cost to produce one unit of a commodity declines as the size of operation increases. Other than a spike in 2001 associated with the introduction of genetically engineered seeds on the market, this pattern remained fairly stable from 1996 to 2016.
Corn Farm Productivity Varies by Size and Region
To determine the distinguishing characteristics of high- and low-productivity farms, ERS researchers divided corn farms into four groups (referred to as quartiles) according to their cost per unit:
- Lowest cost, highest productivity (top 25 percent): Average cost was $2.83 per bushel;
- Upper middle (25 percent): Average cost was $3.46 per bushel;
- Lower middle (25 percent): Average cost was $4.04 per bushel; and
- Highest cost, lowest productivity (bottom 25 percent): Average cost was $6.32 per bushel.
Higher productivity farms demonstrated consistently lower operating costs per acre than the next lowest productivity group. Economies of size and variations in natural endowments that might require greater use of some inputs—such as irrigation—both affected operating costs. For example, more farms with lower productivity irrigated their land. Yields tended to be below average for the two lowest productivity farm groups. Productivity also varied across regions. The Heartland accounted for a disproportionately large share of the total acres in the three higher productivity groups (58, 70, and 66 percent) and only 44 percent in the lowest productivity quartile. The Prairie Gateway and Southern Seaboard made up smaller shares of corn acres and together accounted for 34 percent of the lowest productivity group and less than 14 percent of the highest.

This article is drawn from:
- Saavoss, M., Capehart, T., McBride, W.D. & Effland, A. (2021). Trends in Production Practices and Costs of the U.S. Corn Sector. U.S. Department of Agriculture, Economic Research Service. ERR-294.
You may also like:
- Childs, N., Raszap Skorbiansky, S. & McBride, W.D. (2020, May 4). U.S. Rice Production Changed Significantly in the New Millennium, but Remained Profitable. Amber Waves, U.S. Department of Agriculture, Economic Research Service.