

Examining Opportunities for U.S. Agricultural Exports to Colombia
- by Steven Zahniser, Miguel I. Gomez, Sergio Puerto and Jie Li
- 4/20/2022
Highlights
- The 3-year average annual value of U.S. agricultural exports to Colombia grew at a compound annual rate (not adjusted for inflation) of 13.1 percent between 2009–11 and 2018–20, compared with 2.0 percent for U.S. agricultural exports to all other countries.
- Researchers studied the 10 leading U.S. agricultural exports to Colombia from 2009–2018, as well as 5 additional product categories showing fast growth in exports to that country, to get a better sense of where opportunities lie for U.S. suppliers.
- U.S. exports to Colombia of corn, soybeans, and pork grew at a higher annual rate than other products, and the U.S. market share of Colombia’s imports of those products remained high.
Over the past decade, Colombia has distinguished itself as a fast-growing market for U.S. agricultural products. Between 2009–11 and 2018–20, the 3-year, annual average of U.S. agricultural exports to Colombia grew at a compound annual rate of 13.1 percent (not adjusted for inflation), compared with 2.0 percent for U.S. agricultural exports to all other countries, according to U.S. trade statistics collected by the U.S. Department of Commerce, Bureau of the Census, and compiled by USDA’s Foreign Agricultural Service in its Global Agricultural Trade System.
Several factors contributed to this growth. Two decades (2000–19) of economic expansion in Colombia generated greater consumer purchasing power and a larger middle class. In turn, consumption of foods such as chicken, pork, and fresh vegetables increased, and Colombians spent more money on food away from home. This period of economic growth was bolstered by the signing of a peace agreement in 2016 between the Colombian Government and the country’s largest guerrilla group.
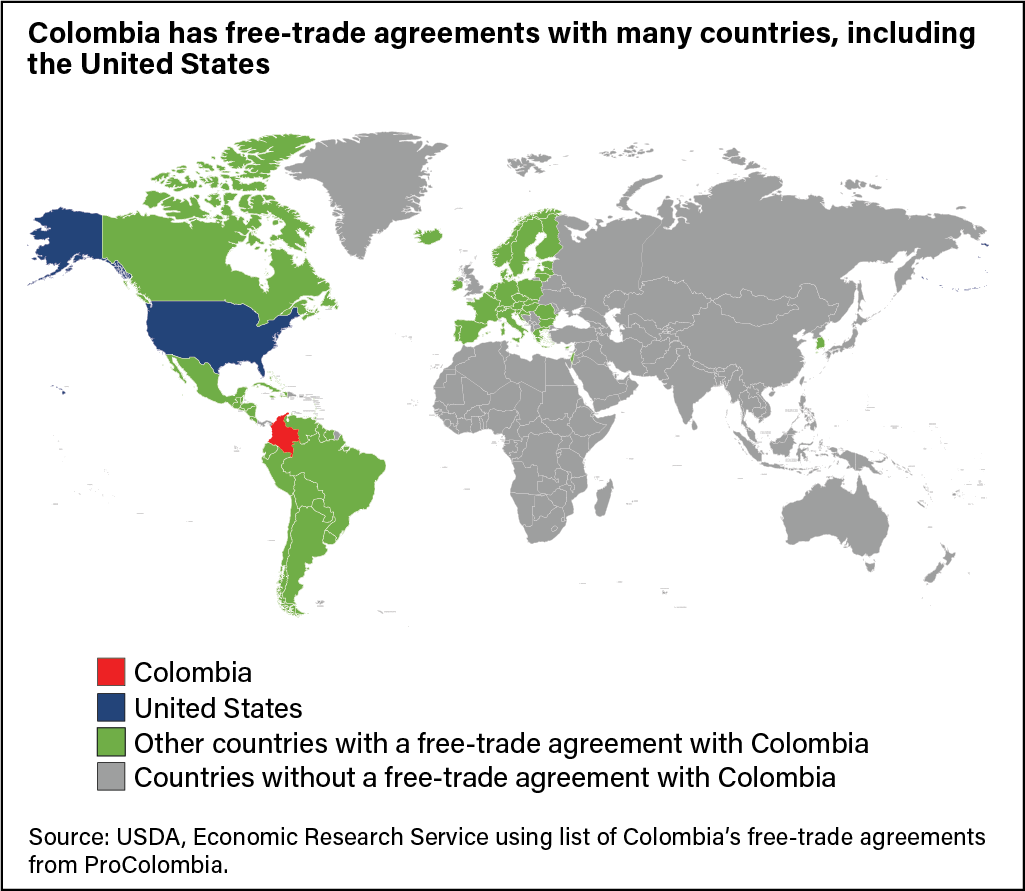
Moreover, the Colombia-U.S. Trade Promotion Agreement (TPA)—a bilateral free-trade agreement (FTA) that took effect on May 15, 2012—gradually broadened Colombia’s access to the full range of U.S. agricultural products as part of the wholesale elimination of almost all the tariffs and quotas that had restricted U.S.-Colombia trade. The United States is one of many countries that have FTAs with Colombia (see map below). Had the United States not obtained an FTA with Colombia, it would have been at a competitive disadvantage with countries that had better access to the Colombian market through their FTAs with Colombia.
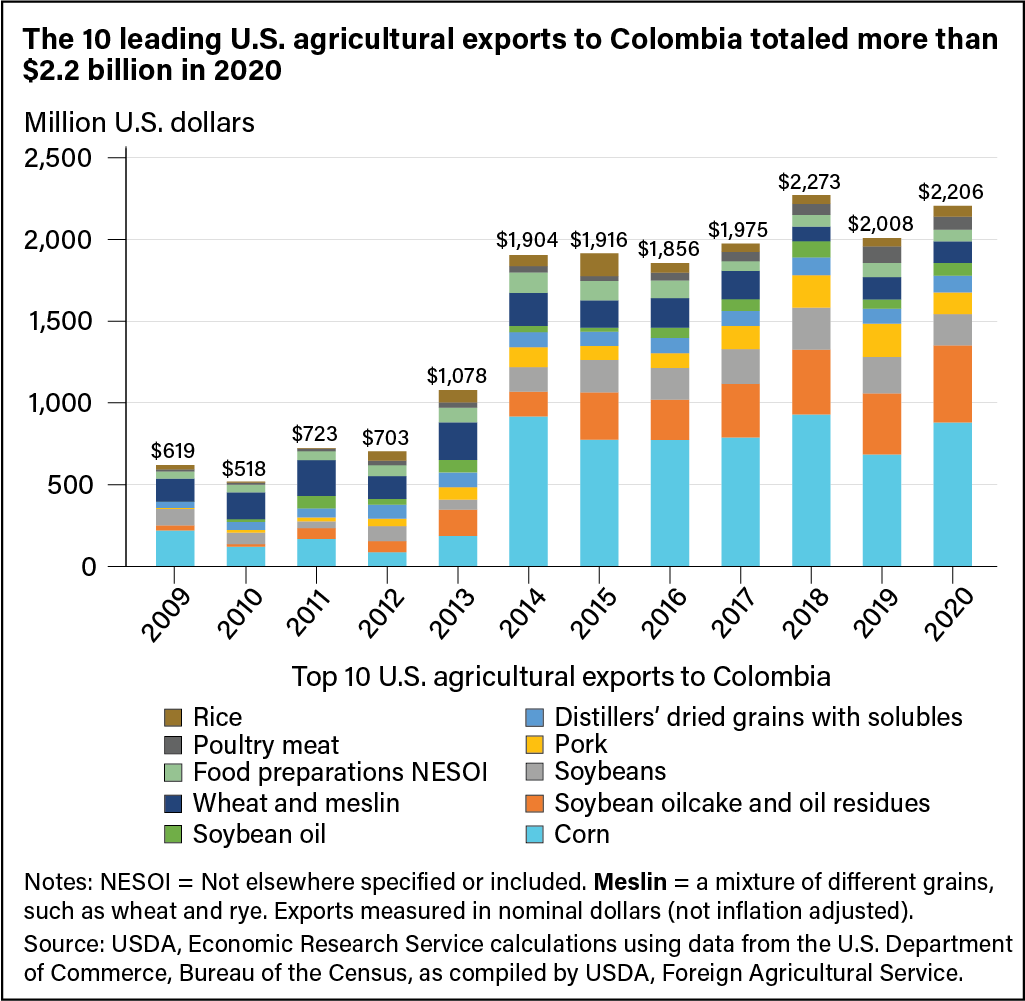
The TPA increased access for U.S. exporters to the Colombian market for a broad range of products—agricultural and nonagricultural—including bulk commodities such as corn and soybeans, intermediate goods such as soybean oilcake, and consumer-oriented products such as pork and poultry meat. To better understand the performance of U.S. agricultural exports to Colombia, researchers at Cornell University and USDA's Economic Research Service examined the 10 leading product categories for these exports, as well as 5 additional product categories in which export growth from 2009 to 2018 was notably rapid. For the 10 leading categories of U.S. agricultural exports to Colombia, shipments totaled about $2.2 billion in 2020, accounting for 77 percent of total U.S. agricultural exports to Colombia that year (see chart below).
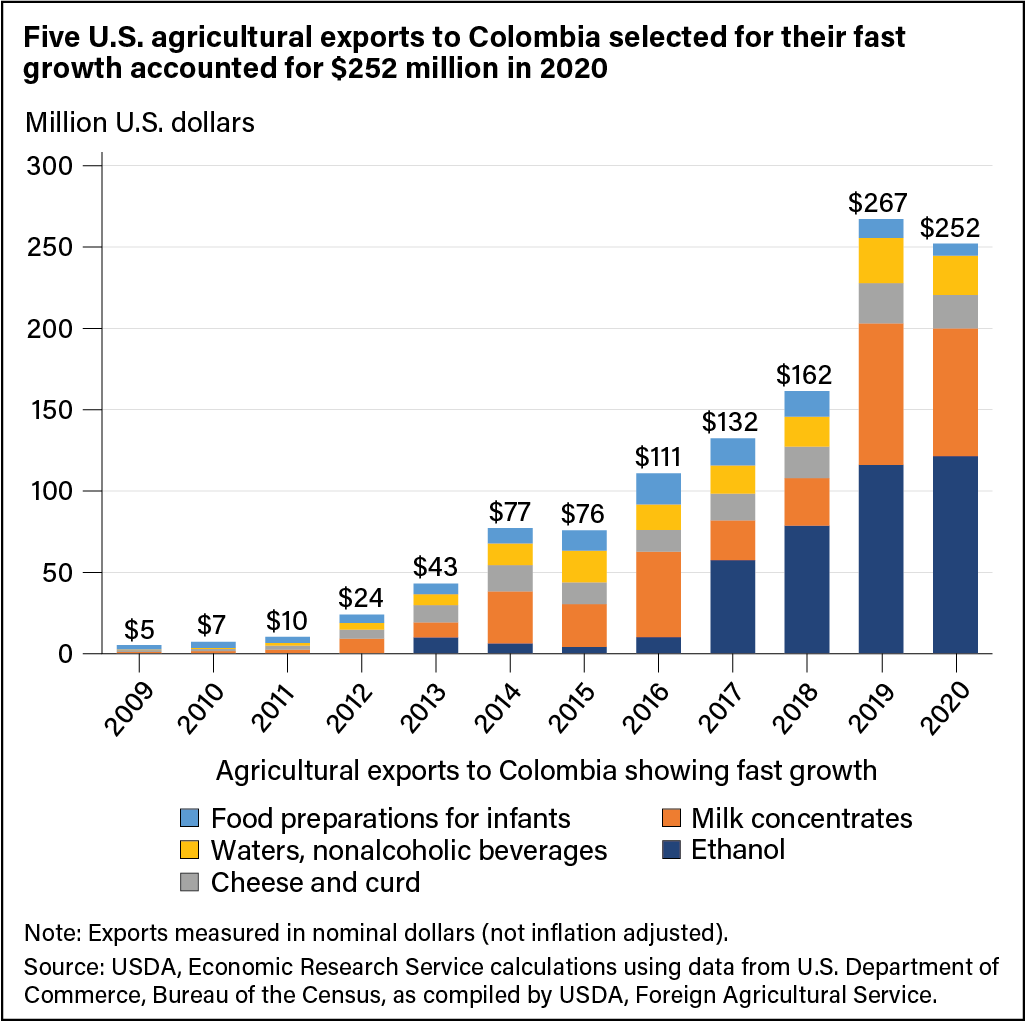
In addition to the 10 export leaders, researchers identified U.S. agricultural products for which annual exports to Colombia have risen from levels of less than $5 million a year to tens of millions of dollars since the TPA took effect in 2012. The chart below shows the rising value for five such products. One of those products is ethanol, which has emerged as a major U.S. agricultural export to Colombia since the TPA’s implementation, with annual sales exceeding $100 million in 2019 and 2020.
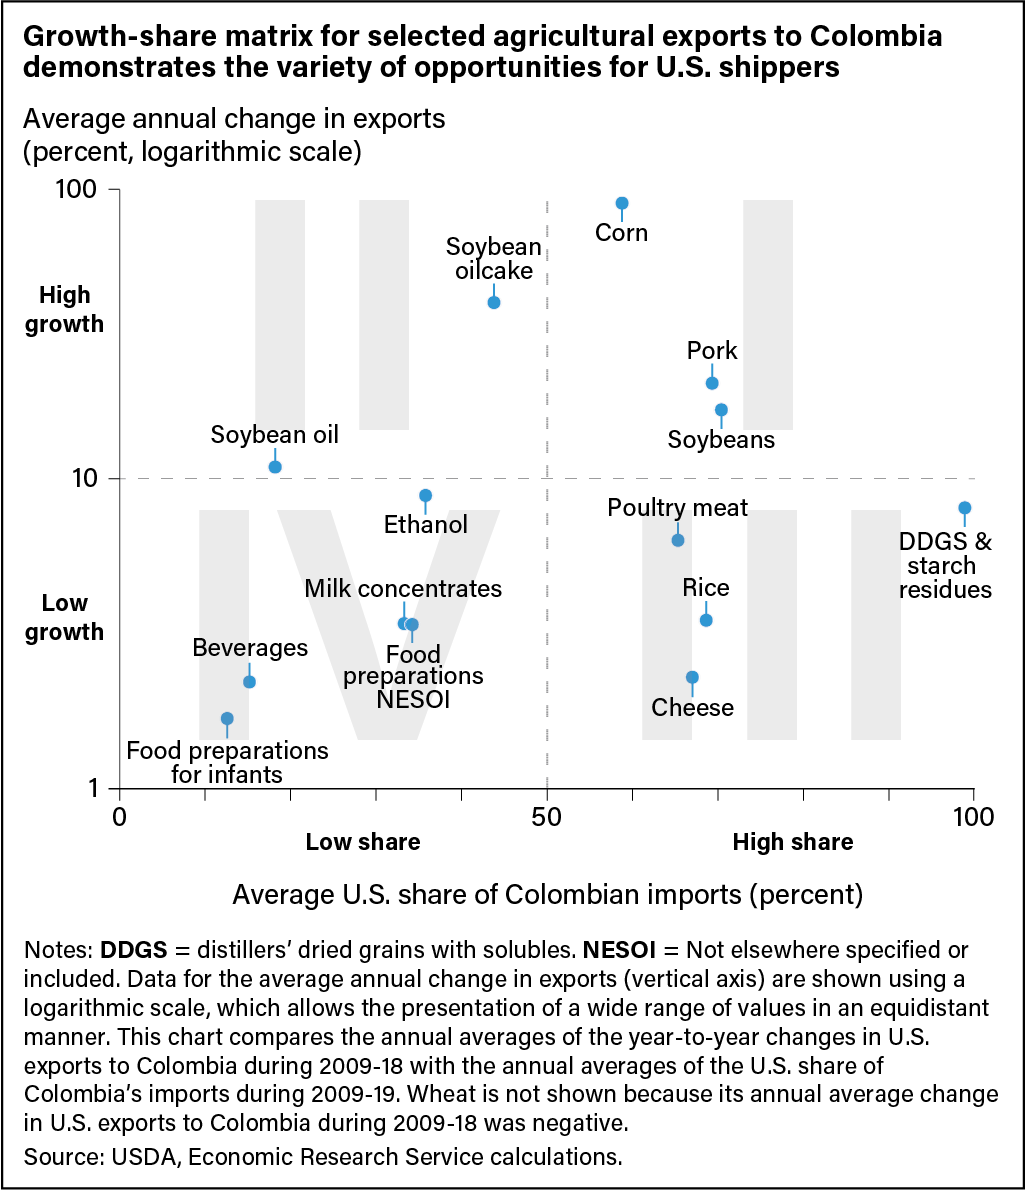
The United States accounted for a high share of Colombia’s imports in a number of product categories during the time period studied. To identify opportunities in the Colombian market, the researchers examined U.S. export performance in all 15 product categories. They compared the average year-to-year change in the value of U.S. exports to Colombia for each category from 2009 to 2018 with the average U.S. share of Colombian imports of that product during 2009–19 (see chart below).
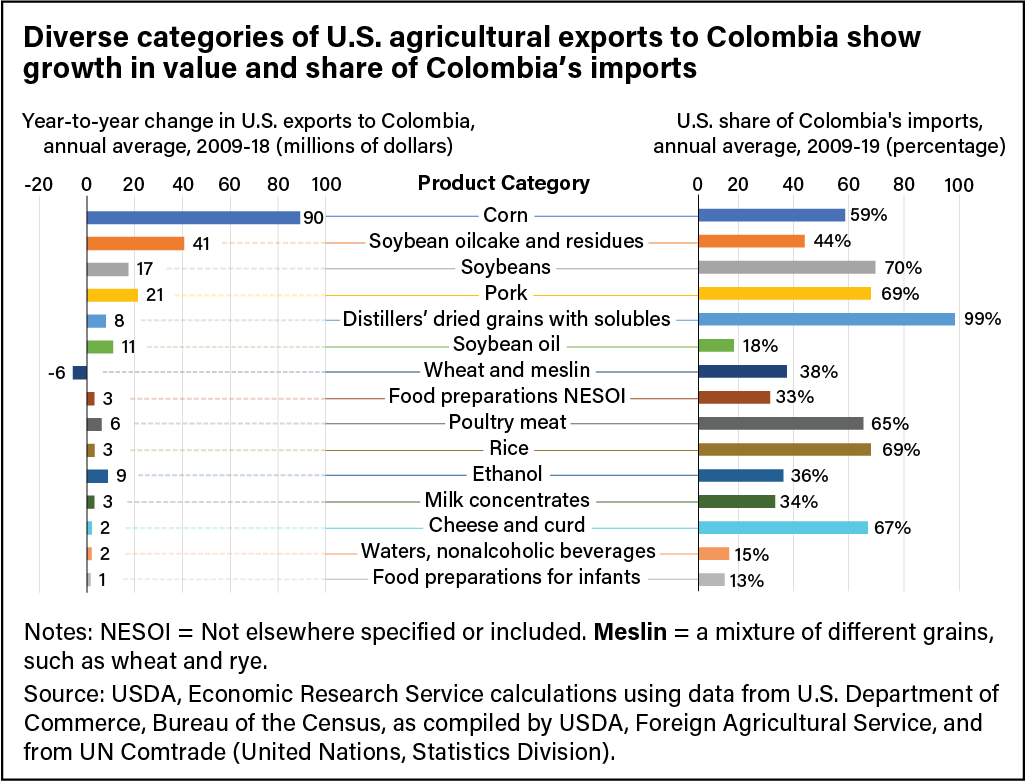
With these data in hand, the researchers used a growth-share matrix to examine U.S. export performance in the 15 product categories and compare them in terms of possible market opportunities in Colombia. In the matrix chart below, the vertical axis shows the average annual growth in export value during 2009–18, while the horizontal axis illustrates the average share of the Colombian import market supplied by the United States in each category during 2009–19. This research found that for any given product category, when an increase in Colombia’s consumption was matched by an increase in domestic production, growth opportunities for U.S. exports of that product tended to be limited. However, when domestic consumption of that product was higher than domestic supply—and if this difference remained or expanded over time—export opportunities for the United States and other foreign suppliers of that product increased.
Matrix Group 1: Higher U.S. Market Share, Higher Growth in U.S. Exports
The three commodities in Quadrant I of the matrix chart above have a higher average U.S. share of Colombian import markets and a higher year-to-year increase in U.S. exports to Colombia. In these product categories—corn, soybeans, and pork—the United States has maintained a leading position among Colombia’s foreign suppliers, and the Colombian market is of growing importance to U.S. exporters. In 2018, corn led U.S. agricultural exports to Colombia, followed by soybeans as the third largest export and pork in fourth place.
Imports (from all countries) supply about 80 percent of Colombia’s total corn consumption, according to USDA estimates for marketing years 2018/19 through 2020/21. The United States is Colombia’s leading foreign supplier of corn—largely because of the TPA, which established separate transitional tariff-rate quotas (TRQs) for U.S. yellow and white corn. A TRQ is a quota for a specified volume of imports at a generally low tariff—zero percent in the case of the agreement for corn. After the quota is reached, a higher tariff applies to additional imports. The transitional TRQs for corn gradually expand each year for the first 11 years of the TPA. At the start of 2023, these TRQs will be eliminated, and there will be no tariff or quota barriers to U.S. corn exports to Colombia.
U.S. corn exporters face competition in the Colombian market primarily from Argentina and Brazil. As full members of the Southern Common Market (Mercosur), Argentina and Brazil are associate members of the Andean Community. This gives them preferential access to the Colombian corn market through the community’s price band system that sets upper and lower price limits for yellow corn. During parts of 2019, the price of yellow corn rose above the price band’s ceiling, so Colombia’s import tariff on yellow corn from Mercosur fell below the over-quota tariff on yellow corn from the United States. Since the United States is not a member of the Andean Community, U.S. corn exports to Colombia are not subject to this price band system. Instead, its exports are limited by the transitional TRQ created by the TPA, as mentioned in the previous paragraph. In the face of this temporary increase in Colombian corn imports from Argentina and Brazil, U.S. corn exports to Colombia dropped from 5.5 million metric tons (worth $927 million) in 2018 to 3.9 million metric tons ($683 million) in 2019 and then climbed back to 5.1 million metric tons ($879 million) in 2020.
Since 2017, the United States has supplied nearly all of Colombia’s soybean imports—compared with an annual average share of 70 percent during 2009–19 in terms of value. According to U.S. trade statistics, the United States exported an annual average of about 619,000 metric tons of soybeans (worth $224 million) to Colombia from 2018 to 2020. Domestic soybean production supplied about 15 percent of Colombia’s total soybean consumption from marketing years 2018/19 to 2020/21. During that period, Colombia’s soybean yields were about 82 percent of U.S. soybean yields. This relatively high level of productivity suggests that Colombian farmers could supply more of their country’s soybean demand if they were able to increase yields further or dedicate more land to this crop.
Supported by growing incomes, pork consumption in Colombia has grown since the TPA’s implementation. According to the Asociación Colombiana de Porcicultores, per capita pork consumption more than doubled from 2011 to 2019. This change was partly attributable to the TPA, which facilitated the imports of feedstuffs used in Colombian livestock production and made U.S. pork more broadly available to Colombian consumers.
Matrix Group 2: Lower U.S. Market Share, Higher Growth in U.S. Exports
The Colombian market is of growing importance to U.S. exporters for the second group of product categories: soybean oilcake, used primarily as animal feed, and soybean oil, used mainly as cooking oil. The U.S. share of the Colombian markets for imported soybean oilcake and soybean oil during the period examined was low compared with other categories (see Quadrant II of the matrix chart above). While the United States supplies almost all of Colombia’s soybean imports, it faces competition from Bolivia in Colombia’s markets for soybean oilcake and soyoil. Still, the opportunity exists for U.S. exporters who want to capitalize on Colombia’s increasing demand for these products. When the TPA was implemented in 2012, Colombia’s 20-percent tariff on U.S. soybean oilcake and similar residues was immediately eliminated, and the United States solidified its position as Colombia’s leading foreign supplier in this product category. Similarly, the volume of U.S. soyoil exports to Colombia nearly quadrupled, increasing from an annual average of about 27,000 metric tons (worth $32 million) during 2009–11 to 102,000 metric tons ($78 million) during 2018–20.
Matrix Group 3: Higher U.S. Market Share, Lower Growth in U.S. Exports
The third group consists of product categories with a high U.S. market share in Colombia but relatively low growth in U.S. exports to that country (see Quadrant III of the matrix chart above). In these categories, the Colombian market is likely saturated with imports, and future import growth will depend mainly on further increases in domestic consumption. Four product categories are included in this group: poultry meat, rice, distillers’ dried grains with solubles (DDGS) and starch residues, and cheese.
As with pork, rising incomes and trade liberalization—which boosted domestic chicken production through higher feedstuff imports—helped to increase Colombia’s consumption of poultry meat. According to the Federación Nacional de Avicultores de Colombia, per capita chicken consumption increased 54 percent from 2011 to 2019. Unlike pork, the increase in poultry consumption was supplied mainly by domestic producers.
Rice consumption in Colombia also has increased since the TPA’s implementation. However, rice consumption has grown at a much slower rate than pork and chicken consumption, reflecting rice’s long-standing status as a staple food in Colombia. Between 2012 and 2019, per capita rice consumption in Colombia rose from 40 kilograms to 43 kilograms, an increase of 7.5 percent. This increase was partly due to increased rice consumption in rural Colombia, where per capita rice consumption tends to be higher than the national average, and—according to reports from the Bogotá post of USDA’s Foreign Agricultural Service—to an influx of migrants from neighboring Venezuela, where rice is also a staple food. Trade liberalization under the TPA is another factor behind the rise in U.S. rice exports to Colombia. Like corn, U.S. access to the Colombian rice market is defined by a transitional TRQ that gradually expands each year and will be eliminated in 2030.
DDGS are a co-product of corn-based ethanol production, and the starch residues corn gluten meal and corn gluten feed are co-products of corn-based starch or sweetener production. All three products have high protein contents and are close substitutes for many feed products. During 2018–20, the United States exported to Colombia an annual average of about 210,000 metric tons ($44 million) of DDGS and 126,000 metric tons ($57 million) of starch residues. DDGS and starch residues from the United States gained duty-free status in Colombia immediately upon the TPA’s implementation.
Colombia’s annual imports of cheese and curd had never exceeded 1,000 metric tons before 2012, according to the Colombian Government’s trade statistics. However, with the TPA’s implementation in 2012 and the provisional implementation of the FTA between the European Union (EU), Colombia, and Peru in 2013, imports have significantly increased. During 2018–20, Colombia’s cheese and curd imports from all countries averaged about 5,000 metric tons ($27 million) per year. The United States supplied roughly three-fourths of these imports, according to Colombian statistics. With the broader access to imported cheese, Colombian consumption has risen. Annual per capita cheese consumption in Colombia increased from about 0.6 kilograms in 2009 to 1.8 kilograms in 2021, according to data from the market-measurement company Nielsen and the market-research company Euromonitor.
Matrix Group 4: Lower U.S. Market Share, Lower Growth in U.S. Exports
U.S. exports to Colombia in the last group of product categories—ethanol, milk concentrates, certain food preparations, waters and other nonalcoholic beverages—increased by lower percentages, while the U.S market share remained relatively low (see Quadrant IV of the matrix chart above). In these categories, U.S. exporters may find it more difficult to compete in the Colombian market. This is partly because of competition from other foreign suppliers, many of whom have duty-free access to the Colombian market through their countries’ FTAs with Colombia.
Ethanol has the highest average annual increase in exports among the product categories in this fourth group. During the 21st century, ethanol has been increasingly used in Colombia as an oxygenate in gasoline. The United States supplies roughly 40 percent of Colombian demand for fuel ethanol. According to U.S. trade statistics, the United States exported an annual average of 245 million liters (worth $98 million) of fuel ethanol to Colombia during 2018–20.
Increased fuel ethanol imports from the United States have amplified concerns about the economic competitiveness of Colombia’s own sugarcane-based fuel-ethanol sector, as well as the compatibility of free trade with Colombia’s domestic policies that regulate fuel and biofuel prices. In January 2019, the Colombian Government began an investigation of fuel ethanol imports from the United States in response to a petition filed by Colombia’s National Federation of Biofuels. In May 2020, Colombia applied a countervailing duty on U.S. ethanol that was equivalent to an ad valorem tariff of about 10.5 percent to 12.1 percent. An ad valorem tariff is calculated as a percentage of the good’s price.
Colombia’s annual imports in the milk concentrates category averaged about $108 million during 2018–20. Milk powder accounted for nearly all (99.6 percent) of these imports. With the TPA’s implementation, the United States has emerged as Colombia’s leading foreign supplier of milk concentrates, with a 49.0-percent share of Colombia’s milk concentrate imports during 2018–20. By contrast, the U.S. share averaged 32.0 percent during 2009–18. The TPA provides a transitional TRQ for U.S. milk powder, with a duty-free quota that gradually expands to an unlimited quantity starting in 2026. Most of Colombia’s powdered milk imports go directly to the food manufacturing sector for further processing.
Another emerging category comprises a variety of food preparations, including food preparations for infant use, malt extract and certain food products of flour or meal, and mixes and doughs. Following the TPA’s implementation, U.S. exports to Colombia in this category more than tripled in value—from a 3-year, annual average of about $2 million during 2009–11 to $11 million during 2018–20, according to Colombian statistics. Multiple countries supply such products to Colombia, with the country’s free-trade partners being the most prominent. The EU was Colombia’s leading supplier of this category during 2018–20 with a 32-percent share, followed by Mexico at 31 percent and the United States at 12 percent.
A separate category of food preparations includes protein concentrates and textured protein substances. In general, products in this category are intermediate goods used to make processed foods, animal feeds, and beverages. Again, multiple countries supply Colombia with products in this category, including Brazil and four of Colombia’s free-trade partners: the United States, EU, Mexico, and Peru. Annual U.S. exports to Colombia in this product category averaged $73 million during 2018–20, compared with $48 million during 2009–11, according to U.S. statistics.
A variety of products comprise the waters and other nonalcoholic beverages category, including mineral waters, carbonated soft drinks, nonalcoholic beer, milk-based drinks (chocolate milk, for example), and fruit and vegetable juices that have been fortified with vitamins or minerals. Since the TPA’s implementation, U.S. exports to Colombia in the waters and other nonalcoholic beverages category have more than quintupled in volume. The average annual value of these exports was about $23 million during 2018–20, according to U.S. trade statistics.
This article is drawn from:
- Gomez, M.I., Puerto, S., Zahniser, S. & Li, J. (2021). U.S. Agricultural Exports to Colombia: Rising Sales in Response to Trade Liberalization and Changing Consumer Trends. U.S. Department of Agriculture, Economic Research Service. AES-118-01.