

Food Consumption and Nutrient Intakes Data Product Shines a Light on U.S. Diets
- by Joanne Guthrie and Biing-Hwan Lin
- 9/7/2021
How do the food choices of U.S. consumers compare to Federal dietary recommendations? The USDA, Economic Research Service (ERS) Food Consumption and Nutrient Intakes data product analyzes and reports information from federally conducted surveys of nationally representative samples of U.S. consumers to provide researchers, policymakers, and program staff with useful insights on that important question.
The ERS tables draw on data collected as part of the What We Eat in America, National Health and Nutrition Examination Surveys (NHANES) conducted in 2015–16 and 2017–18. As part of the NHANES, trained interviewers collect information from a national sample of individuals on the foods they ate over a 24-hour period and where those foods were obtained (from the home food supply, a restaurant, etc.). Although NHANES collected two of these 24-hour interviews over 2 nonconsecutive days, the ERS tables use data from only the first interview day to arrive at average food group and nutrient intakes. NHANES also collects demographic information on participants that enables subgroup analysis by different factors, such as household income.
The Dietary Guidelines for Americans recommends the consumption of food groups such as vegetables, fruits, grains, dairy, and protein foods, which includes meat, poultry, eggs, seafood, nuts, seeds, and soy. However, individuals frequently eat foods that are a combination of items from multiple food groups. For example, a slice of apple pie includes apples, a fruit, but also sugar added to the filling and a crust that was made with flour (grain) and fat. To estimate food group consumption, USDA’s Agricultural Research Service (ARS) combines NHANES data with its Food Patterns Equivalents Database (FPED) to separate foods as consumed into their respective food group component amounts. Continuing with the example, a slice of apple pie would be separated into the appropriate amounts of fruit, added sugars, grain, and solid fat or oils. FPED has been regularly updated by ARS for use with NHANES surveys through 2018; ARS also generates estimates of nutrients obtained from foods consumed.
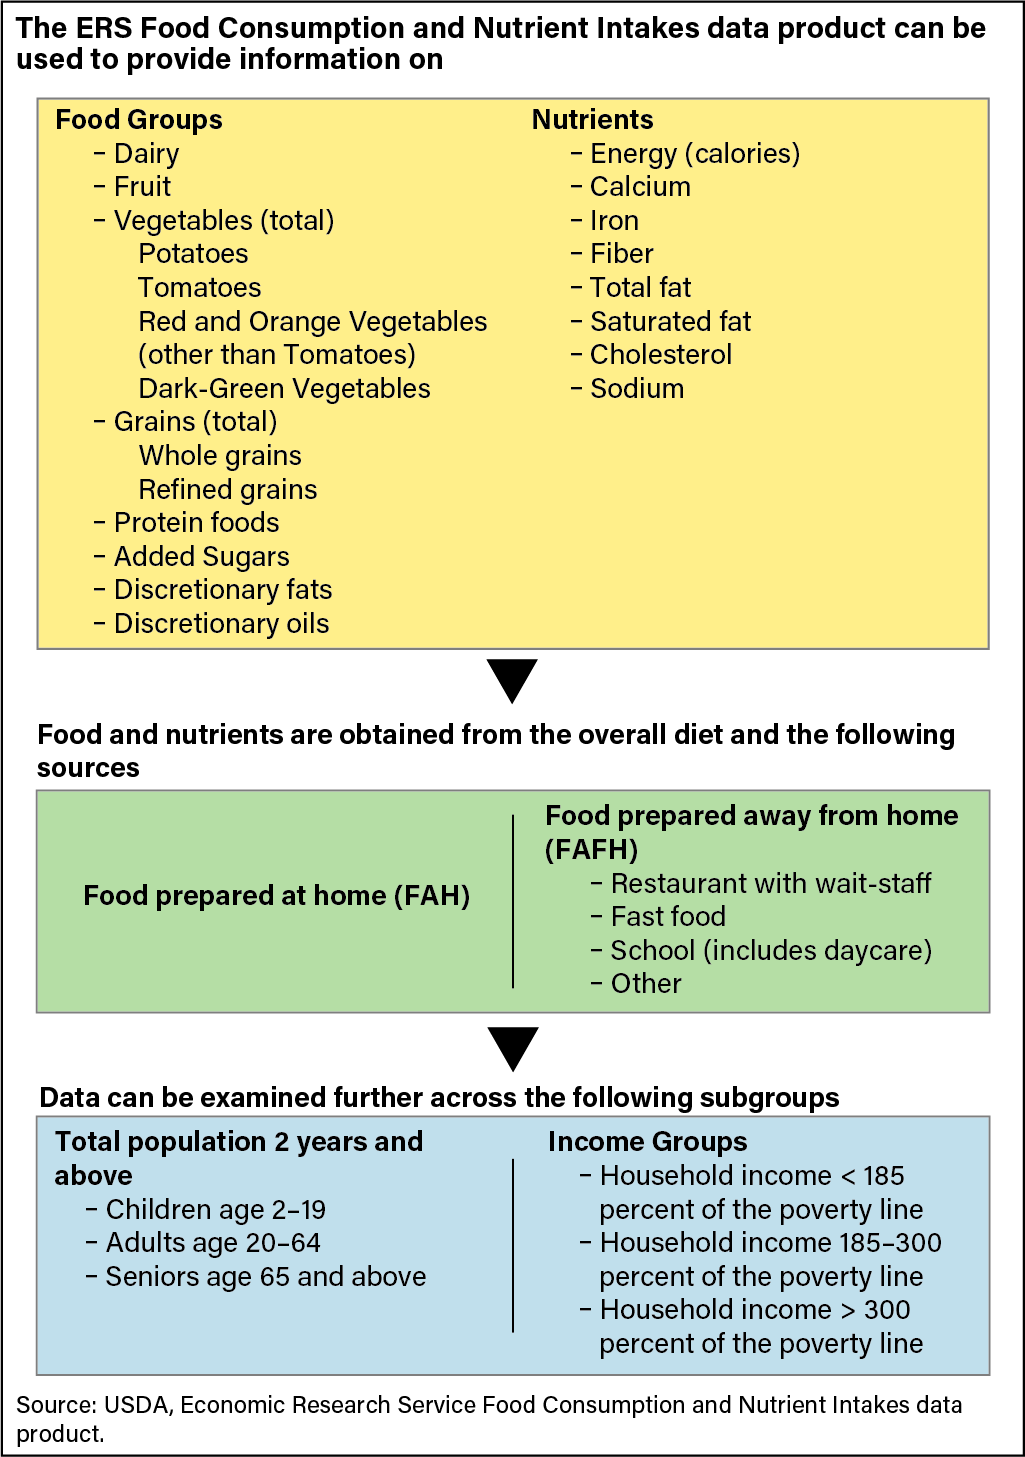
ERS researchers use these data to calculate the average daily consumption of food groups and selected nutrients identified as priorities by Federal dietary guidance, with results in tables provided on the ERS website. These data tables also report the average consumption per 1,000 calories, which is referred to as the food or nutrient density of the diet. This measure is used to obtain information on the quality of the diet when controlling for differences in amounts consumed. Estimates are calculated for the overall daily intake and by source. Sources are categorized as foods prepared at home (FAH), which are typically purchased from a grocery store or supermarket, and foods prepared away from home (FAFH), such as foods from restaurants and fast-food establishments. All estimates are presented for the total U.S. population above the age of 2 and by household income level. The graphic below provides details on the type of information that can be found in these data tables.
Given this depth of information, the data can answer many questions related to food consumption and nutrient intakes in the United States. To give some sense of the possibilities, we provide a few examples, focusing on food source, using the NHANES data from 2017–18. Figure 1 below provides a look at where people of differing ages obtain the food they eat.
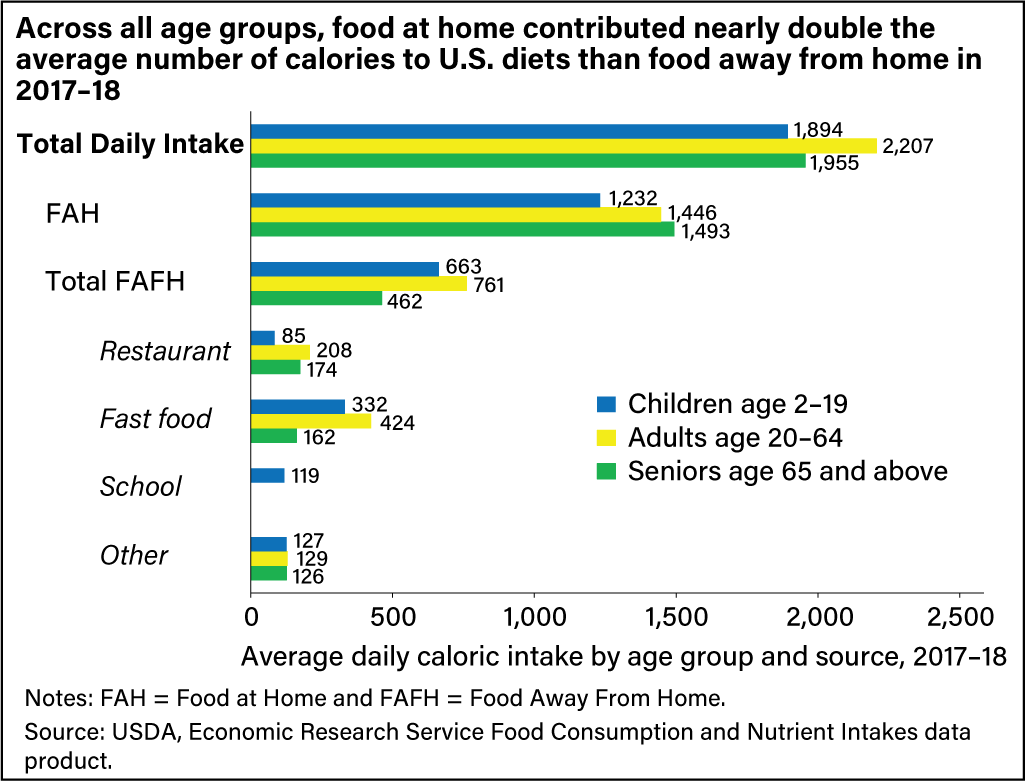
While FAH was the lion’s share of food consumption in 2017–18, FAFH was also important. At all ages, FAFH primarily means fast food or restaurants, but for children, there is another important source—schools, which also includes daycare. On average, foods obtained at school contribute 6.3 percent of daily calorie intake. This may seem low compared to other studies, such as USDA’s School Nutrition and Meal Cost Study, which estimated that a student who participated in USDA’s National School Lunch and Breakfast Programs obtained approximately 30 percent of the day’s calories from those meals on typical schooldays. However, the ERS data tables represent information from all children, including those who do not participate in school or daycare meal programs or are not in school or daycare on the day data are collected. Therefore, the average contribution is lower.
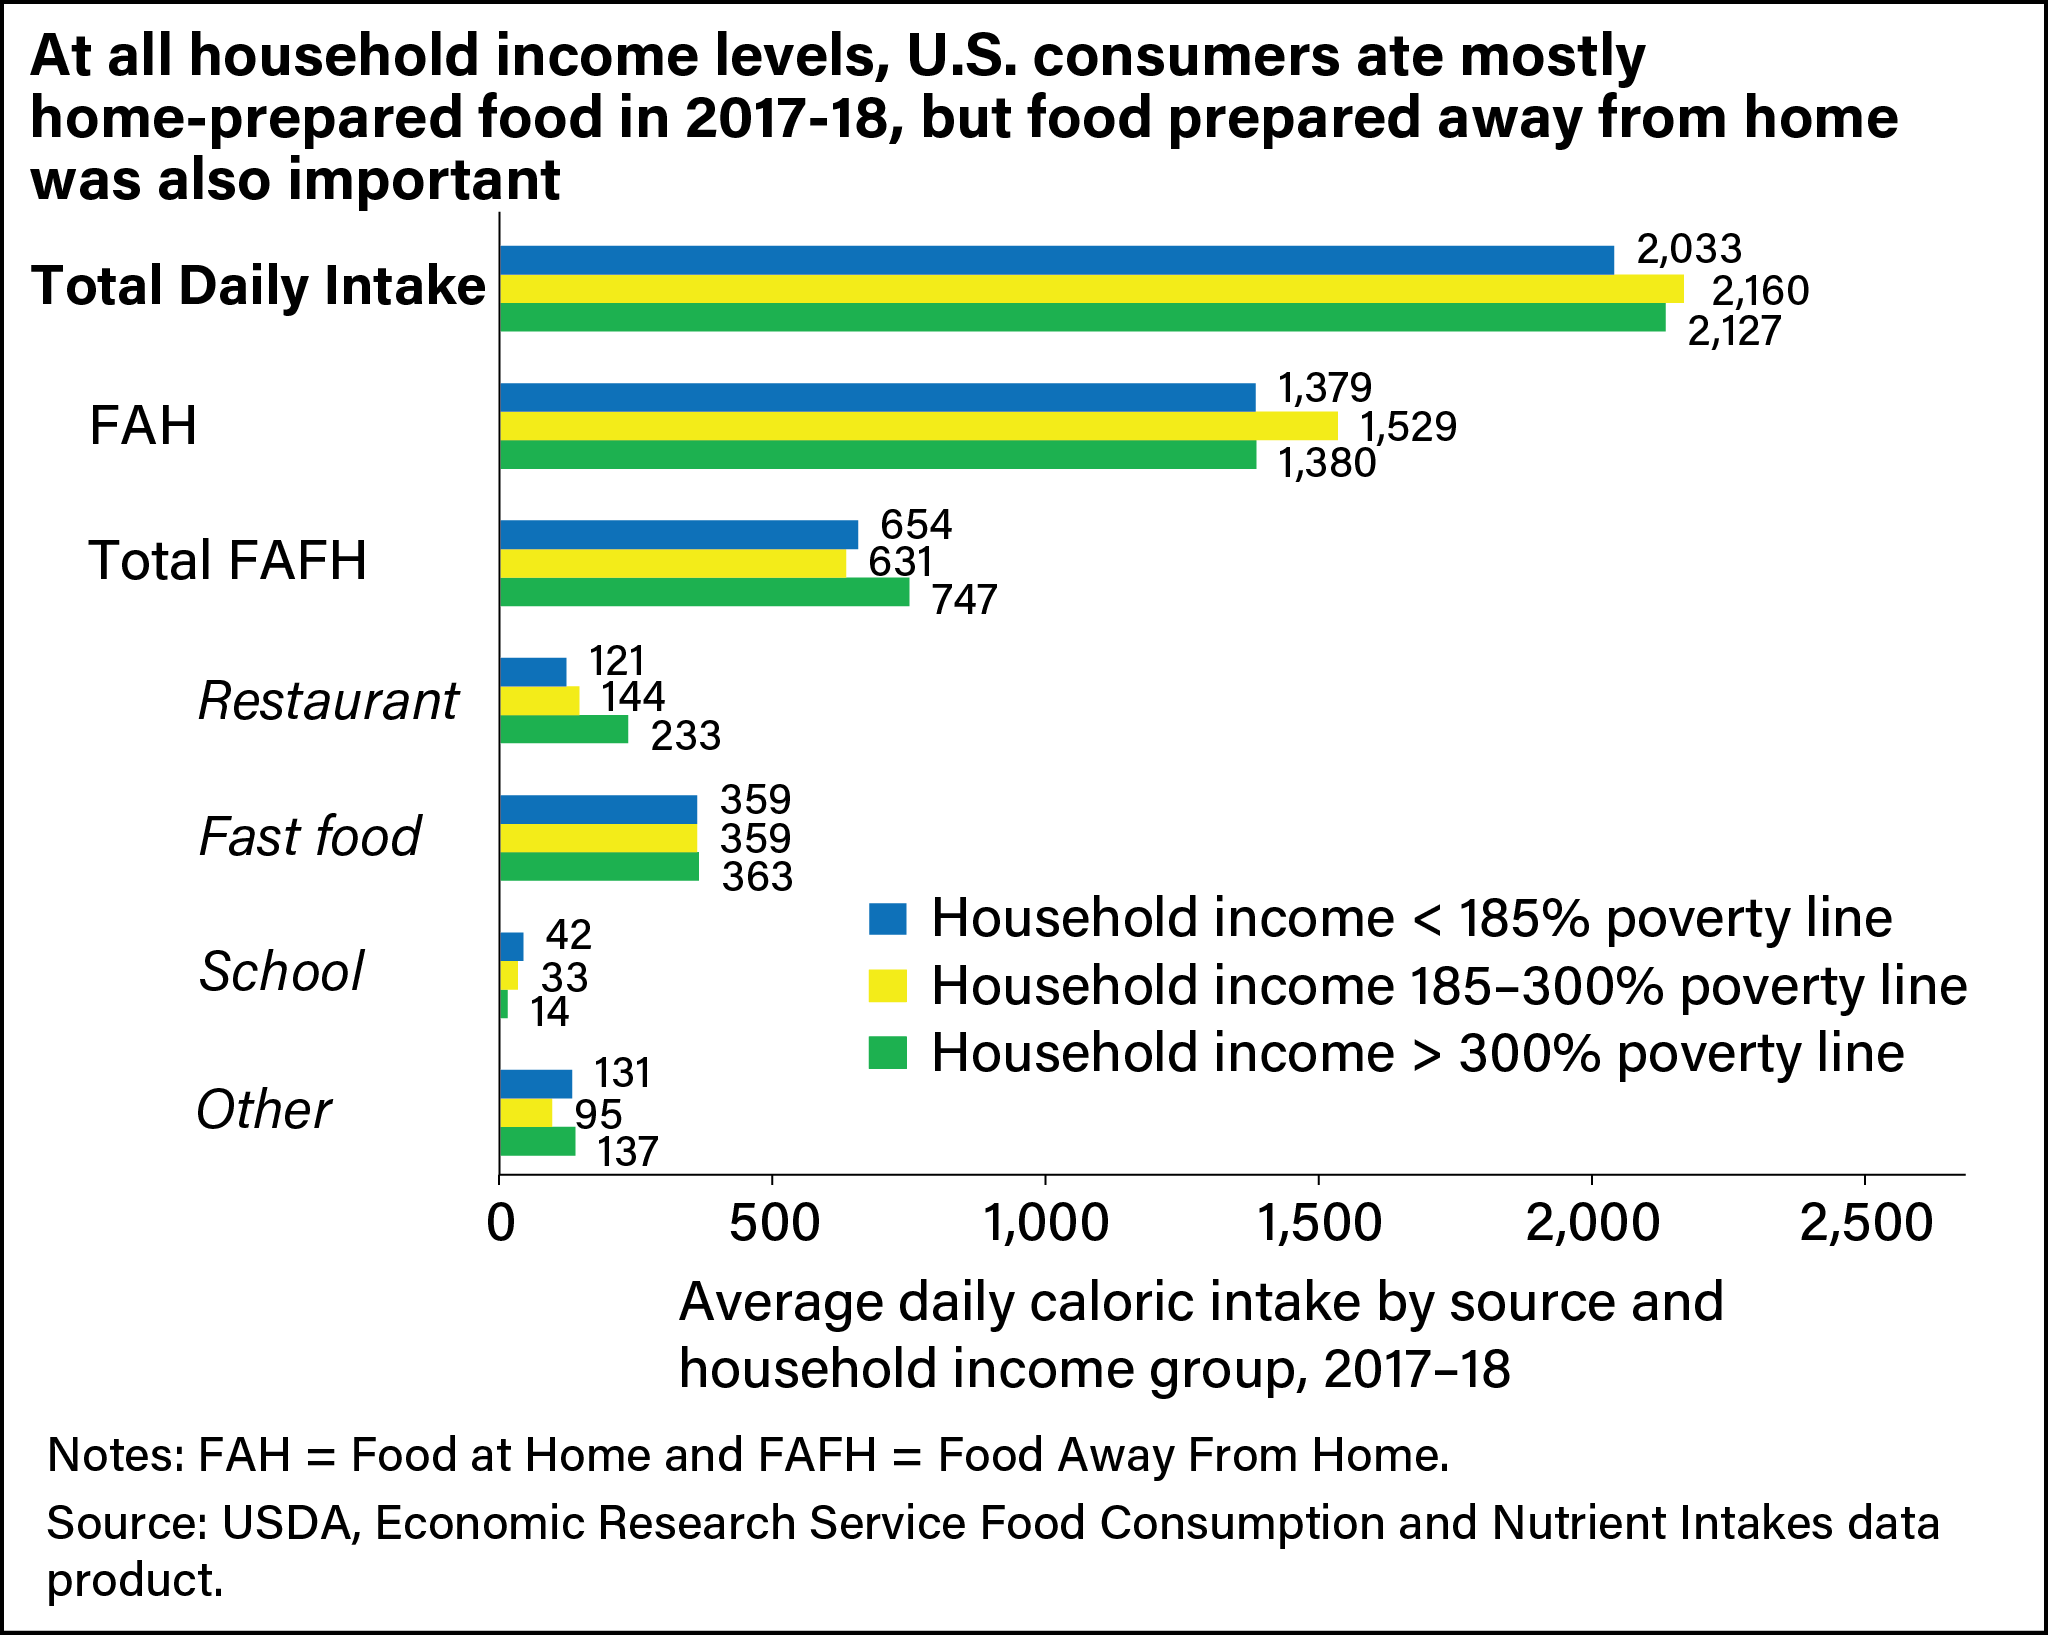
Examining the data by income group, we find that FAFH is a part of U.S. diets at all household income levels, but there is some difference in the importance of specific FAFH sources (see figure 2 below). While fast food contributes virtually the same amount of calories to households in all income groups, the average calories obtained from restaurant foods by households in the highest-income group is almost twice that of the average for the lowest income group. This is probably not surprising since restaurant foods would be the most expensive FAFH. In contrast, the average contribution of school food is highest for the lowest income household groups; children in this group would generally be eligible to obtain USDA school meals for free or at a reduced price.
Diving deeper into the data, we can also examine the quality of U.S. diets and consider how it is associated with food source. As an example, we consider one food group, dairy, and a nutrient for which it is the major source, calcium. The dairy food group, as defined by USDA dietary guidance, includes milk, cheese, yogurt, lactose-free milk, and fortified soy milk. For individuals 2 years and older, the Dietary Guidelines for Americans, 2020-2025 recommend those following a Healthy U.S.-Style Dietary Pattern consume 2–3 cups of dairy per day, depending on age.
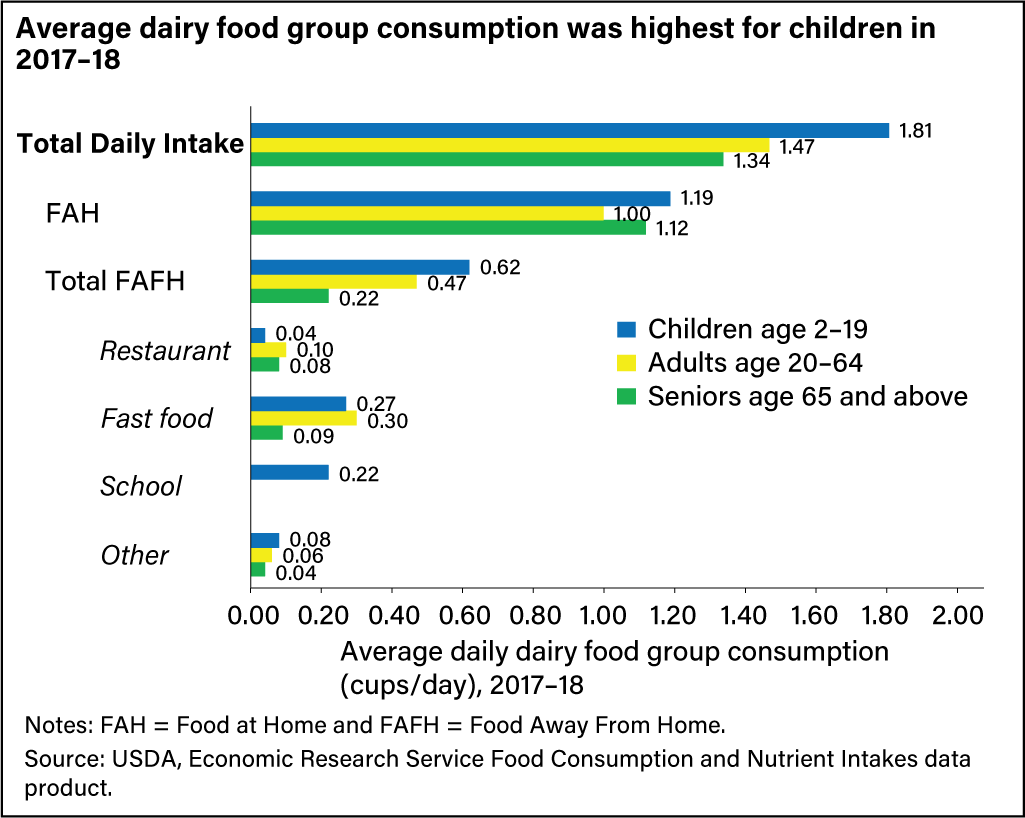
As shown in figure 3 above, none of the age groups meet this recommendation, although children come closest, despite not consuming as many calories. Examining the density of dairy group consumption (that is, the amount of dairy consumed per 1,000 calories) for each age group by source offers insight into the explanation (see figure 4 below).
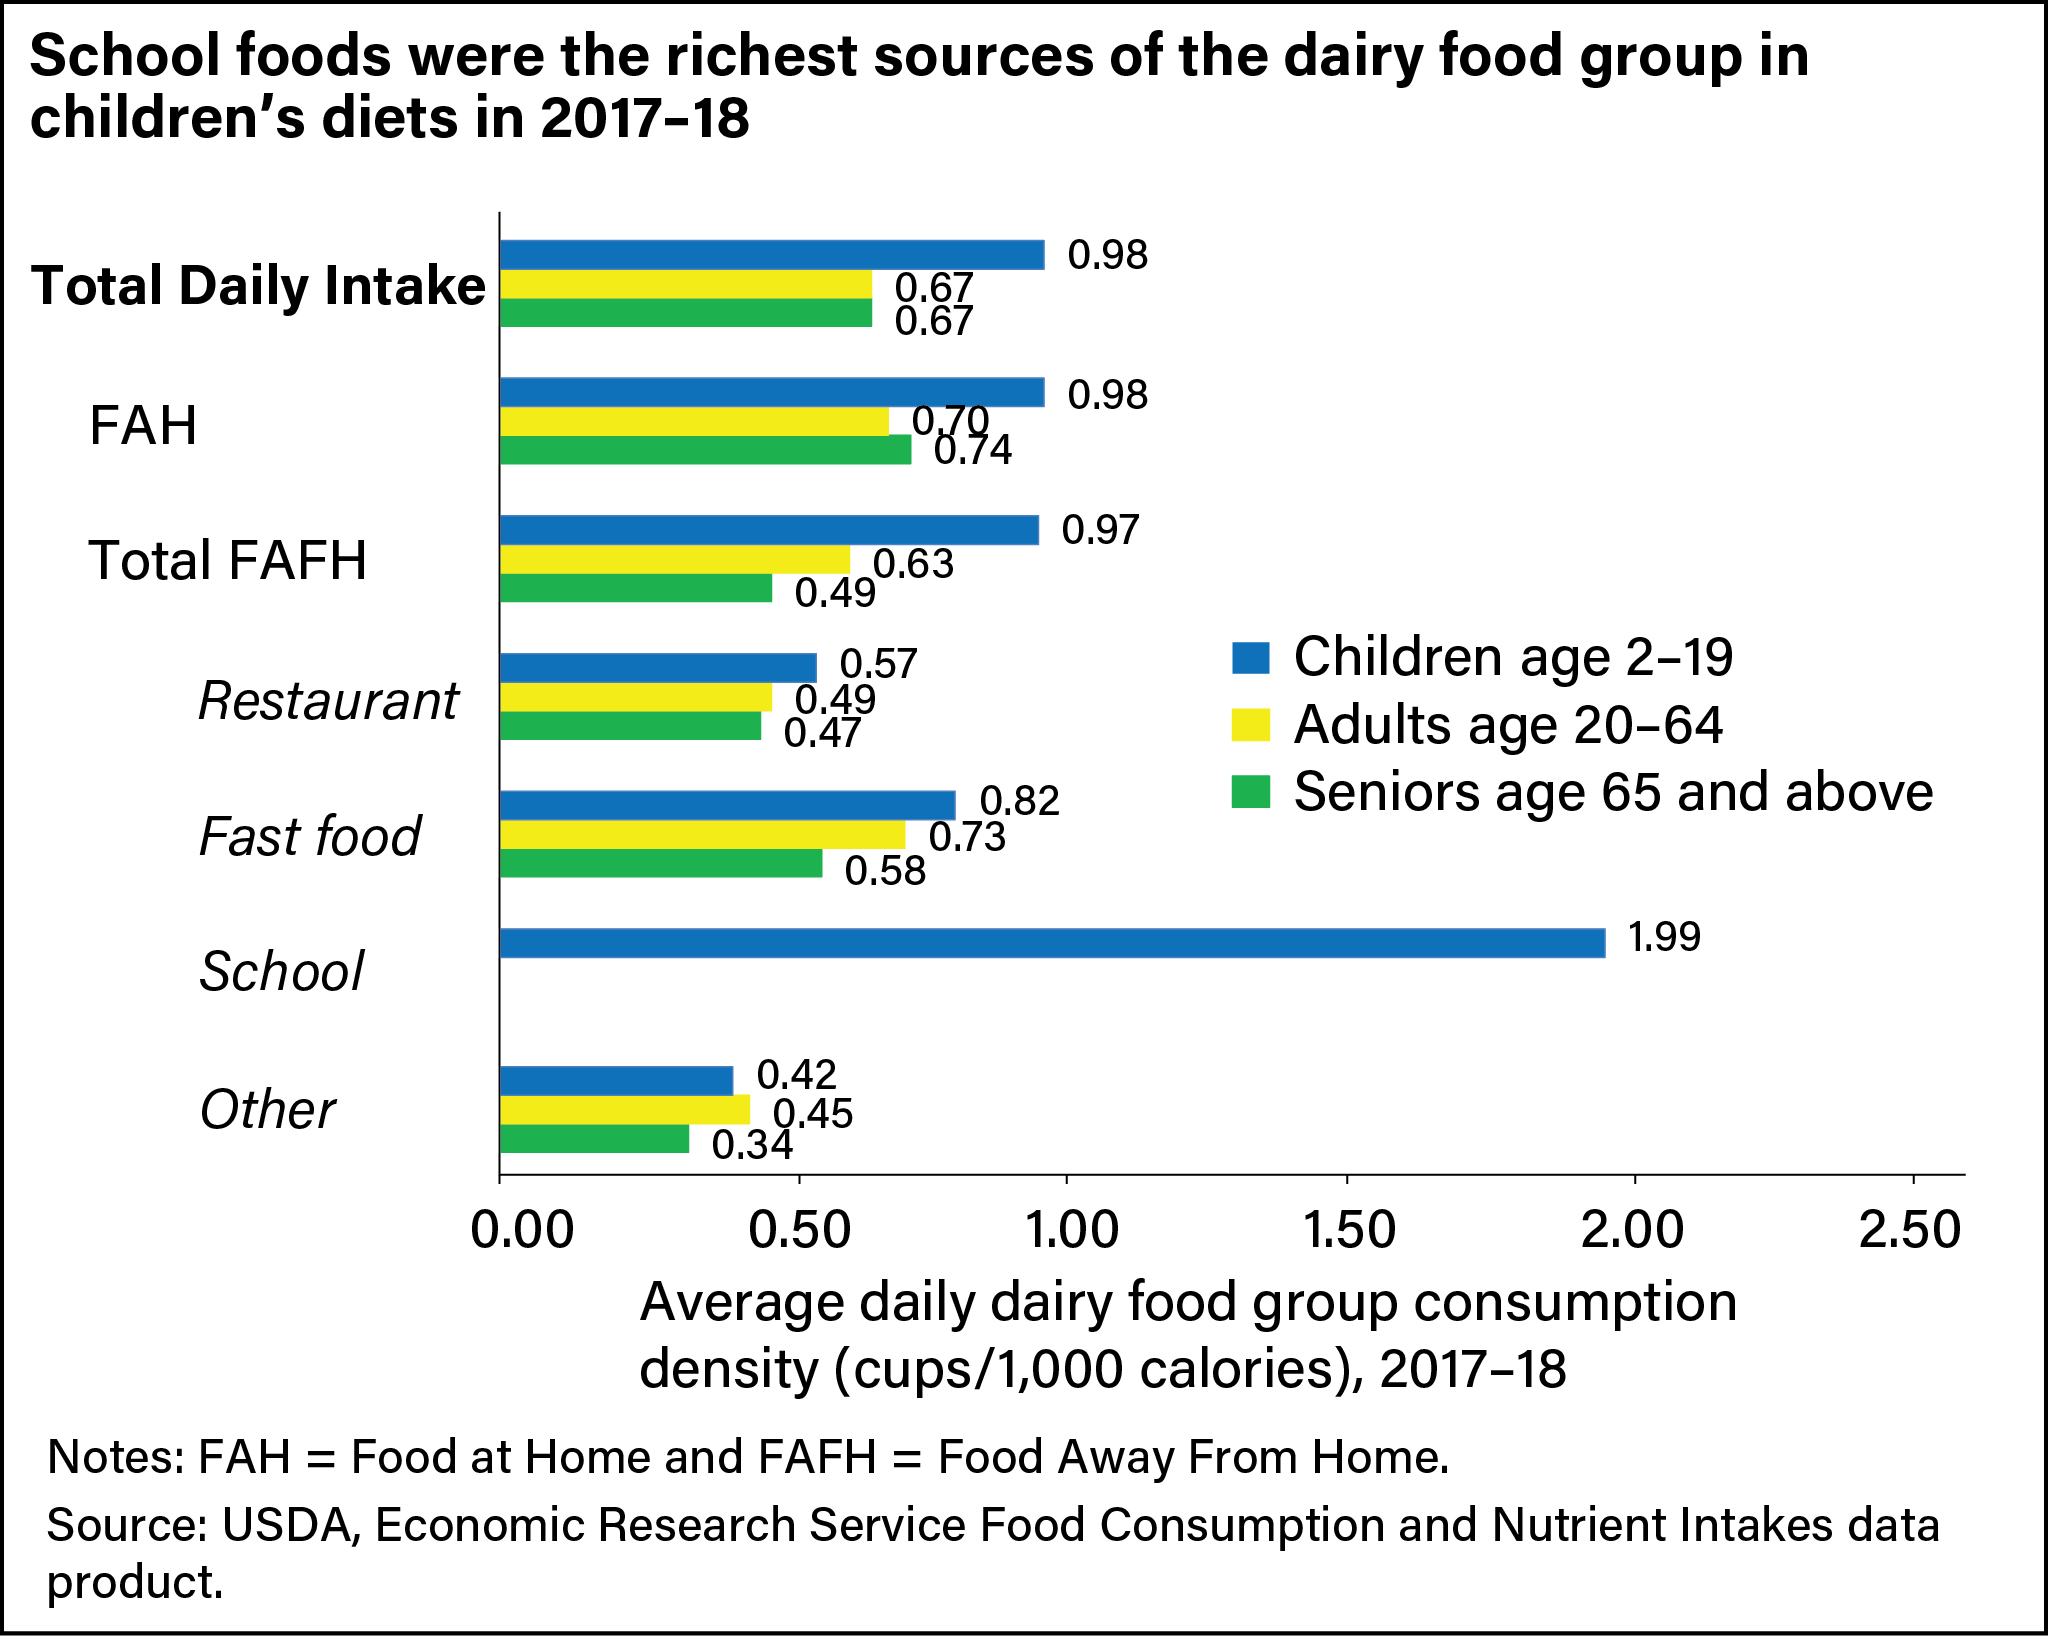
While other FAFH sources, such as restaurants and fast-food establishments, contribute less to dairy food consumption than FAH on a density (per 1,000 calorie) basis, school food is the richest source of dairy foods in children’s diets on a per 1,000 calorie basis. The dairy food group is an important source of calcium. Examining calcium intake by source, ERS finds that school food contributes 9 percent of children’s calcium intake (figure 5 below). This is despite providing only 6 percent of calorie intake, as shown previously in the first figure.

The examples shared in this article merely scratch the surface of the information that can be obtained from the ERS Food Consumption and Nutrient Intakes data product. Interested individuals can download the data tables and their documentation to craft figures and tables that fit the user’s interests and information needs.
This article is drawn from:
- Food Consumption, Nutrient Intakes, and Diet Quality. (n.d.). U.S. Department of Agriculture, Economic Research Service.
You may also like:
- Food Consumption & Demand - Flexible Consumer Behavior Survey. (n.d.). U.S. Department of Agriculture, Economic Research Service.
- Food Consumption & Demand - Food Consumption. (n.d.). U.S. Department of Agriculture, Economic Research Service.
- Food Consumption & Demand - Food Away from Home. (n.d.). U.S. Department of Agriculture, Economic Research Service.