

Do Tariff-Rate Quotas Function as Intended by the World Trade Organization?
- by Jayson Beckman
- 3/1/2021
Highlights
- Nearly one-fourth of all members of the World Trade Organization (WTO) have established tariff-rate quotas (TRQs) to promote the trade of agricultural commodities.
- While they were designed to replace often prohibitive trade barriers, tariff rates for TRQ are typically larger than those for non-TRQ products—three times the global average tariff on agriculture.
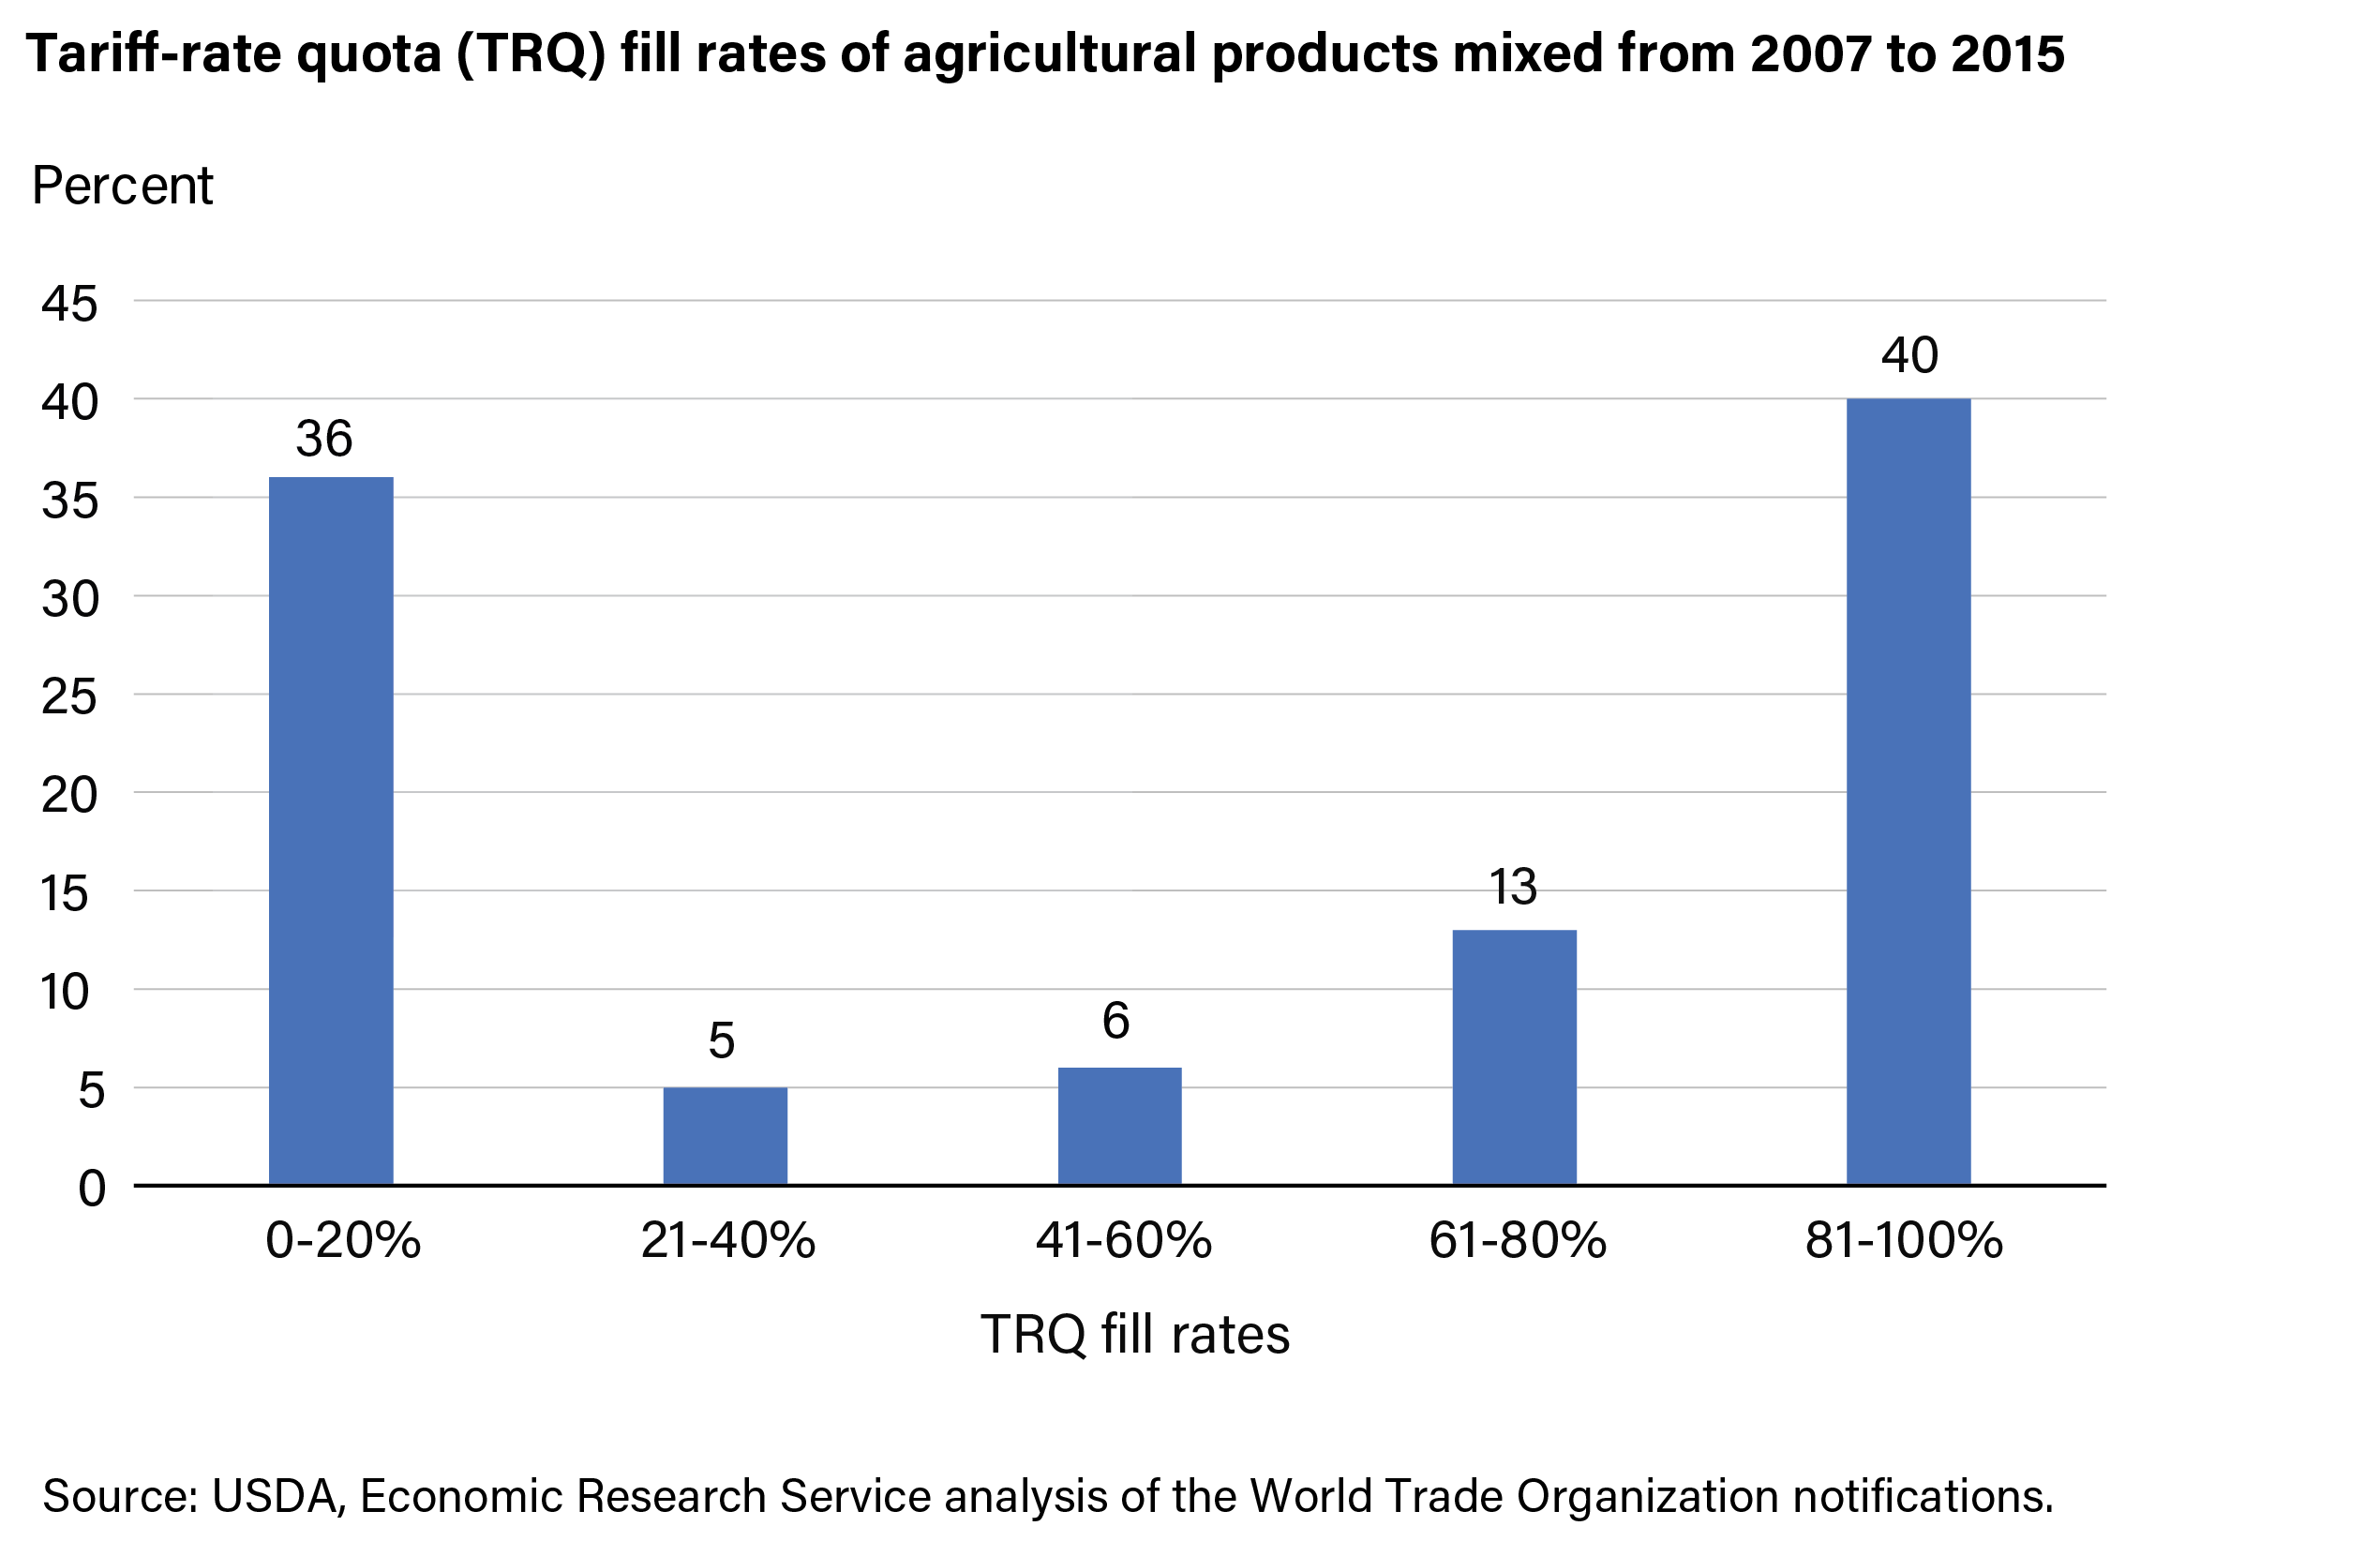
- Most TRQs are utilized with either high fill rates—the percent of quota filled—or low fill rates; 40 percent of TRQs are filled or are close to filling, while 36 percent of TRQs had very low fill rates of 0-20 percent.
- Questions continue to be asked in the WTO regarding the transparency and administration of TRQs, underscoring the underlying basis of low fill rates.
The World Trade Organization (WTO) was formed in 1995 in part to improve market access for trade by negotiating the reduction or elimination of barriers that prohibited trade, such as quotas. One way this was done was through the establishment of tariff-rate quotas (TRQs). A TRQ is effective by limiting the quantity of goods allowed into a market at a low, in-quota rate. After the in-quota amount is filled, the product can still be imported but at a higher tariff. The TRQ allows for access to a market that might have been closed to exports, benefiting the exporter and consumers in the importing country. (See box below.)
After 25 years of use, it is uncertain whether tariff-rate quotas increase market access. More than 1,100 such agricultural TRQs have been available to WTO members, including the United States, but they cover about only 5 to 7 percent of the volume of global agricultural trade. Tariffs on agricultural commodities traded under TRQs are higher than those that are not. The rates at which the quotas are filled—fill rates—are mixed. Finally, WTO member countries continue to raise questions about the transparency and administration of these TRQs, which may underlie what is preventing their full adoption.
Who uses Tariff-Rate Quotas in the World Trade Organization?
Approximately 60 to 70 million metric tons of agricultural imports each year are traded under tariff-rate quotas in the WTO. Only one-fourth of the organization’s more than 160 member countries—the European Union (EU) is defined as a single member—use TRQs. They are used by both developed and developing countries, with developing countries self-identifying. Norway imposes the largest number of TRQs at 232, but its combined quota volume is relatively small. By comparison, the United States places TRQs on 54 products, with the largest one established for sugar.
The quota volume of imports under TRQs is another important metric used to measure market access because it indicates the volume of agricultural products that might be traded under the World Trade Organization’s TRQ structure. As seen in the table below, China and the EU combined account for a little more than half of the quota volume of WTO agricultural TRQs, with China’s TRQ for wheat being the single largest in the WTO at 9.6 million metric tons. China’s seven TRQs would total 25.3 million metric tons if they were filled. The EU quota volume is 19.4 million metric tons and is more than twice the next competitor country. In addition, a large portion of their TRQs are on meats, which have a higher value in the trade market. At the other extreme, New Zealand, Costa Rica, and El Salvador have very low quota volumes, as their markets are smaller.
| Number of Tariff-Rate Quotas | Quota size (Mt) | |
|---|---|---|
| Developed countries | ||
| EU | 124 | 19.43 |
| United States | 54 | 2.45 |
| Switzerland | 28 | 1.50 |
| Canada | 22 | 0.89 |
| Japan | 20 | 8.60 |
| New Zealand | 3 | 0.00 |
| Other developed countries | 19 | 0.29 |
| Developing countries | ||
| Colombia | 67 | 1.50 |
| South Korea | 67 | 9.03 |
| South Africa | 53 | 1.13 |
| Costa Rica | 27 | 0.00 |
| Thailand | 23 | 0.06 |
| Malaysia | 19 | 0.08 |
| Israel | 12 | 0.49 |
| El Salvador | 11 | 0.00 |
| China | 7 | 25.28 |
| Vietnam | 3 | 0.35 |
| Other developing countries | 228 | 13.61 |
| Notes: Countries are listed by most to fewest number of World Trade Organization (WTO) tariff-rate quotas (TRQs). Countries on the list of developing countries self-identify as such to the WTO. Smaller quotas may round to zero. Mt = million metric tons. Sources: USDA, Economic Research Service using data from the WTO. |
||
Tariffs on Commodities Traded Under Tariff-Rate Quotas Are Higher; Fill Rates Are Mixed
Products traded under TRQs tend to have higher tariffs than those that are not. While they were designed to replace often prohibitive trade barriers, the average in-quota tariff on these products is 30 percent compared with about 10 percent for all of agriculture. In addition, over-quota rates are 4.5 times higher than in-quota rates. Although over-quota rates for most countries tend to be higher than in-quota rates, some countries also have high in-quota rates. Others, such as Canada and South Korea, tend to have low in-quota rates but high over-quota rates. In terms of commodities, meat products (beef, pork, poultry) tend to have relatively higher in-quota rates, while grains (wheat, rice, corn, soybeans) tend to relatively higher over-quota rates.
| WTO member country | |||||||||||||||||||
|---|---|---|---|---|---|---|---|---|---|---|---|---|---|---|---|---|---|---|---|
| Commodity tariff rate | China | European Union |
South Korea |
Japan | United States |
Canada | |||||||||||||
| In-quota tariffs (percent) | |||||||||||||||||||
| Rice | 1 | 6 | 5 | 22 | |||||||||||||||
| Beef | 18 | 42 | 4 | 0 | |||||||||||||||
| Pork | 11 | 25 | |||||||||||||||||
| Poultry | 15 | 25 | 4 | ||||||||||||||||
| Dairy | 14 | 30 | 21 | 8 | 5 | ||||||||||||||
| Sugar | 15 | 7 | 20 | 6 | |||||||||||||||
| Over-quota tariffs (percent) | |||||||||||||||||||
| Rice | 65 | 59 | 513 | 258 | |||||||||||||||
| Beef | 127 | 40 | 26 | 27 | |||||||||||||||
| Pork | 31 | 25 | |||||||||||||||||
| Poultry | 37 | 31 | 192 | ||||||||||||||||
| Dairy | 47 | 98 | 265 | 25 | 254 | ||||||||||||||
| Sugar | 50 | 73 | 147 | 68 | |||||||||||||||
| Source: USDA, Economic Research Service analysis of data from the World Trade Organization and United Nations Comtrade. | |||||||||||||||||||
As shown in the table above, some commodities for certain countries have low or even no in-quota rates, increasing the likelihood that they fill their quota, while others have high rates. As such, fill rates—the percent of a quota that gets filled—across all World Trade Organization TRQs tend to be mixed. The fill rate is one measure to assess the market access performance of a TRQ. It indicates the extent to which a TRQ is being used to import the product relative to the scheduled quota volume. Most agricultural goods with TRQs do not exceed their quota volume and are traded using the in-quota tariff rate. In a sampling of WTO data from 2007- to 2015, less than half—40 percent—of agricultural products with TRQs had fill rates that exceeded 80 percent of their in-quota volume. On the other hand, 36 percent of TRQs had low fill rates of 0-20 percent (see figure below), indicating that the in-quota tariff is too high or demand is not sufficient.
WTO Member Questions About Tariff-Rate Quotas Spotlight Implementation Issues
While low demand may explain this low fill rate, administrative methods used to implement tariff-rate quotas could be responsible for TRQs not filling. Questions and comments raised in meetings of the WTO Committee on Agriculture reflected these concerns about the implementation of TRQs, particularly their underfilling. The members fielding the largest number of questions posed during committee meetings from 2007 to 2015 were Canada, China, Thailand, the EU, Japan, and South Korea (see figure below). These six countries combined received more than half of all the questions raised in the committee meetings about TRQ administration and its transparency.
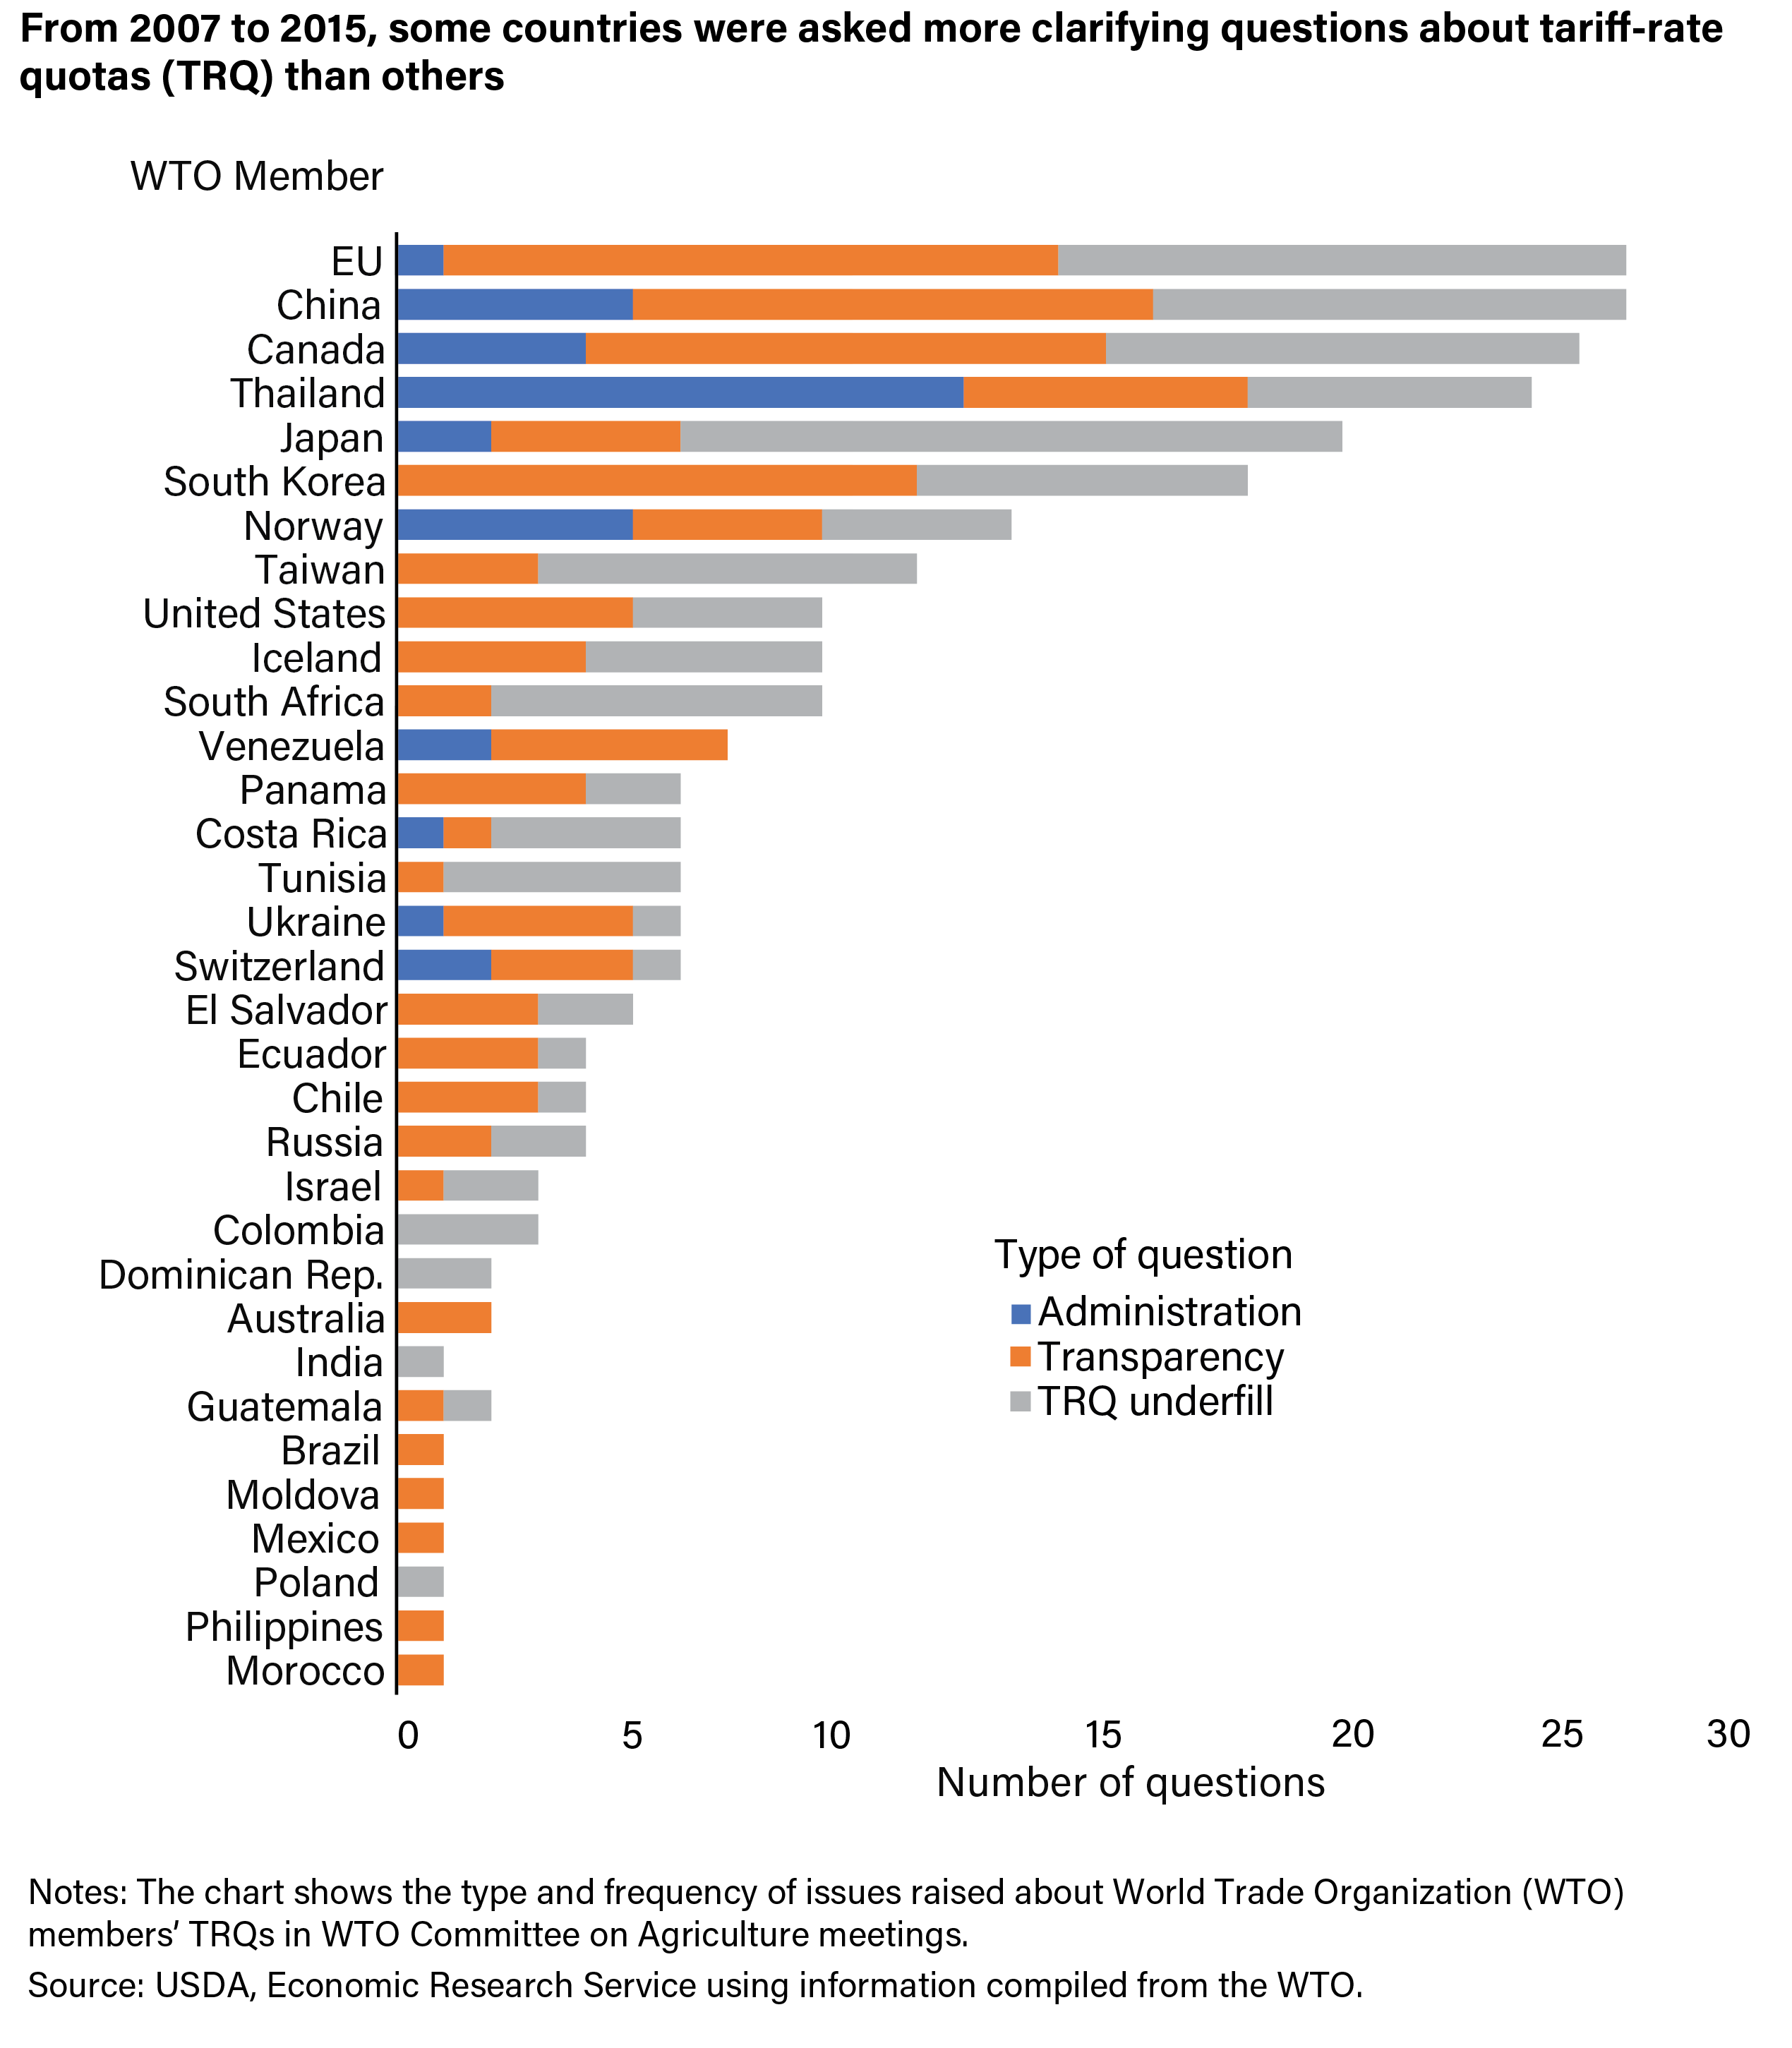
For example, Canada received many questions about its dairy TRQs, primarily about under-fill and transparency. Questions directed to China often addressed administrative procedures for allocating its grain TRQs. Thailand received the largest number of questions related to TRQ administration. Members often questioned the EU’s country-specific allocations for many quotas related to fruits, vegetables, and meats. For Japan, members noted the complexity of its quota allocation methods for items like butter and nonfat dry milk. Members commonly asked about South Korea’s under-filled TRQs and transparency administrative procedures. Questions were also asked about the U.S. TRQs for sugar and dairy products.
Because many comments noted specific issues about TRQ administration as the basis of low fill rates, members agreed to implement new provisions on TRQ administration as developed in the WTO’s Bali Ministerial Agreement of 2013. Additional obligations and guidelines on TRQ administration were later implemented, as well as monitoring and enforcement measures related to quota under-fill.
Categorizing Tariff-Rate Quota Fill Rates Provides a Summary of Market Access Conditions
The significant number of TRQs with low fill rates and the frequency of questions about low fill rates indicate persisting concerns about impediments to market access for commodities covered by these barriers. Researchers at USDA’s Economic Research Service evaluated detailed information compiled through WTO notifications and stratified how market access has evolved under the TRQ tariff scheme.
They found that TRQs can be classified into four regimes (see figure below) along two dimensions: one based on their fill rates, and the other based on the difference between domestic and foreign prices, also referred to as the domestic-border price differential

The largest number of TRQs (46 percent) fell in the “low demand” quadrant, indicated in the lower-left corner of the above chart in orange. These include two types of TRQs. One type includes TRQs for commodities with weak import demand because the country setting the TRQ is a competitive producer whose domestic prices for the commodity fall below international prices. Examples are TRQs for U.S. beef, Thai rice, Canadian wheat, and several categories of EU meat imports. Another group of “low demand” TRQs have high in-quota tariff rates that raise the cost of imports above domestic prices. Examples include Switzerland’s dairy TRQs and many of Iceland’s and Norway’s TRQs.
The smallest number of TRQs (13 percent) were in the “underutilized” quadrant (lower-right in red of the above chart). These are considered underutilized because market conditions suggest that the fill rate should be higher. Among the largest TRQs in this category are China’s TRQs for wheat, corn, and medium grain rice. Also in this quadrant are dairy, poultry and beef TRQs operated by Japan, Korea, Russia, the EU, Norway, and Vietnam, and the EU rice TRQ. Administrative issues in the quota or other policy barriers may be contributing to the under-fill rate.
More than 40 percent of TRQs with high fill rates are in the upper two quadrants of the chart above. These are almost evenly split between “binding” (22 percent) and “functional” (19 percent) TRQs.
The binding TRQs—those TRQs that are filled—in the upper-right quadrant (blue) include large TRQs for China long grain rice, sugar, and cotton; Japan corn and rice; Korea rice; and U.S. sugar. In this category, there is an insufficient quota to meet import demand, and over-quota rates could be too high, thus preventing additional imports. Other binding TRQs include dairy for Japan, Korea, Mexico, and Norway; beef for Norway, Russia, and Switzerland; pork for Russia; and sugar for Vietnam and South Africa.
The functional TRQs in the upper-left quadrant (green) include large TRQs, each exceeding 1 million tons for wheat in Japan and the EU, sugar for the EU, and edible oils for Korea. In this category, TRQs have filled quotas, and over-quota imports are occurring. Nevertheless, market access might still be improved by lowering over-quota rates or expanding the in-quota amount. Other products in this quadrant included corn for Colombia, South Africa, and the EU; dairy for Colombia, South Africa, Iceland, and the United States; beef for Colombia, Zimbabwe, the EU, Iceland, Israel, and Norway; sugar in the EU and Colombia; and poultry for the EU and Iceland.
One of the WTO’s key achievements was replacing often-prohibitive trade barriers with a base level of minimum market access through TRQs. While TRQs were intended to increase market access for agricultural products, they sometimes limit trade because of prohibitively high tariff rates, limited quota volumes, and administrative inefficiencies and requirements.
This article is drawn from:
- Beckman, J., Gale, F. & Lee, T. (2021). Agricultural Market Access Under Tariff-Rate Quotas. U.S. Department of Agriculture, Economic Research Service. ERR-279.