
Updated Food Access Research Atlas Now Maps Changes in Low-Income and Low-Supermarket Access Areas in 2019
- by Alana Rhone
- 6/17/2021
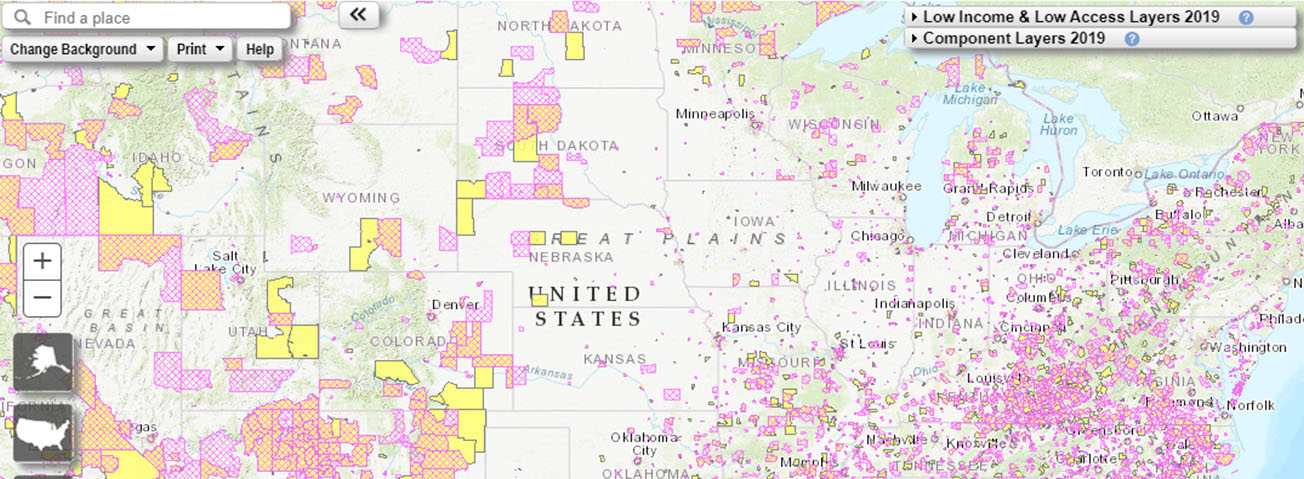
USDA, Economic Research Service (ERS) provides a glimpse into neighborhood access to supermarkets and other large stores that offer a variety of affordable food through its Food Access Research Atlas (FARA). With a recent update to the atlas, users can now map low-income and other census tracts in the United States using different measures of accessibility to supermarkets in 2019 and can compare the results with those in 2015. Users may also download the data to analyze State, county, and additional demographic information on food access.
The FARA mapping tool uses supermarkets, supercenters, and large grocery stores to gauge the number of stores that sell a wide variety of foods needed for a healthy diet at affordable prices. ERS combined two nationwide directories of these types of stores to update the atlas for 2019. ERS does not include smaller grocery stores, drug stores, dollar stores, convenience stores, military commissaries, and club stores in the atlas because of limited data availability. Also, those types of stores do not consistently offer a wide variety of nutritious foods; they may have restrictions on who can shop in the store or may require a membership fee. With the mapping tool, users can identify areas in which a significant number or a high proportion of residents have low access to affordable and nutritious food based on a combination of income, vehicle access, or distance to a store that offers a wide variety of food choices.
In the FARA, a census tract can be designated as Low Income and Low Access (LILA) based on a variety of factors. Low-income status is based on a census tract’s poverty rate or median family income using data from the 2014-18 American Community Survey. Low access to supermarkets is characterized by the number and share of people at different distances from the nearest supermarket, supercenter, or large grocery store and the number of housing units in the area without access to a vehicle that are more than ½ mile from one of these stores. FARA users can map four measures of low supermarket access for low-income census tracts:
- LILA at 1 mile and 10 miles: A significant number or share of residents is more than 1 mile (urban) or 10 miles (rural) from the nearest supermarket.
- LILA at ½ mile and 10 miles: A significant number or share of residents is more than ½ mile (urban) or 10 miles (rural) from the nearest supermarket.
- LILA at 1 mile and 20 miles: A significant number or share of residents is more than 1 mile (urban) or 20 miles (rural) from the nearest supermarket.
- LILA Using Vehicle Access: More than 100 housing units do not have a vehicle and are more than ½ mile from the nearest supermarket, or a significant number or share of residents are more than 20 miles from the nearest supermarket.
Vehicle availability is an important measure of how readily a household can access a supermarket. From 2015 to 2019, the number of census tracts that were in the LILA Using Vehicle Access category decreased 6.8 percent. The decrease is a result of reductions in the number of low-income census tracts and in the number of households without a vehicle residing more than ½ mile from a supermarket.
By 2019, there was a net decrease of 743 U.S. census tracts that qualified as LILA Using Vehicle Access: 3,833 were LILA in 2015 but were no longer LILA in 2019, and 3,090 became LILA between 2015 and 2019. Of the 3,833 tracts that were no longer LILA, 69 percent (2,634) remained low income but had improved access, and 19 percent (710) remained low access but had improved incomes. For the remaining 13 percent (489), incomes and supermarket access both improved by 2019.
| Definition | Number of tracts |
|---|---|
| Tracts that remained LILA Using Vehicle Access from 2015 to 2019 |
7,036 |
| LILA in 2015 but not in 2019: | |
| Low income, but no longer low access, in 2019 |
2,634 |
| Low access, but no longer low income, in 2019 |
710 |
| Not low access nor low income in 2019 | 489 |
| No longer LILA Using Vehicle Access tracts | 3,833 |
| LILA in 2019 but not in 2015: | |
| Low income, but not low access, in 2015; became low access in 2019 | 2,100 |
| Low access, but not low income, in 2015; became low income in 2019 | 642 |
| Not low access nor low income in 2015; became low income and low access in 2019 | 348 |
| New LILA Using Vehicle Access tracts | 3,090 |
| Total LILA Using Vehicle Access tracts in 2019 | 10,126 |
| Total U.S. populated census tracts | 72,531 |
| Note: LILA Using Vehicle Access = more than 100 housing units do not have a vehicle and are more than 1/2 mile from the nearest supermarket, or a significant number or share of residents are more than 20 miles from the nearest supermarket. | |
| Source: USDA, Economic Research Service calculations using data from the 2010 Decennial Census and the 2014-18 American Community Survey. | |
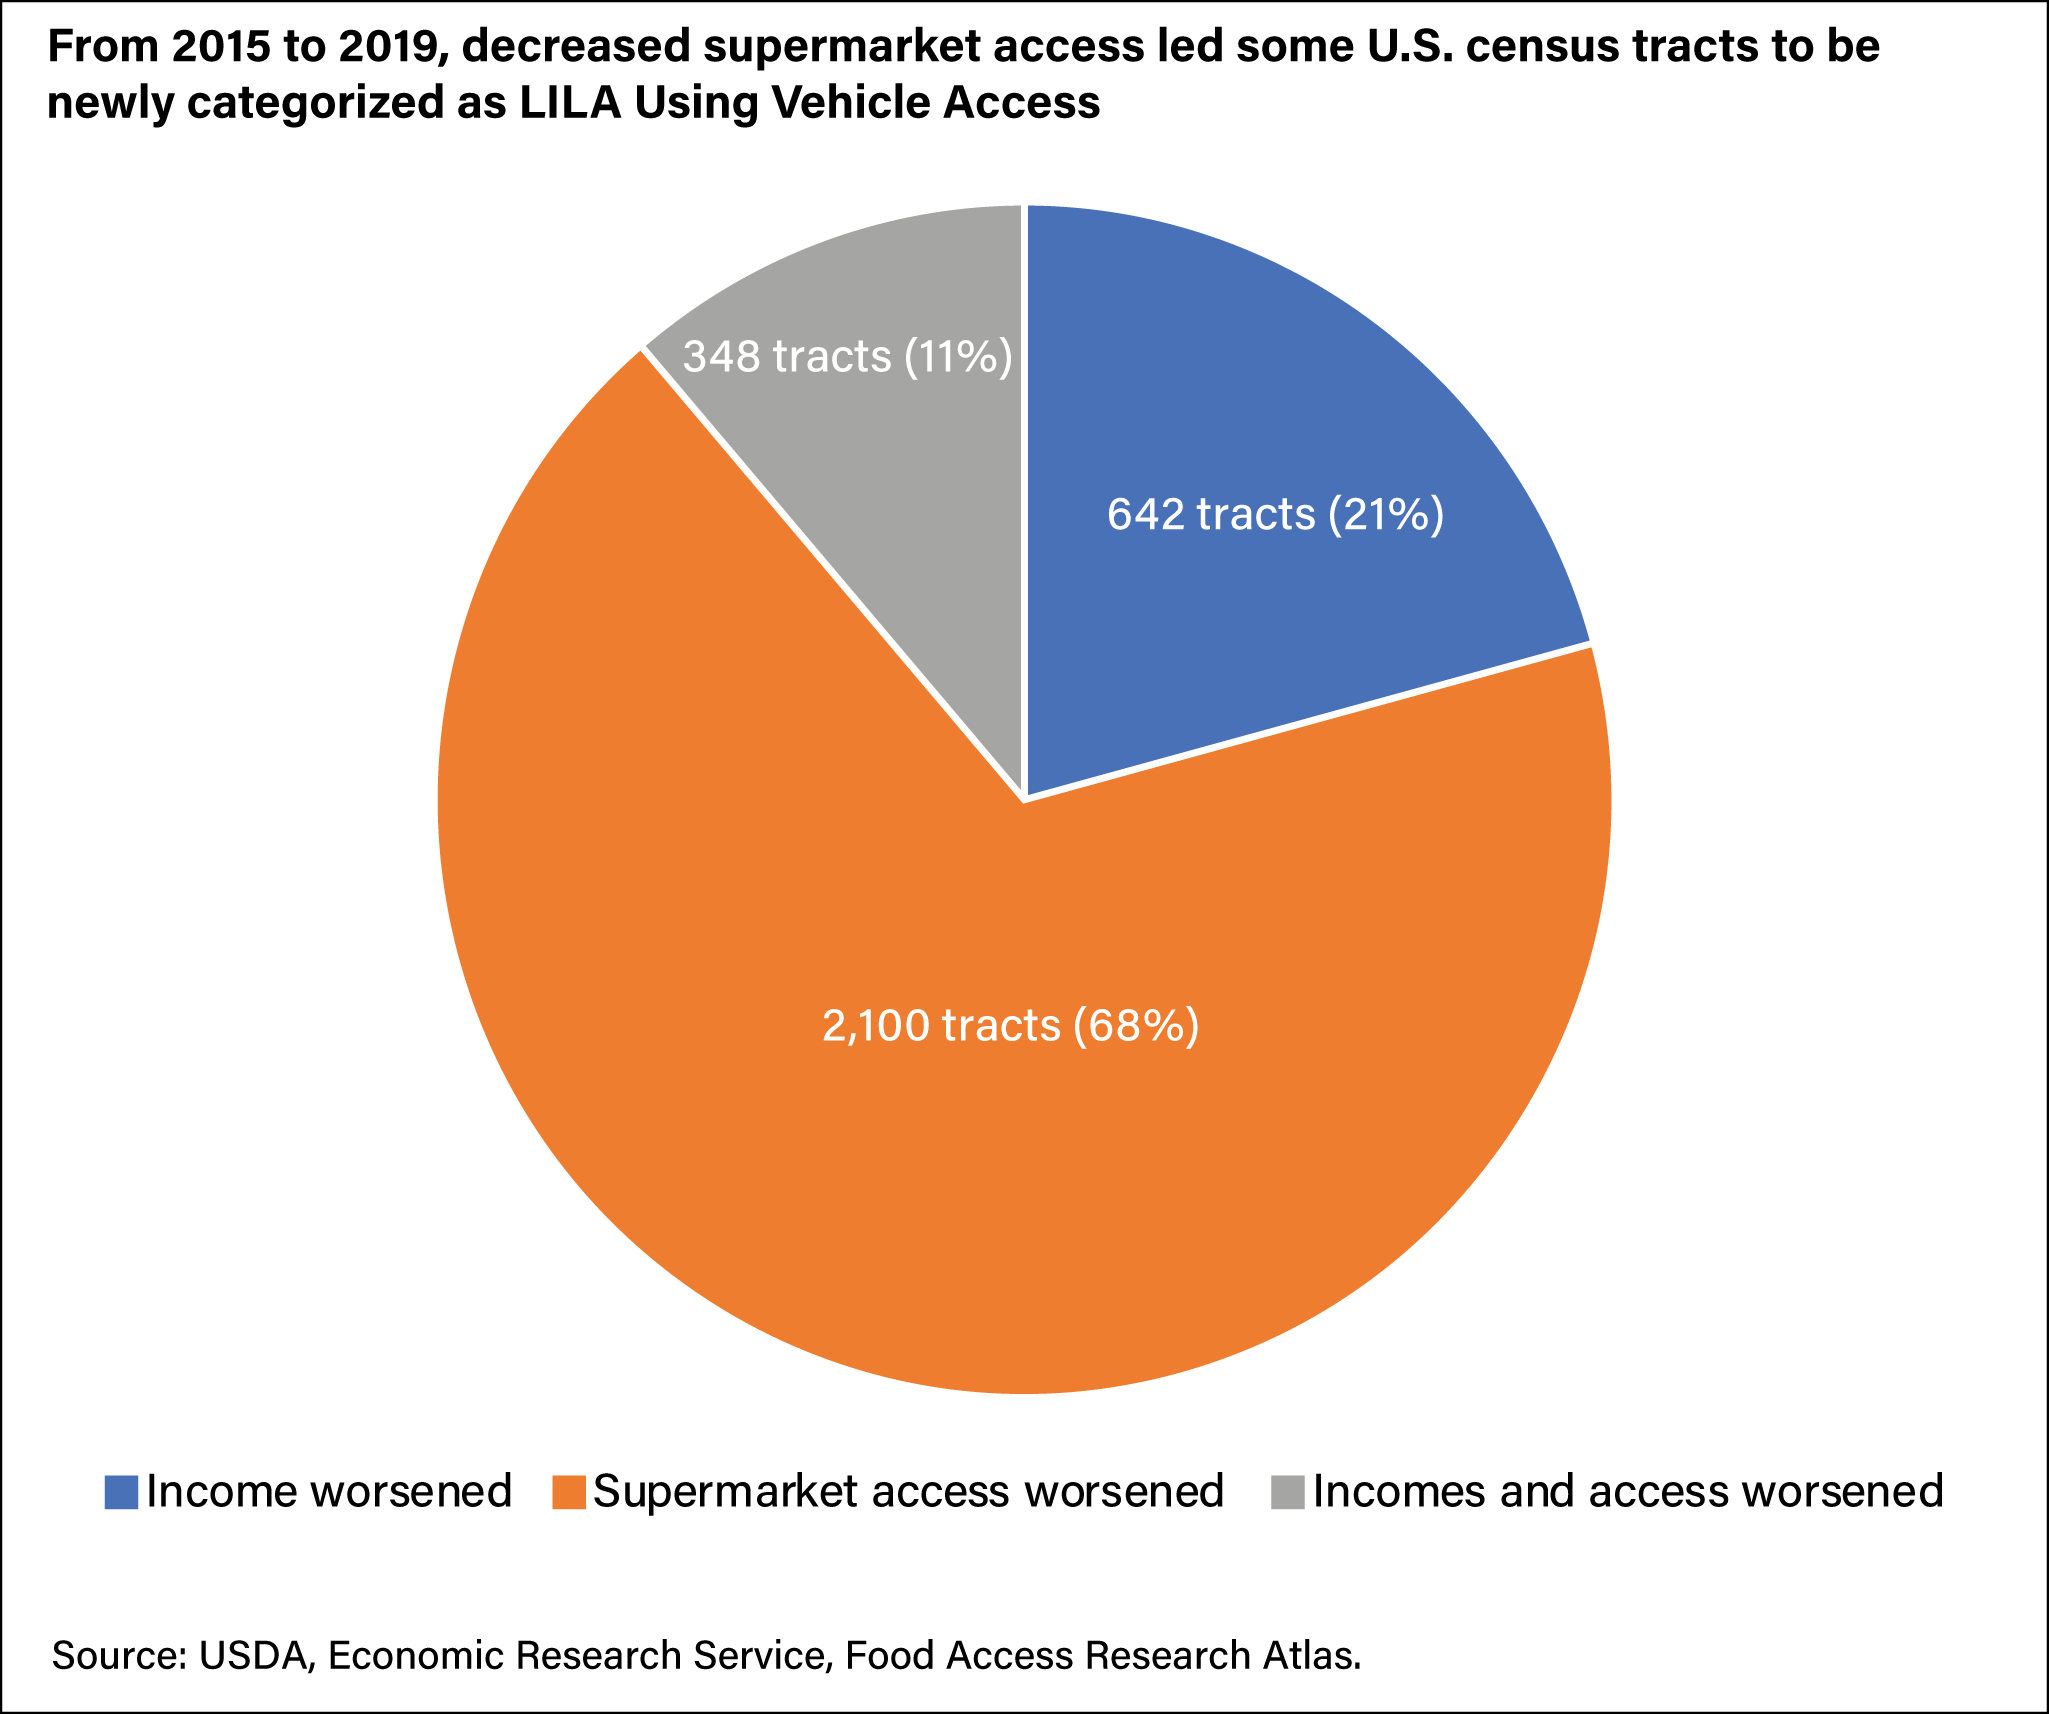
Among the 3,090 census tracts that became LILA in 2019, 68 percent (2,100) showed a decline in access, income dropped in 21 percent (642), and both statuses declined in 11 percent (348).
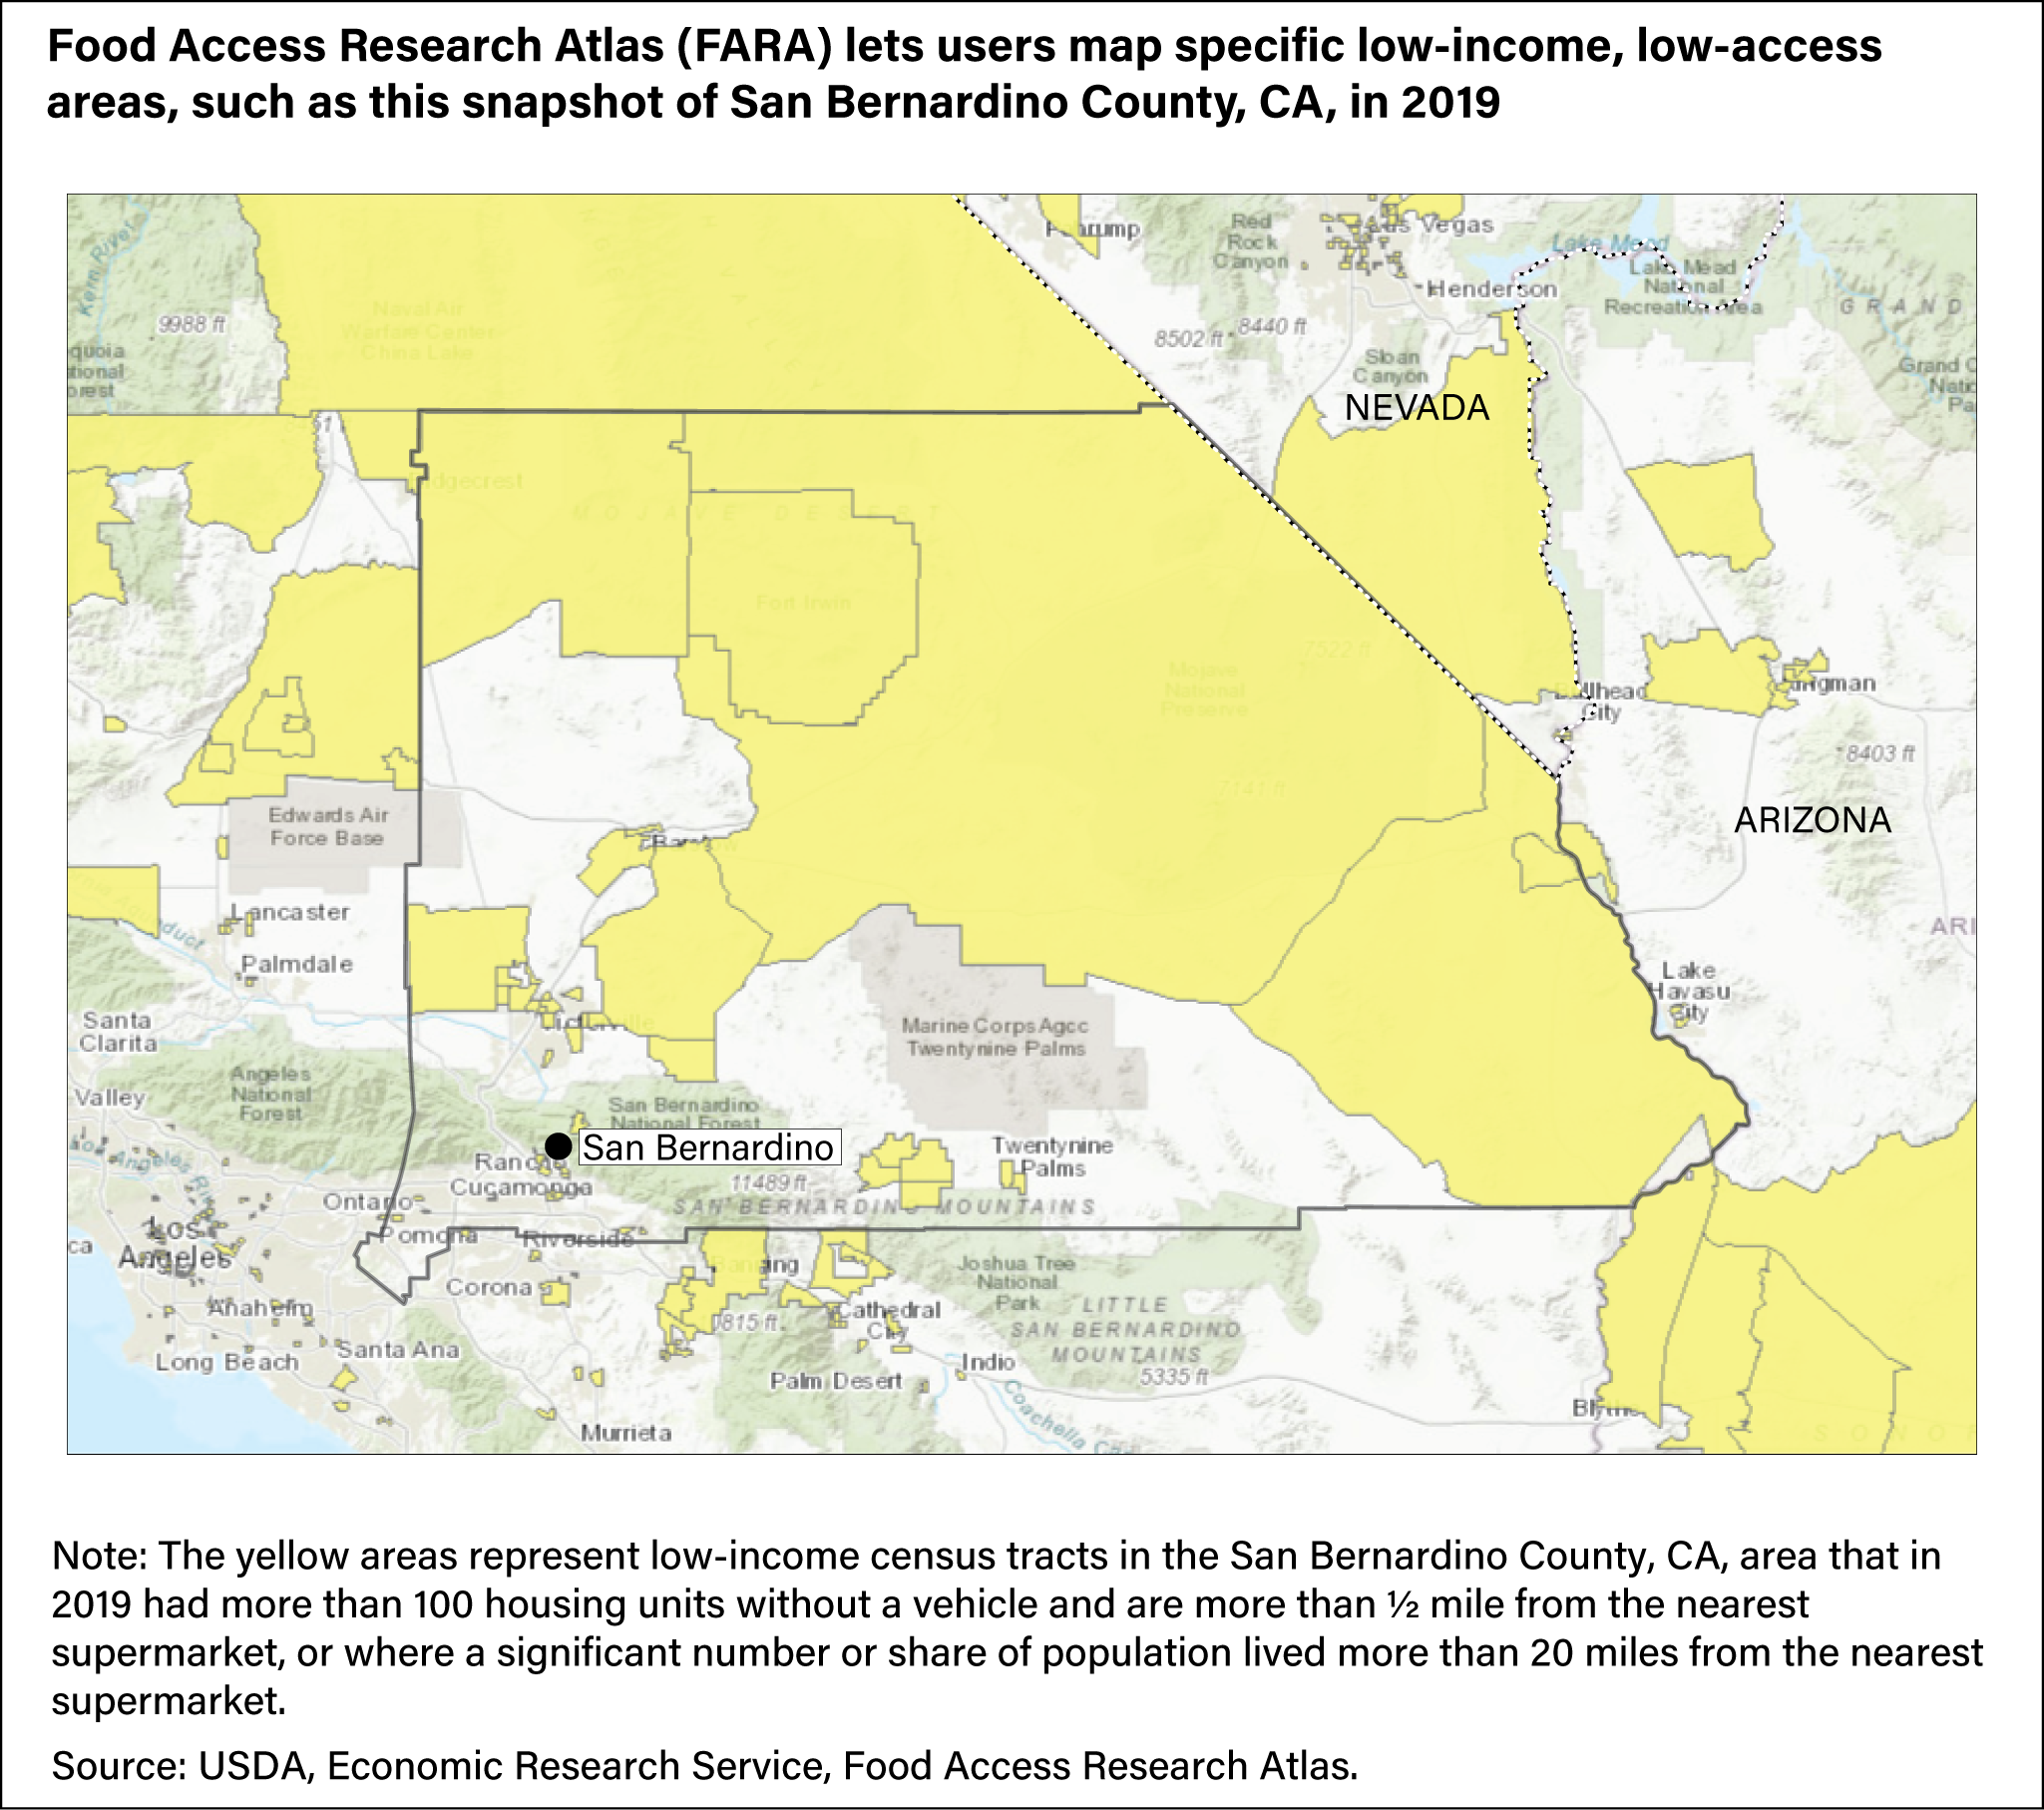
The yellow shaded areas on the map (below) of San Bernardino County, CA, illustrate how FARA can show low-income and low-access tracts with a substantial number of vehicle-less households more than ½ mile from the nearest supermarket or with a significant number or share of residents more than 20 miles from the nearest supermarket in 2019. Overall, 14 percent of households (85,278 households, representing 263,968 people) in the county resided in low-income tracts, lived more than ½ mile from a supermarket, and reported no access to a vehicle, or where a significant number or share of the population lived more than 20 miles from a supermarket. Nationally, 14.5 percent of all households in the United States resided in low-income tracts, lived more than ½ mile from a supermarket, and reported no access to a vehicle, or where a significant number or share of the population lived more than 20 miles from a supermarket in 2019.
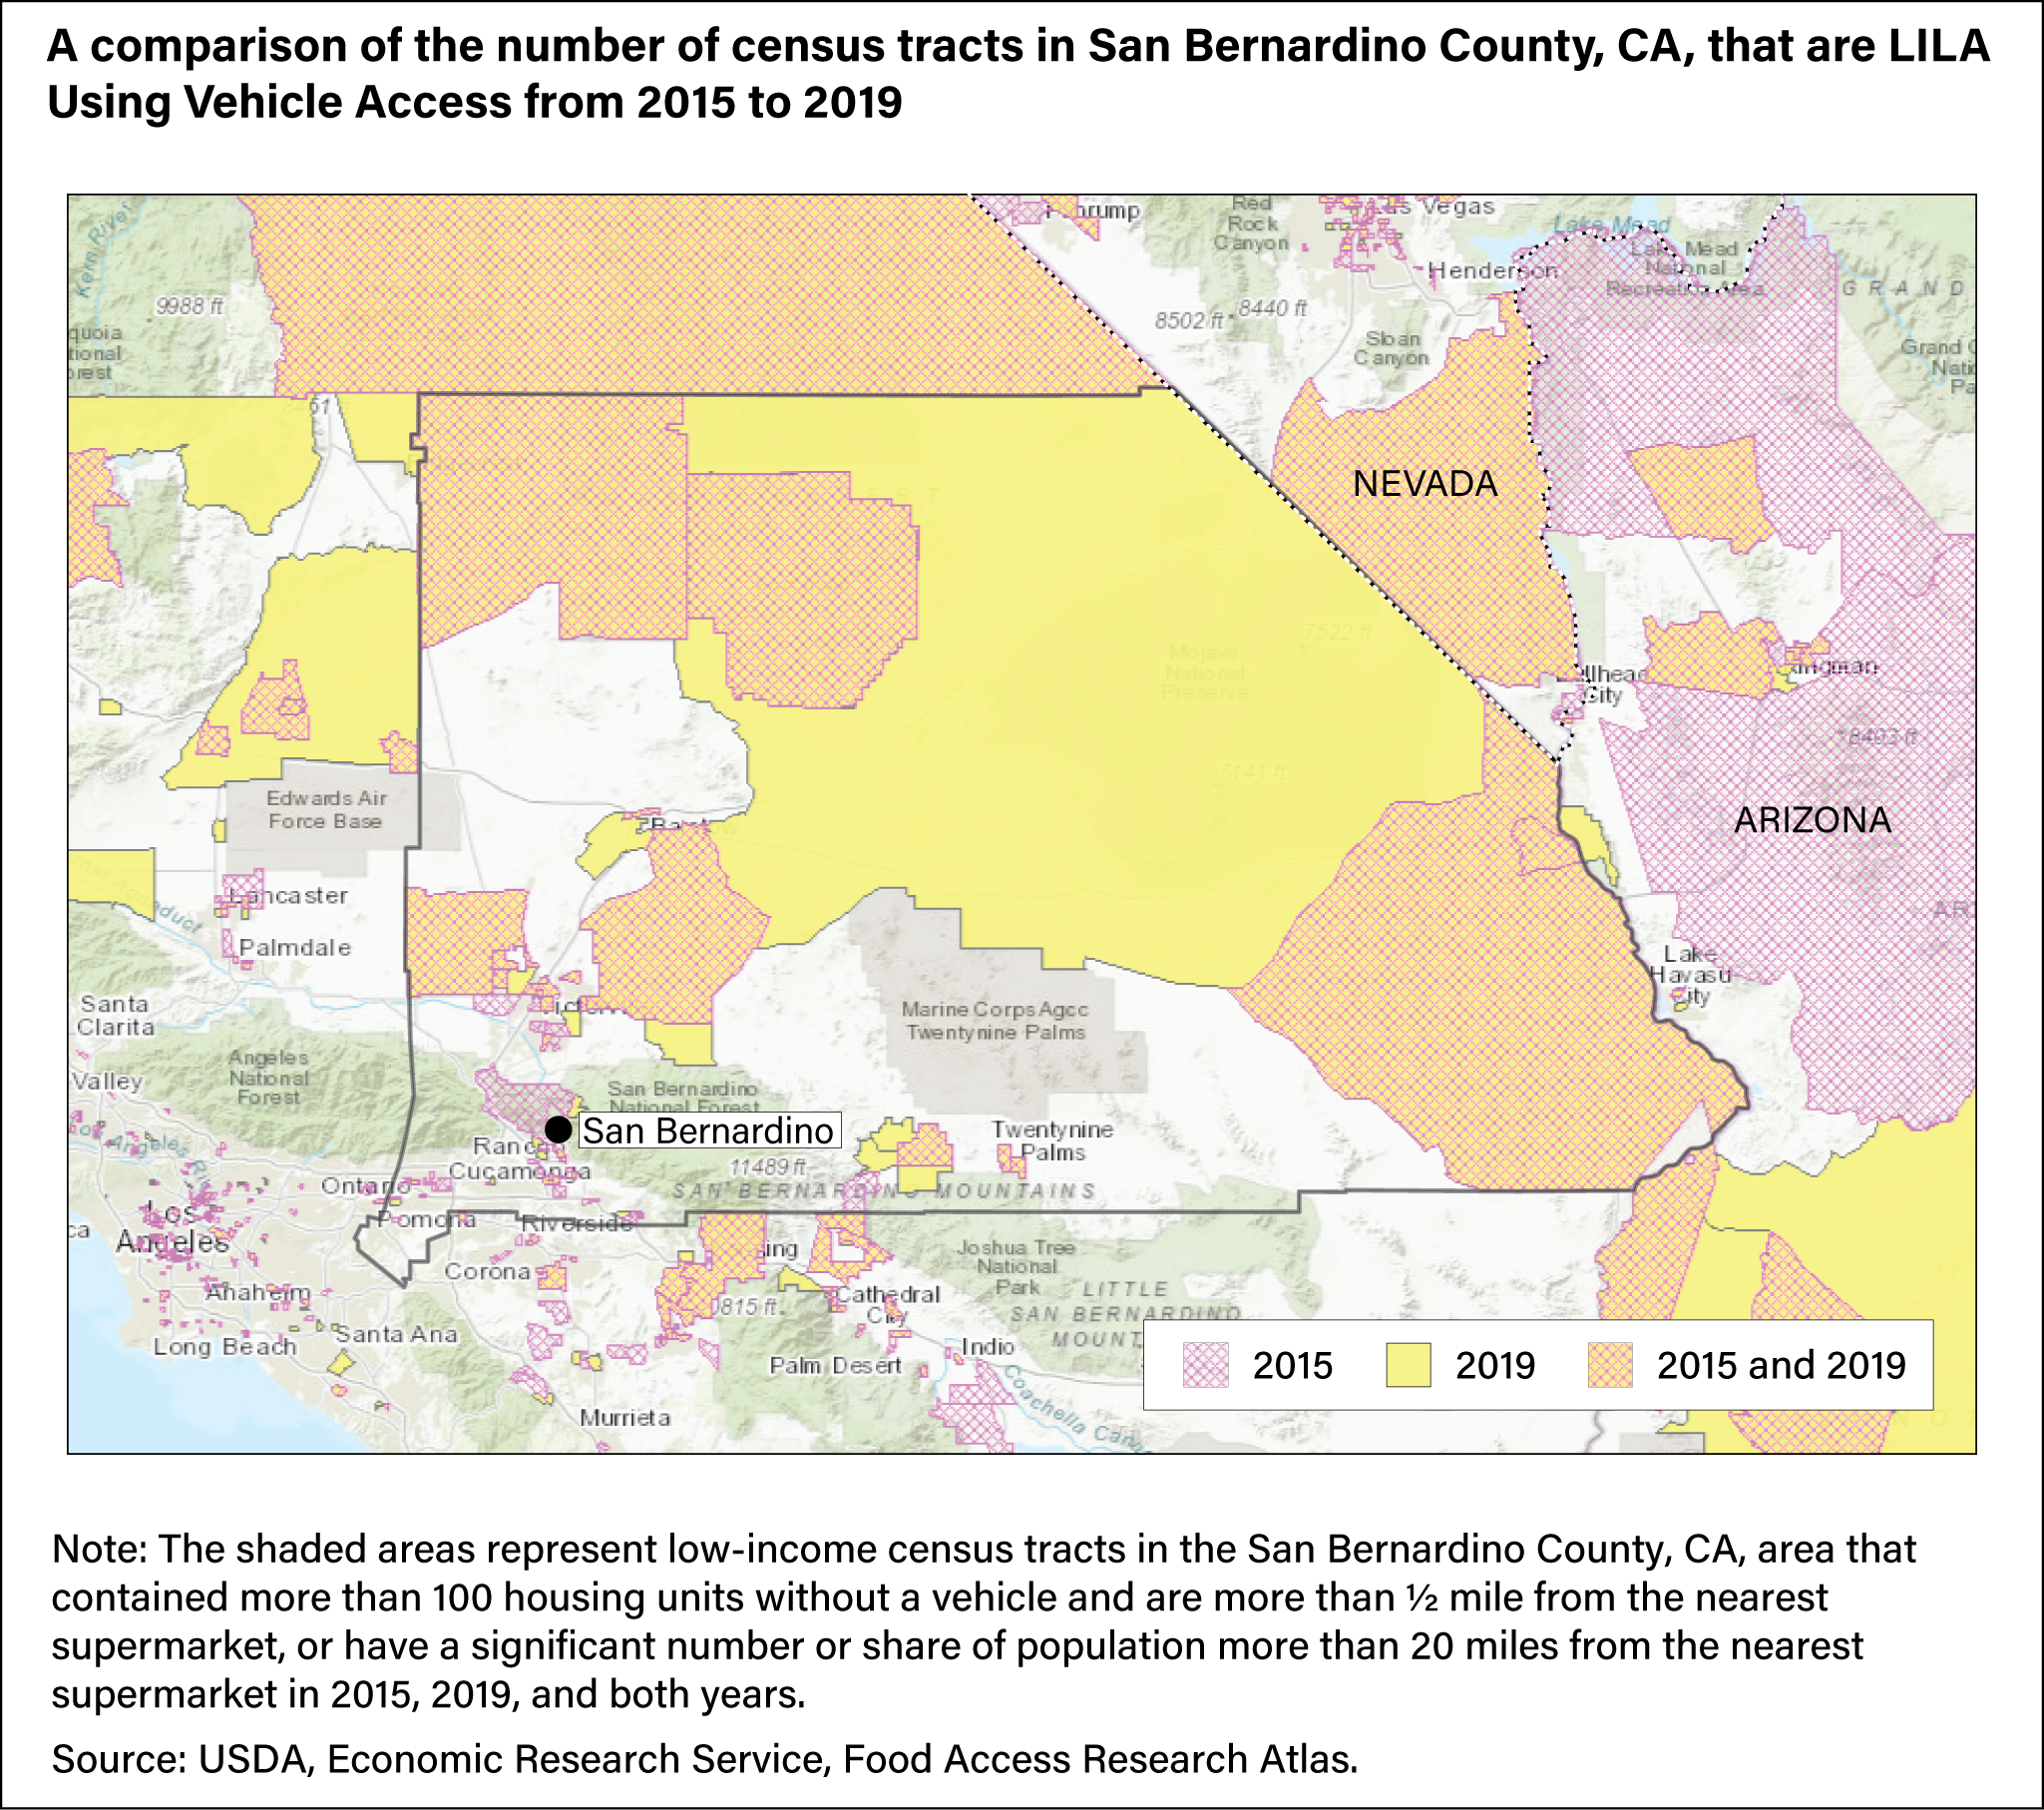
The map below illustrates how FARA users can compare one measure of LILA for a specific area in 2015 and 2019. In this map, again using San Bernardino County as an example, census tracts that are low income and low access using vehicle access are indicated using purple hash marks for 2015 and yellow shading for 2019. The orange shading is for areas that retained that status in both years. In San Bernardino County, the number of these census tracts decreased from 54 in 2015 to 46 in 2019. Furthermore, the number of vehicle-less households more than ½ mile from the nearest supermarket decreased 10 percent over this period.
This article is drawn from:
- Food Access Research Atlas. (n.d.). U.S. Department of Agriculture, Economic Research Service.