
State Agricultural Trade Statistics by Country of Origin and Destination Now Available on USDA, Economic Research Service Website
- by Bart Kenner and Sara Scott
- 4/2/2021
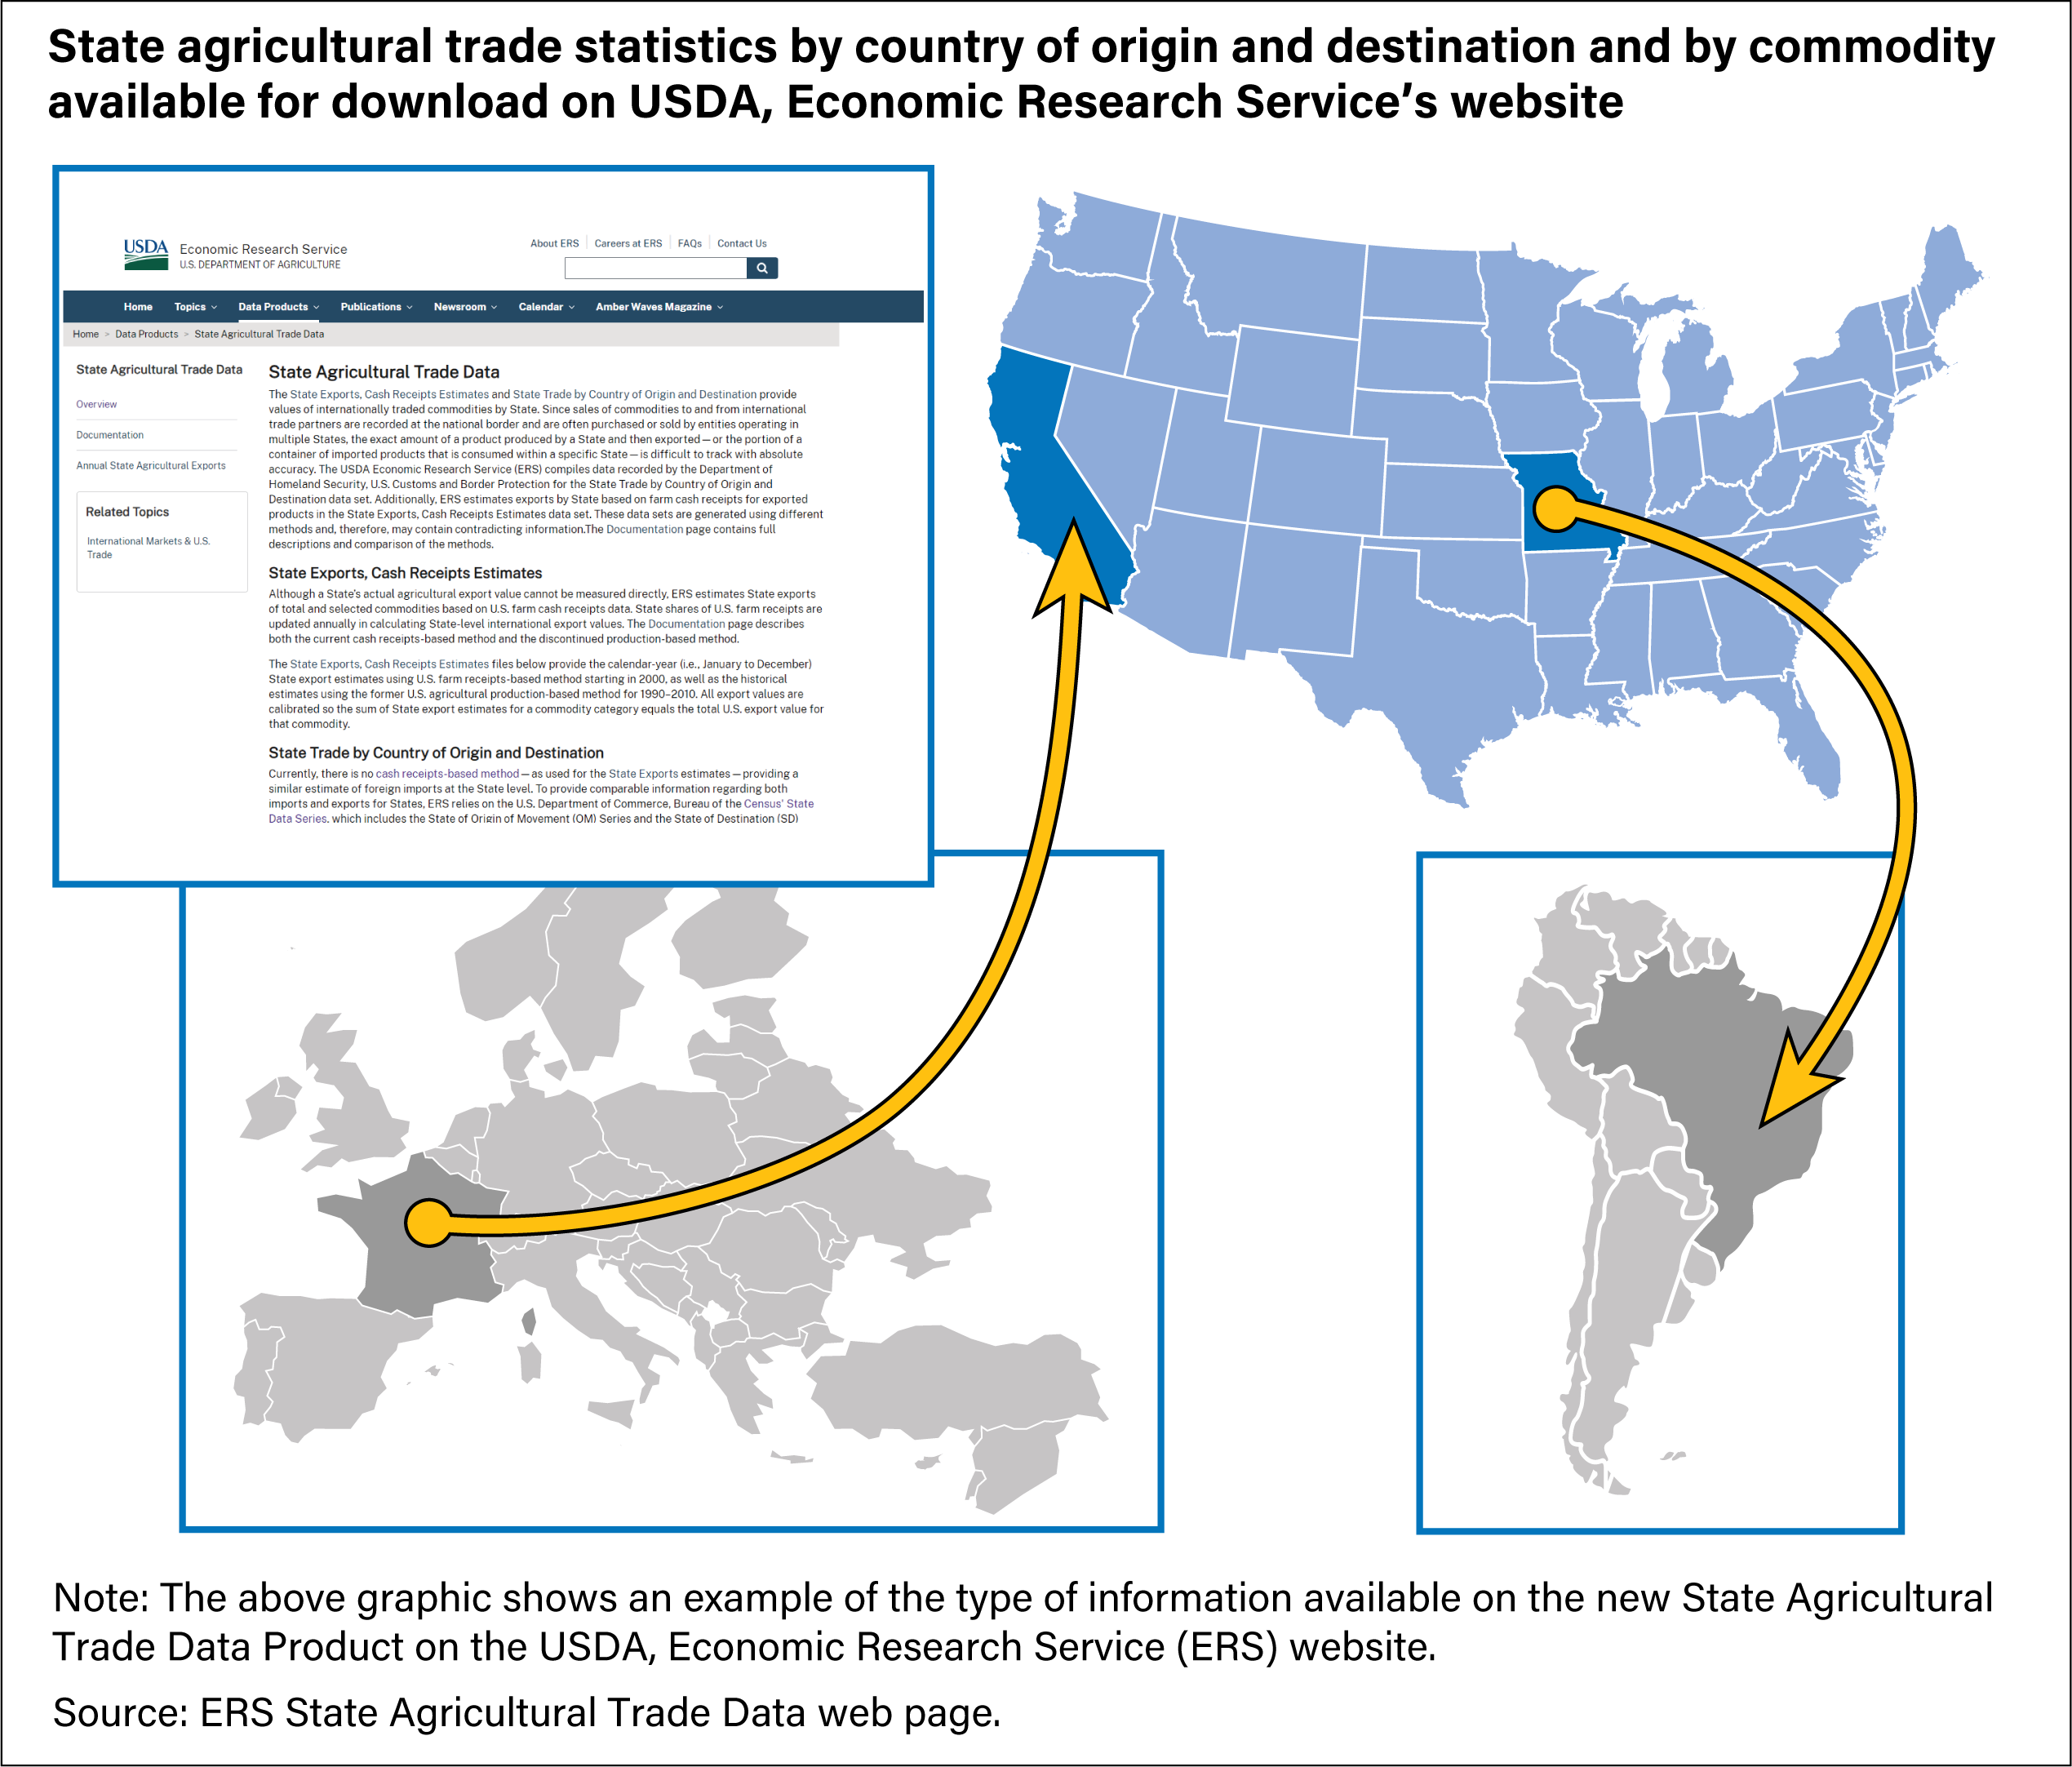
Did you know that Arkansas shipped more rice to Haiti in fiscal year 2020 than to any other country? Or that Illinois imported $3.4 billion worth of beer from Mexico that same year? You can now access State-based facts like these in a downloadable data product on USDA’s Economic Research Service (ERS) State Trade by Country of Origin and Destination web page.
Each October dating back to the 1970s, ERS has estimated the annual value of every State’s exports of agricultural commodities to foreign countries under the State Exports, Cash Estimates data series, formerly titled the State Agricultural Exports data series. However, these data have only been available for the calendar year and have not included information on the country of destination of those exports.
In September 2020, ERS began publishing data to complement the State Exports, Cash Receipts data series. The new State Trade by Country of Origin and Destination data series provides quarterly State data for the value of internationally traded commodities each State imports and exports the most, and which countries are on the other end of those transactions. Results can be accessed on the ERS website and downloaded in Excel or comma separated variable (CSV).
The State Trade by Country of Origin and Destination data set uses State data from the U.S. Department of Commerce, Bureau of the Census. These series report State exports and imports for farm products based on the last recorded point or location before transport to or from the port, such as farms, silos, packers, factories, or warehouses. In this approach, commodities are attributed to the State where they are consolidated for shipment or distribution, rather than to the State in which they are produced or imported. While statistics may include what is produced in a State, the series can also distort data for States where major ports are located, such as Louisiana and New York. For that reason, calculation of a trade balance using the State Trade Data product is discouraged.
With quarterly data for each State, users can monitor fluctuations in the value and mix of internationally traded agricultural commodities consumed or exported by a State over time. Shocks to the agricultural sector, such as natural disasters or changes in trade policy, can be evaluated in terms of products bought or sold across international lines at the State level. Data will be updated as the Census Bureau revises its data, including an update of the previous 3 calendar years’ data each September following the 3-year Census Bureau revision in July. In addition to this new State trade data series, the legacy data series, State Exports, Cash Receipts Estimates will also continue to be updated annually.
This article is drawn from:
- State Agricultural Trade Data. (n.d.). U.S. Department of Agriculture, Economic Research Service.
You may also like:
- Foreign Agricultural Trade of the United States (FATUS). (n.d.). U.S. Department of Agriculture, Economic Research Service.
- Farm Income and Wealth Statistics - Data Files: U.S. and State-Level Farm Income and Wealth Statistics. (n.d.). U.S. Department of Agriculture, Economic Research Service.