
Free School Lunch, Breakfast Participation Rose Between 2009 and 2019
- by Joanne Guthrie
- 10/5/2020
As U.S. children and teenagers returned to school in fall 2020, many schools implemented online distance learning, either as the entire instructional approach or mixed with some days in school, as a result of the COVID-19 pandemic. These actions limit the number of days children are in school and school cafeterias. To make sure children can still receive healthy USDA school meals, USDA extended waivers used in spring and summer 2020, which allow schools to distribute “grab and go” meals through USDA’s Summer Food Service Program and Seamless Summer Option, into the school year beginning fall 2020. These waivers also allow schools to serve meals for free to all children, not just those certified for free meals on the basis of low household income as is usual for the National School Lunch Program (NSLP) and School Breakfast Program (SBP).
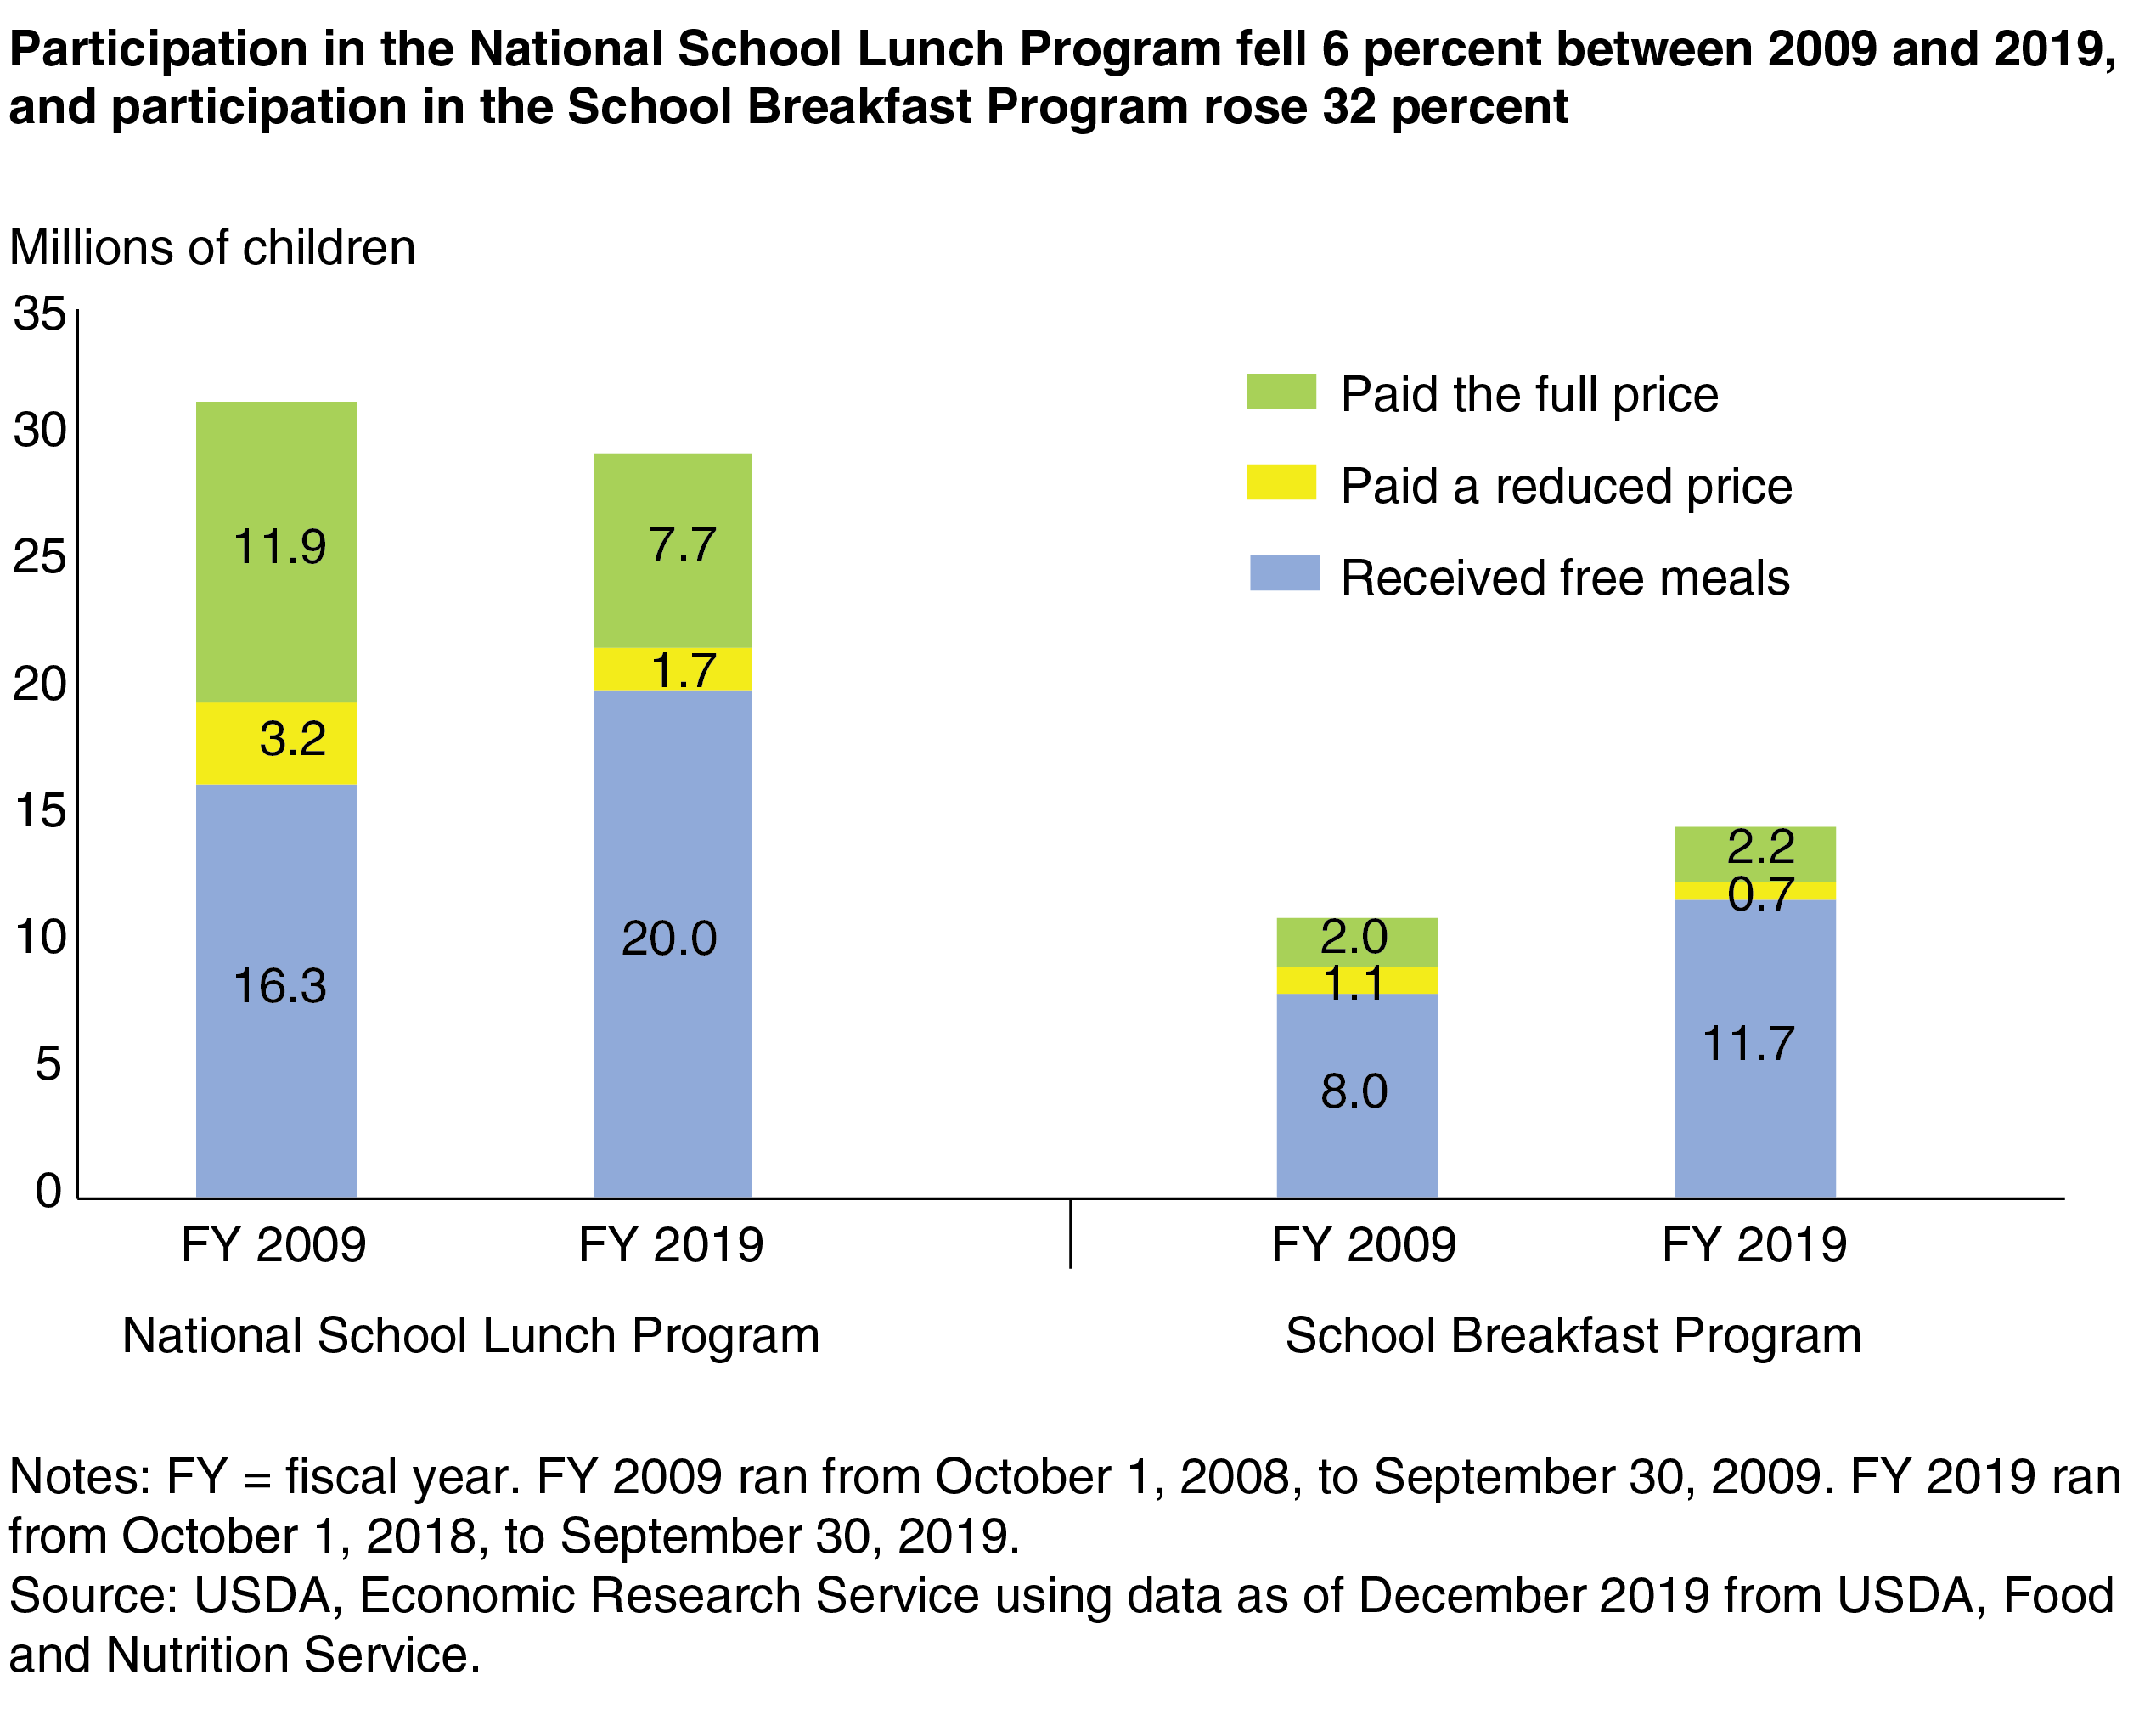
Before the spring 2020 school closings in response to the COVID-19 pandemic, more than 29 million children participated in the NSLP and close to 15 million participated in the SBP on a typical school day. Children from families with incomes at or below 130 percent of Federal poverty guidelines are eligible for free meals, and those from families with incomes between 130 and 185 percent of poverty guidelines are eligible for reduced-price meals. Children from higher income families pay what is called a “full price,” although their meals are subsidized by USDA to a small extent. In the decade between 2009 and 2019—a period that included the Great Recession and economic recovery—the number of children receiving free lunches and breakfasts grew.
The number of children receiving free lunches on a typical school day increased from 16.3 million in 2009 to 20 million in 2019. However, this was offset by a drop in reduced- and full-price meal participation, which decreased by 1.5 million and 4.2 million, respectively. As a result, total NSLP participation declined by about 2 million, with free lunch participation making up 68 percent of total participation in 2019, compared with 52 percent in 2009.
Between 2009 and 2019, free breakfast participation rose by 3.7 million and full-price breakfast participation rose by 0.2 million. This offset the 0.4-million decline in reduced-price breakfast participation, resulting in a 3.5-million increase in total SBP participation. In both 2009 and 2019, SBP served primarily students from low-income households, with 72 percent of participants receiving free breakfast in 2009 and 80 percent in 2019.
Increased free lunch and breakfast participation may be related to the establishment of the Community Eligibility Provision, as part of the Healthy, Hunger-Free Kids Act of 2010. The provision allows eligible schools that serve high concentrations of students from low-income households to offer breakfast and lunch at no charge to all students. Several factors may account for the drop in NSLP participation by students certified for reduced- and full-price meals. The 2007-09 recession caused a loss of income for many students’ families, making students formerly certified for reduced- or full-priced meals eligible for free lunches. In addition, many school districts increased the prices they charged for full-price lunches after 2011, in response to new requirements that schools cover costs of full-price meals without using Federal free and reduced-price meal subsidies.
This article is drawn from:
- Child Nutrition Programs. (n.d.). U.S. Department of Agriculture, Economic Research Service.
- Tiehen, L. (2020). The Food Assistance Landscape: Fiscal Year 2019 Annual Report. U.S. Department of Agriculture, Economic Research Service. EIB-218.