

U.S. Farmers Planting Less Wheat, But Sowings of Winter Varieties Stay Stable
- by Jennifer K. Bond
- 6/9/2020
Wheat is the leading food grain produced in the United States; however, the wheat sector has steadily shrunk over the last 40 years. Starting in the early 1980s, U.S. farm policy and programs gave wheat farmers incentives to idle their land. The 1996 and 2002 Farm Acts further enhanced planting flexibility, lowering wheat sowings as farmers increasingly opted to plant more profitable grains, usually corn and soybeans. Even as U.S. farm acres have diversified out of wheat, the relative shares of sowings, production, and use by class of wheat, have been relatively constant.
U.S. wheat planted area trends lower as winter wheat’s share of plantings remains stable
In the 1990s, wheat plantings averaged about 72 million acres before dropping over the next two decades to an average of 53 million acres, as shown in the figure. Continuing the trend of retrenchment, area planted to wheat for the 2020 marketing year (June through May) is forecast at 44.7 million acres and, if realized, will be the smallest on record.
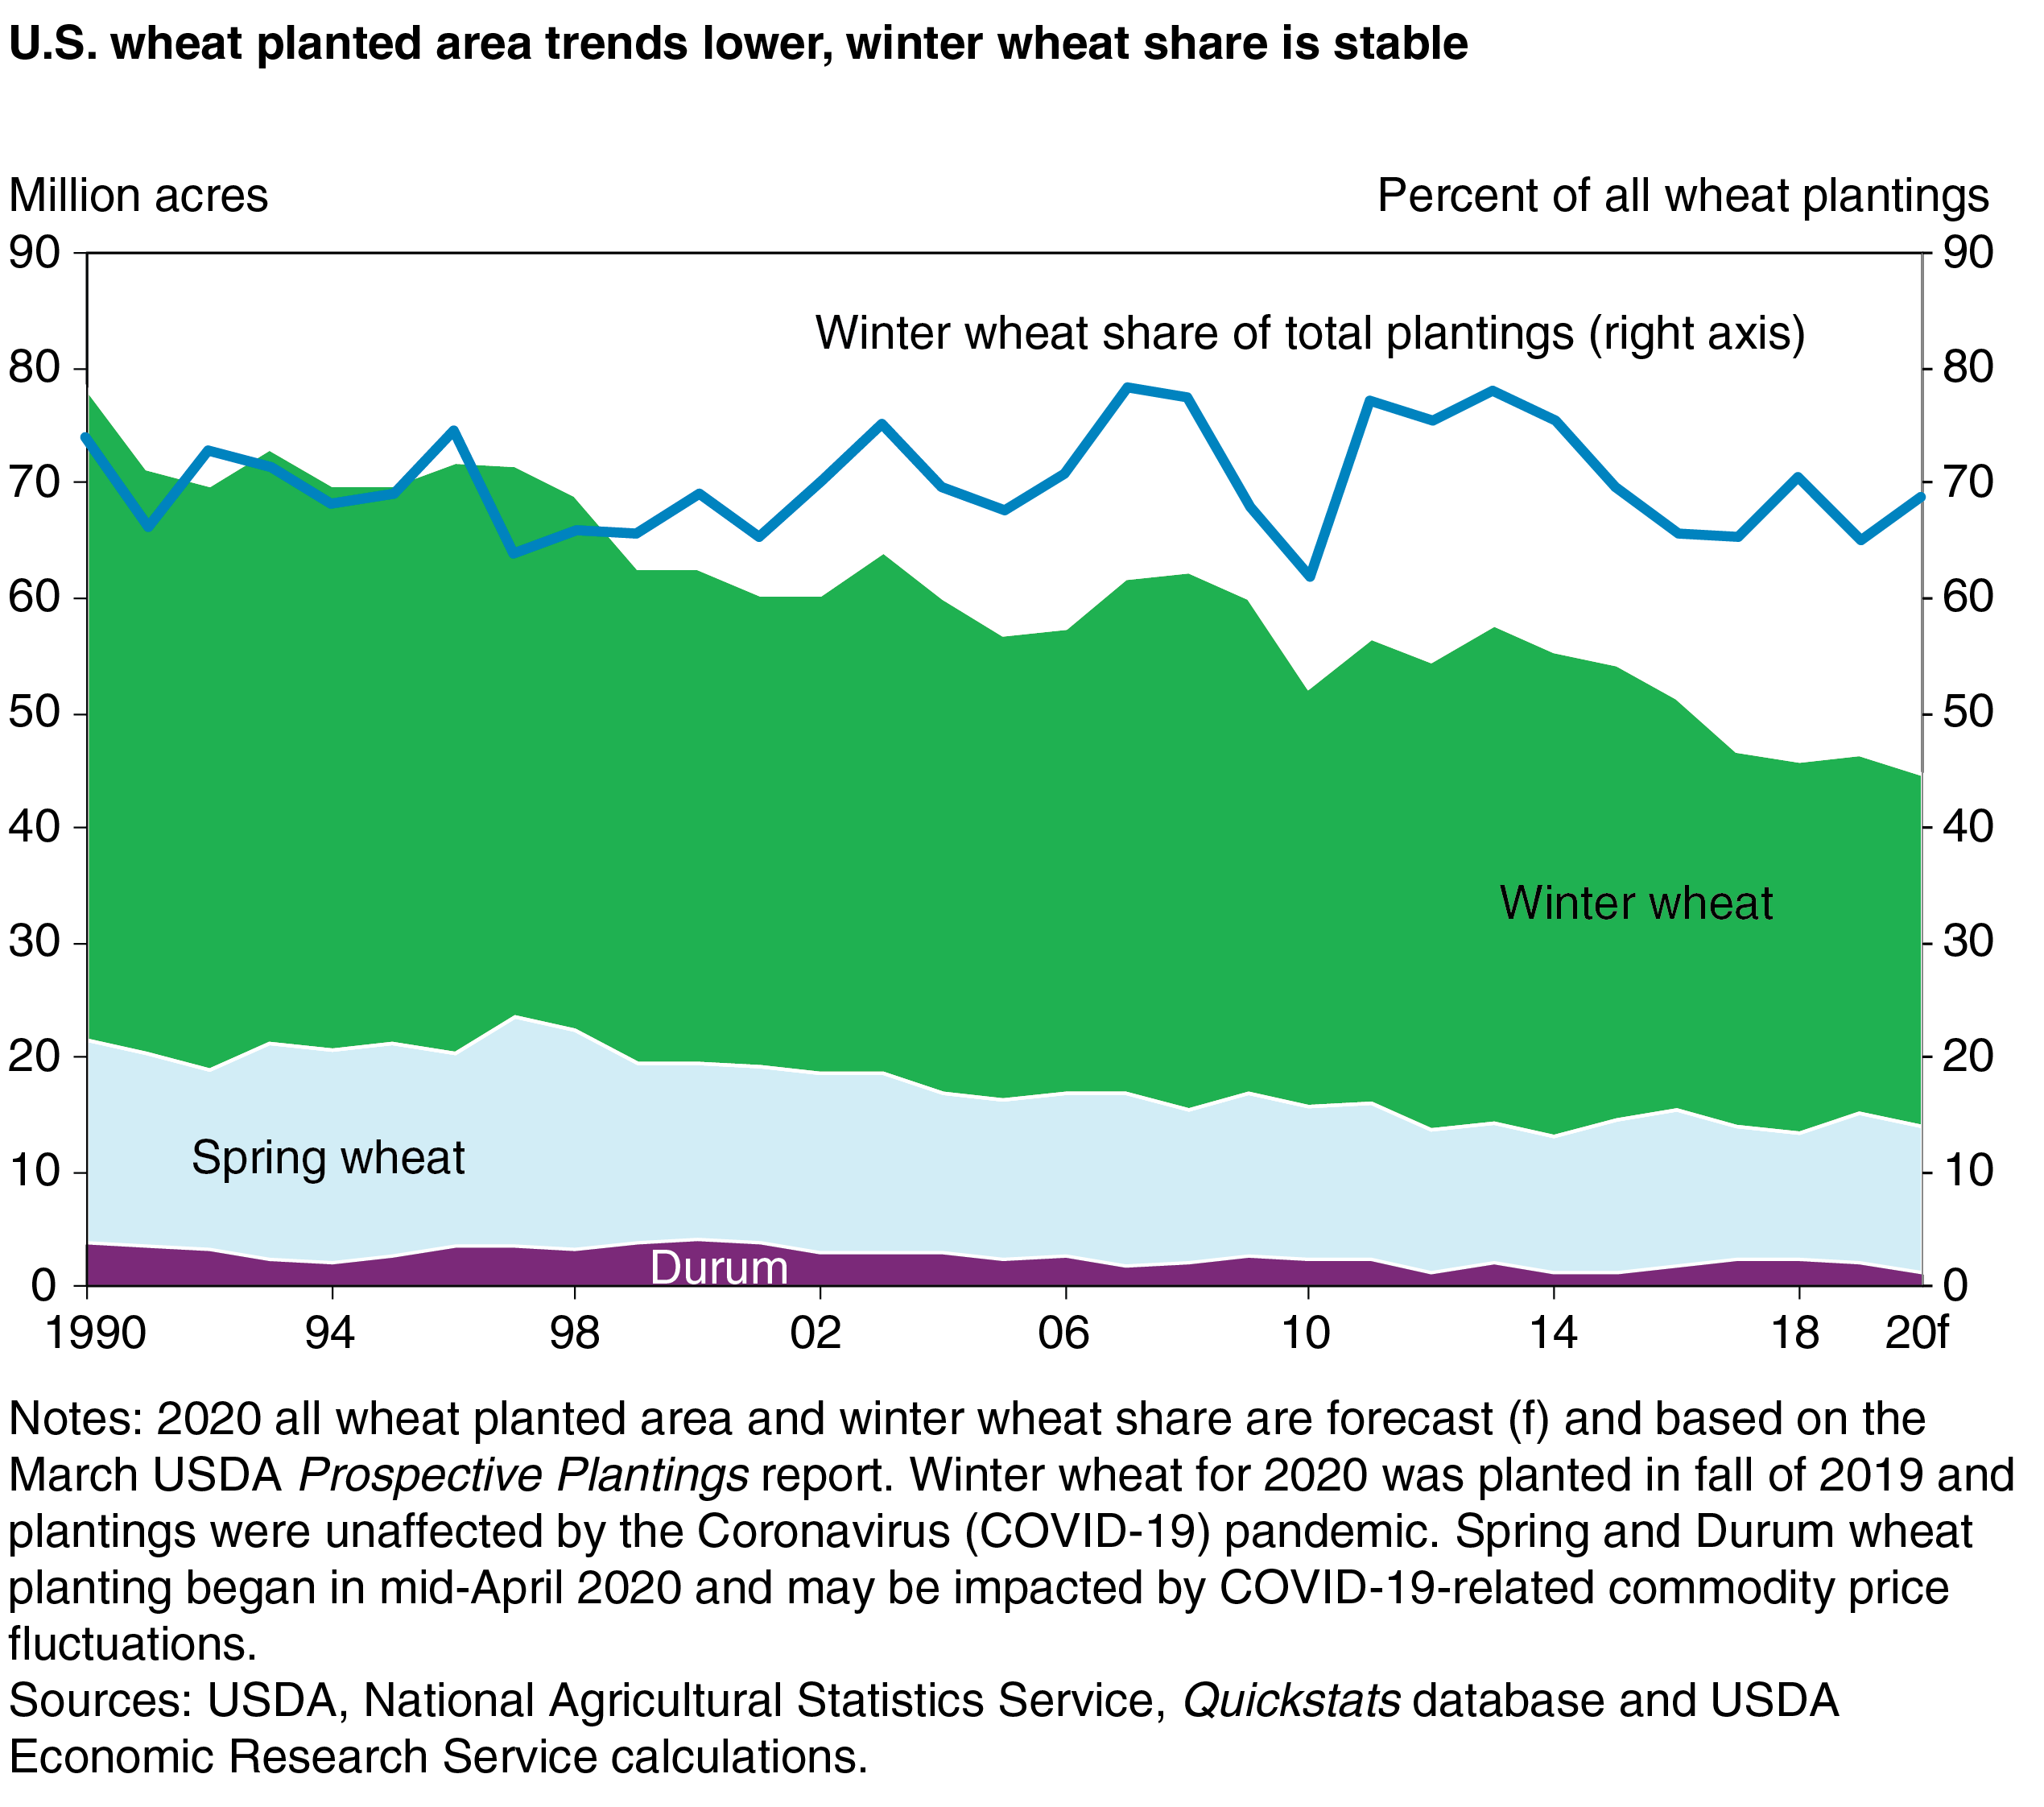
Aggregate wheat planted area estimates are comprised of the sum of sowings for five separate classes of wheat and include winter, spring, and Durum wheat varieties. While the absolute area planted to each of the wheat classes has generally declined, the share of wheat planted to winter varieties has been relatively stable. In 1990, winter wheat sowings represented about 66 percent of total wheat plantings. Similarly, 2020 winter wheat plantings are expected to comprise about 68 percent of total sowings. Winter wheat for 2020 was planted in fall of 2019 and plantings were unaffected by the Coronavirus (COVID-19) pandemic. Spring and Durum wheat planting began in mid-April 2020 and may be impacted by COVID-19-related commodity price fluctuations.
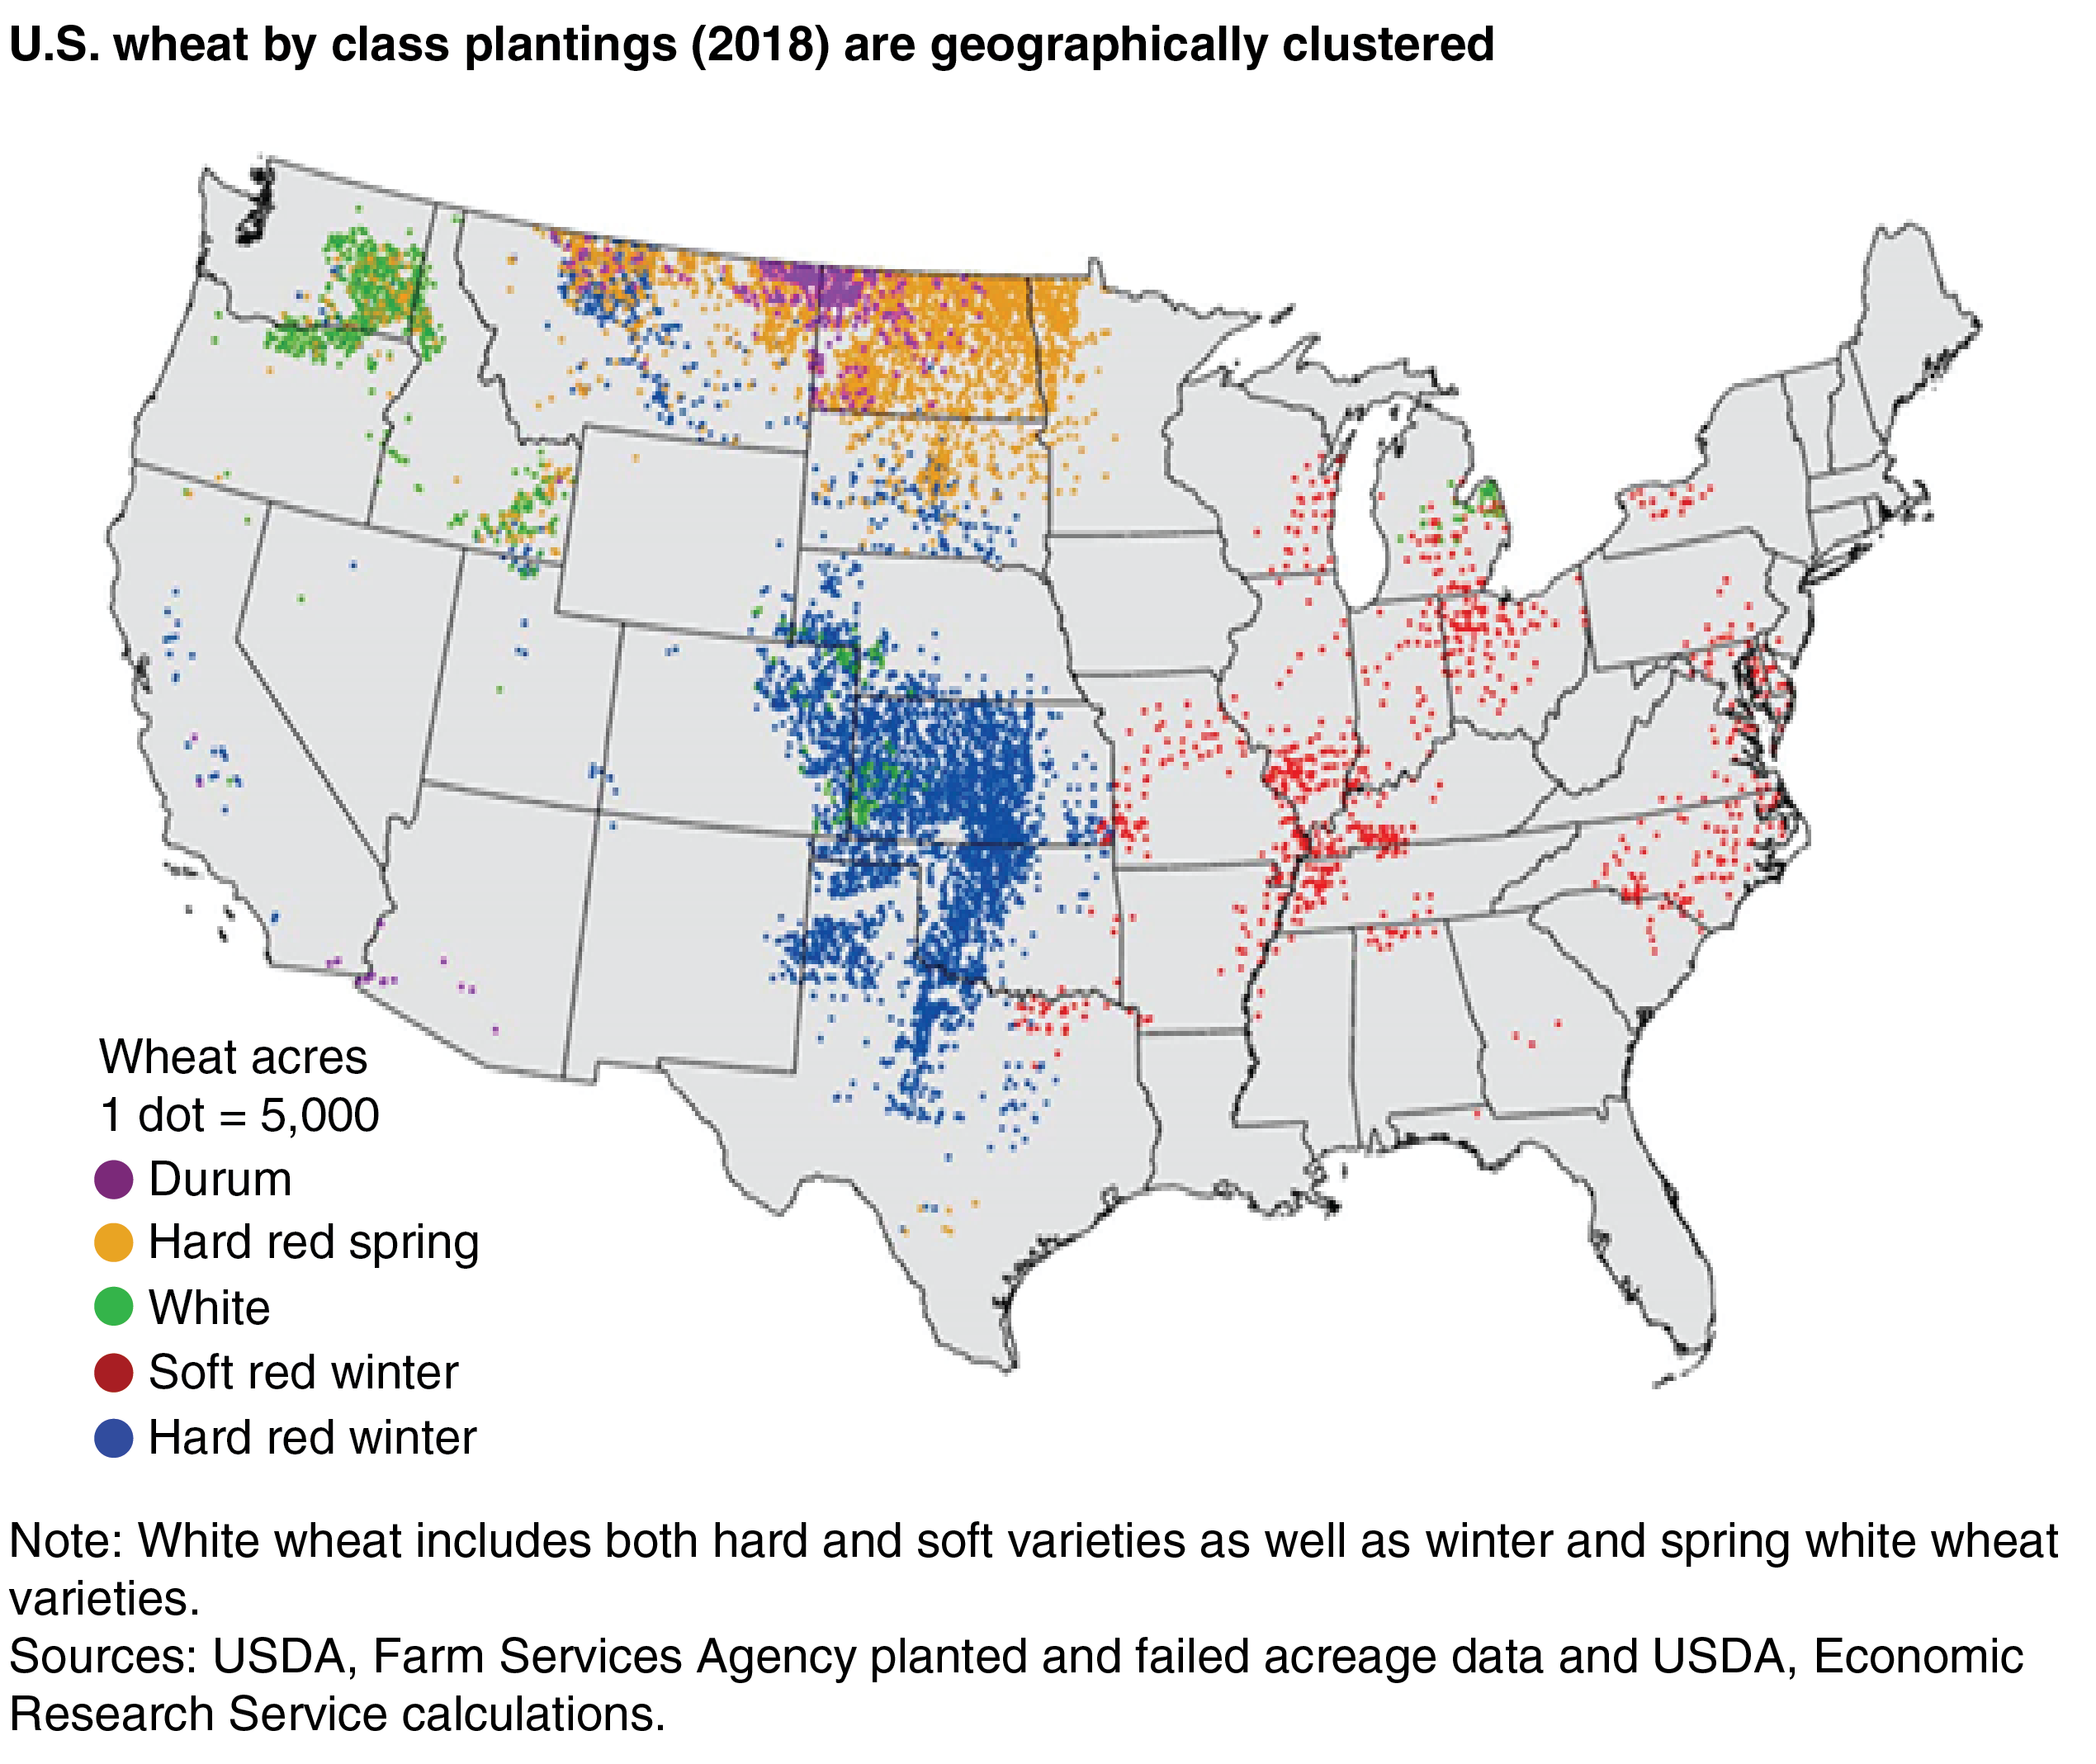
As shown in the map, individual classes of wheat tend to be grown in geographically diverse areas, which affects the chemical and physical properties of the wheat grain and influences relative suitability for specific end-uses. Of the five recognized classes of U.S. wheat, hard red winter (HRW) wheat accounts for about 40 percent of total U.S. production and is grown primarily in the Great Plains (north Texas through Montana). HRW is an ingredient in nearly all bread types, Asian noodles, and general-purpose flour.
Hard red spring (HRS) wheat accounts for about 25 percent of production and is grown primarily in the Northern Plains (North Dakota, Montana, Minnesota, and South Dakota). High protein HRS is commonly blended with HRW in flours made for commercial bread production.
About 15 to 20 percent of total wheat production is soft red winter (SRW) which is typically grown along the Mississippi River and in eastern States. SRW is used frequently in cakes, cereal, crackers, and cookies.
White wheat represents about 12 to 15 percent of production and is an ingredient in Asian noodles, cereal, flat breads, and more. White wheat is an aggregate category that includes both hard and soft varieties as well as spring and winter white wheat, and production is largely clustered in the Central Plains States and the Pacific Northwest.
On balance, about 3 to 5 percent of total wheat production is Durum, which is grown primarily in North Dakota and Montana. Durum is the hardest of all wheats and is used for pasta, couscous, and some flatbreads.
Increasing efficiencies in wheat milling have supported rising domestic wheat food use, even as domestic supplies and production have generally declined. To some extent, wheat classes are interchangeable in the production of diverse wheat-based foods. This flexibility has helped to maintain steady cultivation shares even as changing consumer preferences have reduced demand for pan-baked breads in favor of pasta, tortillas, crackers, and cookies.
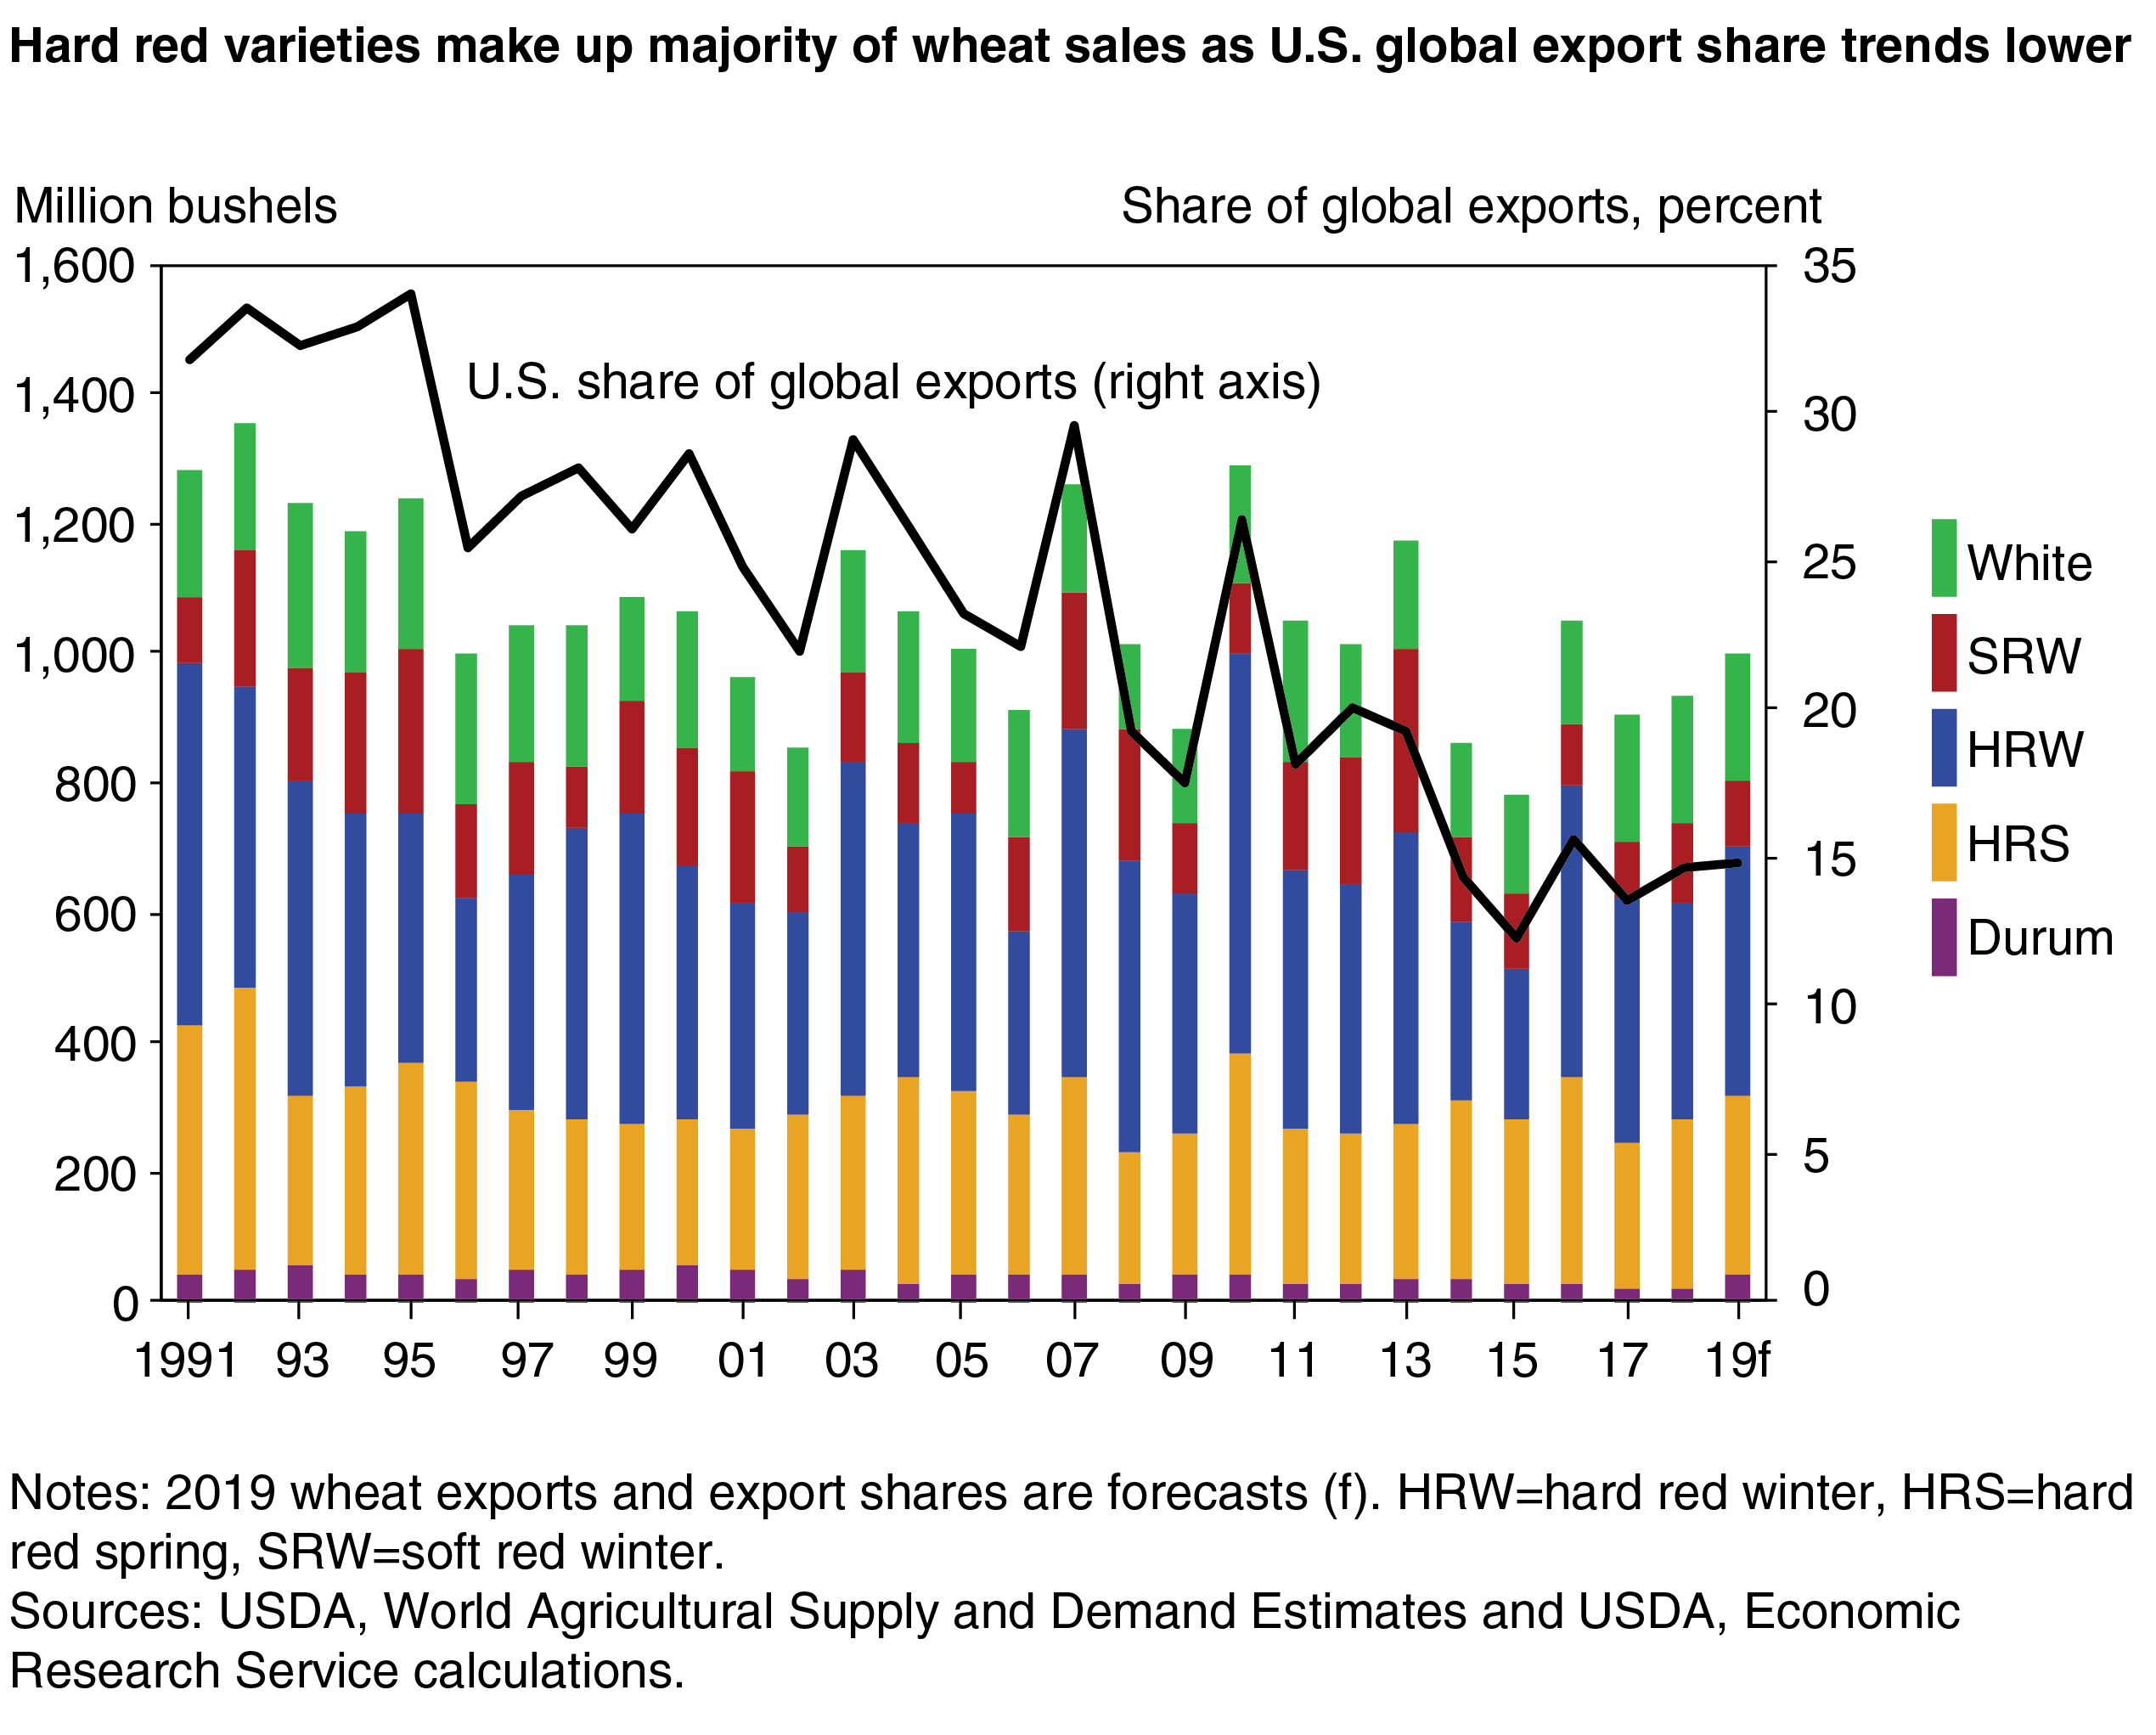
Across all classes, U.S. wheat volume exports and market share trending lower
While a diversity of wheat is grown in the United States, all classes have faced increasing competition in global export markets. Unlike the United States, where wheat production is declining, key competitors in the Black Sea, the European Union (EU), and South America have seen production rise in recent years.
In the Black Sea, record winter wheat harvests for Russia and Ukraine have displaced U.S. HRW in several longtime markets. Expanding European soft wheat production, particularly from France, has created headwinds for U.S. bread and cracker-making wheat varieties in Middle Eastern and North African markets.
Growing production and exportable supplies for key competitors has put pressure on global wheat prices, and the United States is typically not the low-price seller of wheat. Over time, as the figure shows, U.S. wheat exports declined from a recent high of nearly 1.3 billion bushels in 2010 to a more than 40-year low of 777 million bushels in 2015. Subsequently, the United States’ competitive position in global wheat markets has improved marginally, though the U.S. share of global exports has remained below the 10-year average of near 20 percent after falling to just 12 percent in 2015.
In the current marketing year, production challenges for Australia have limited that nation’s supply of white wheat and created additional marketing opportunities for the same variety of U.S. wheat. Additionally, transportation bottlenecks in Canada—a key producer of HRS and Durum wheat—and a sharply smaller EU crop of Durum, support rising U.S. Durum exports and expanded international HRS sales. These opportunities have helped to lift the U.S. share of global exports to 15 percent for the 2019 marketing year. The U.S. share of global exports is expected to decline slightly in the next decade as EU and Russia wheat exports continue to dominate the global marketplace. While the U.S. share of global exports is expected to fall over the next 10 years, the absolute volume of exports is forecast to grow slightly, and the United States will remain a top 4 wheat-exporting nation.
This article is drawn from:
- Wheat Data. (n.d.). U.S. Department of Agriculture, Economic Research Service.
- Bond, J.K. (2020). Wheat Outlook: May 2020. U.S. Department of Agriculture, Economic Research Service. WHS-20e.