
Long-Term U.S. Agricultural Outlook Affected Broadly by Uncertainty of China’s Markets
- by Fred Gale and James Hansen
- 9/3/2019
Highlights
- USDA’s latest 10-year projections of agricultural supply and demand include reduced long-term prospects for U.S. soybean and sorghum exports, due largely to China’s retaliatory tariffs on U.S. commodities imposed in 2018.
- Revised statistics on China’s production and inventory of corn—announced after the projections were made—highlight uncertainty about USDA’s assessment of China’s potential as a corn importer over the coming decade.
- The recent spread of African swine fever (ASF) in China is affecting China’s production of pork and its demand for soybeans and feed grains to an extent that was not anticipated when USDA prepared its most recent projections.
Uncertainty about China’s influence on agricultural markets is an underlying theme in USDA Agricultural Projections to 2028. USDA annually develops 10-year commodity projections covering 42 countries and regions of the world. This year, U.S. and China's tariffs and trade policies continue to evolve rapidly, so that 10-year commodity projections are more difficult to make compared to the previous year’s projections. In addition, revised estimates of China’s corn supply, as well the outbreak of swine disease in China, continue to be important factors in revising agricultural outlooks.
Comparing USDA’s 2018 and 2019 projections
Because USDA assumes current policies will remain in place indefinitely, even as governments continue to refine their trade policies (see box, “China’s Tariffs Affect Trade”), China’s imposition of retaliatory tariffs in 2018 reduced the long-term prospects for U.S. soybean and sorghum exports. However, the outlook for many other commodities was not significantly changed.
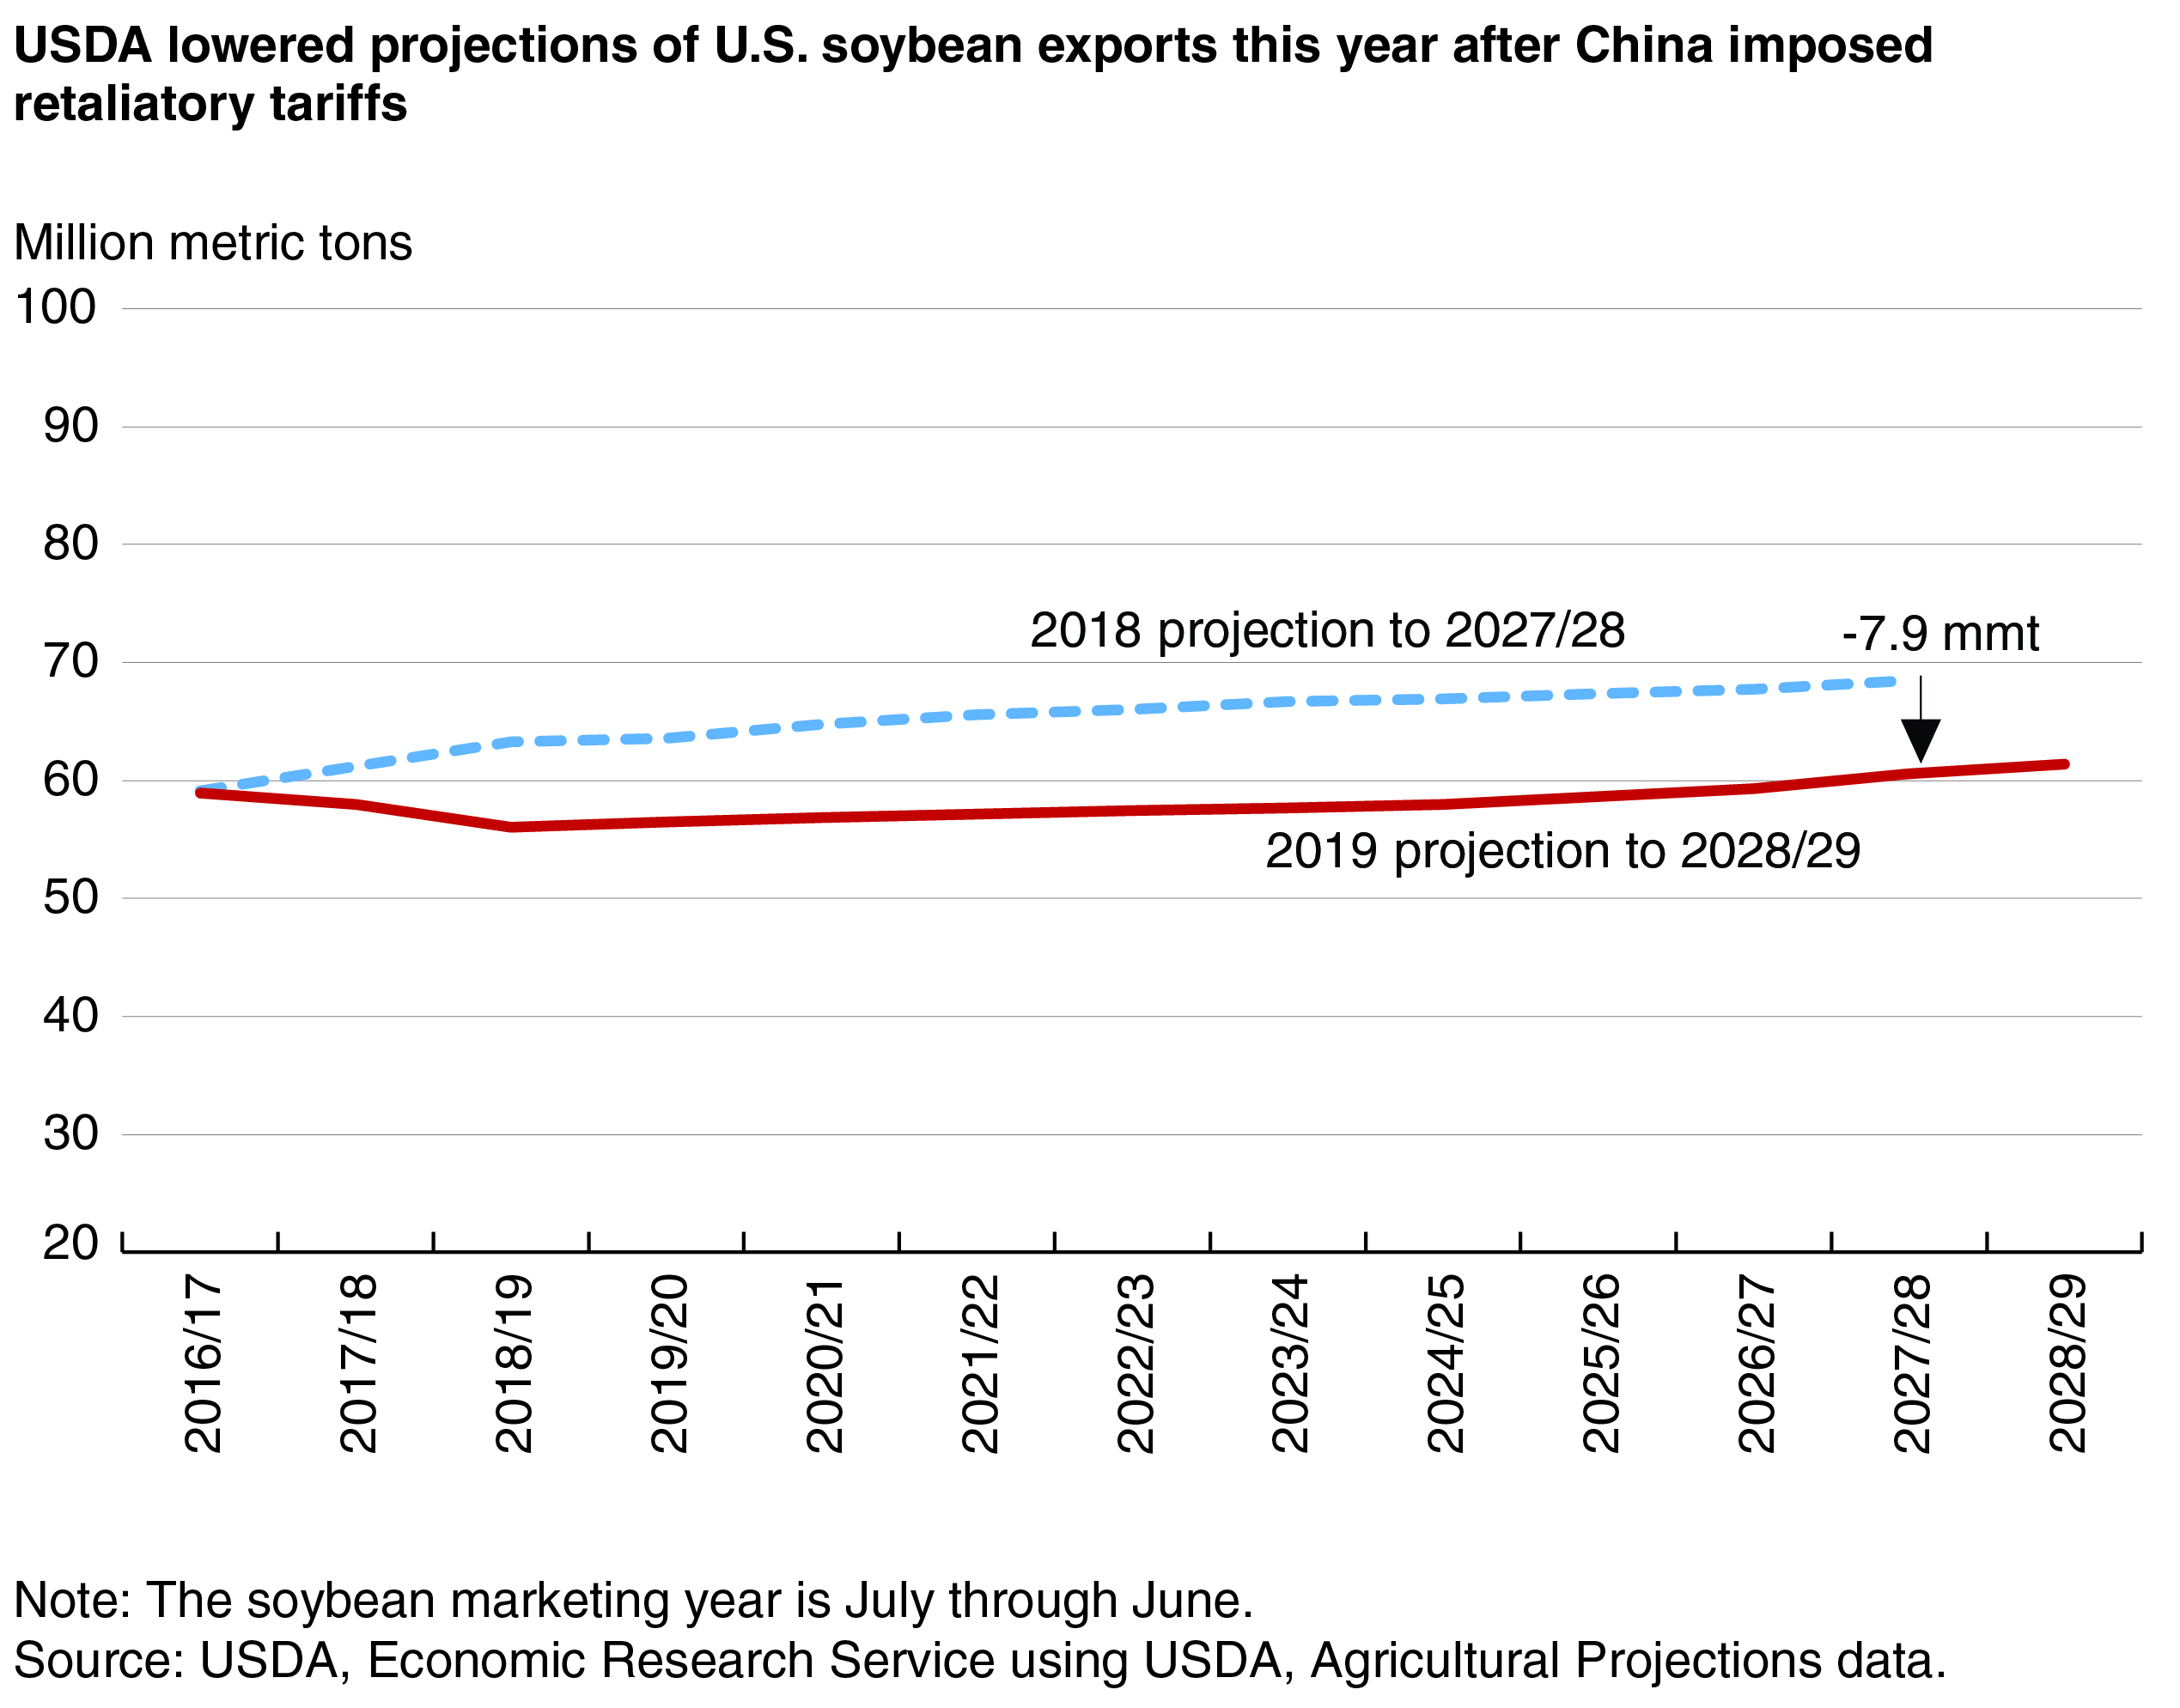
The impact of the tariffs can be seen by comparing projections of U.S. soybean exports made in 2019 with the previous year’s projections (issued in 2018). The 2019 projections show a decline in U.S. soybean exports in 2017 and 2018 as China—the world’s leading importer of soybeans—cut back its purchases. This decline contrasts with export growth forecast in the previous year’s projections. Although the latest projections include expectations that new markets for U.S. soybeans will be developed outside of China, the new projection of U.S. soybean exports in 2027 is 7.9 million metric tons (mmt) lower than the projection issued the previous year. The lower projected level of future U.S. soybean exports reflects a shift over the full projection period of China’s soybean purchases away from the United States and toward other exporters.
Comparing projections issued in 2018 and 2019 across major commodities isolates the commodities most affected in the 2019 scenario. The comparison of projected U.S. exports in 2027/28 shows that smaller U.S. exports of soybeans and sorghum and larger exports of corn and cotton are the most prominent changes in the 2019 projections. In contrast, the two sets of projections of U.S. exports of wheat, rice, beef, pork, and poultry differed by less than 1 mmt, indicating less change in the export outlook for these commodities between the projections issued in 2018 and the projections issued in 2019.
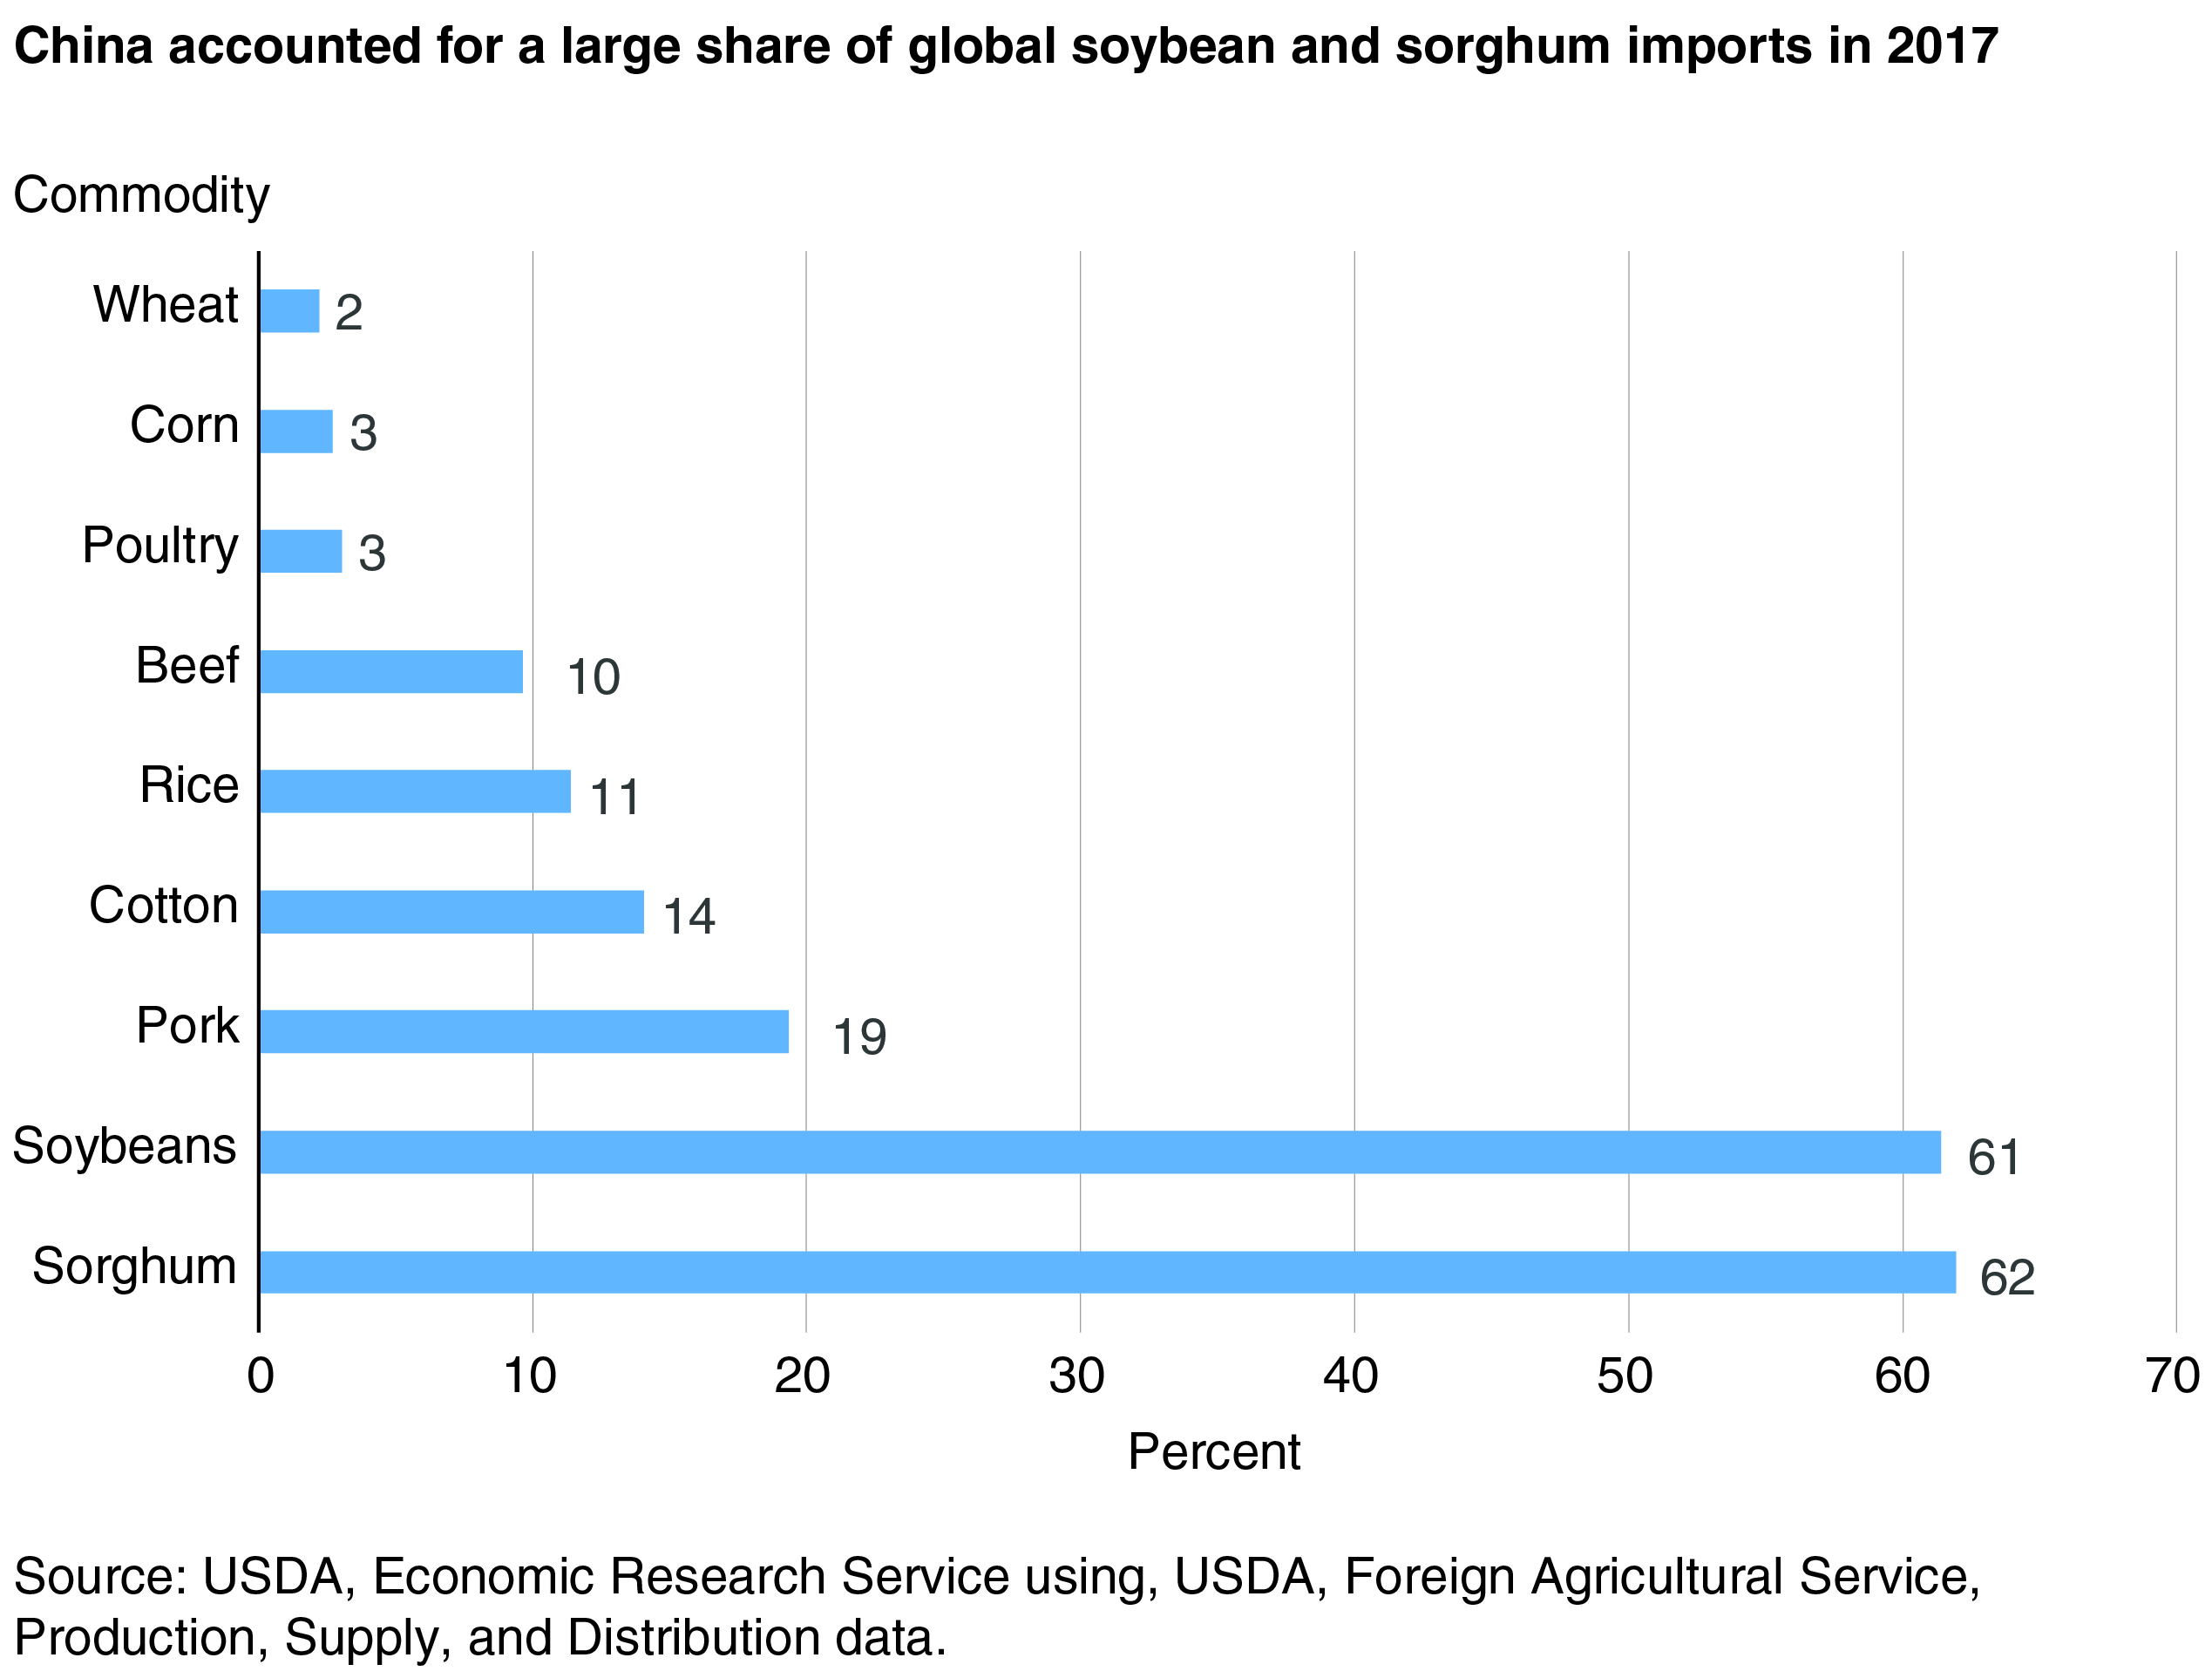
The impact of China’s tariffs on U.S. soybean and sorghum exports reflects China’s importance as a buyer of these commodities. Calculations using production, supply, and distribution (PS&D) data compiled by USDA’s Foreign Agricultural Service (FAS) indicate that China accounted for over 60 percent of global imports of both soybeans and sorghum in 2017. With China being such a large buyer, there are limited opportunities for the United States to divert its exports to other foreign markets to avoid Chinese tariffs. In contrast, broad-based growth in demand for corn, cotton, and beef—commodities for which China is a less prominent importer—is expected to lead to greater U.S. exports than was projected in the previous year.
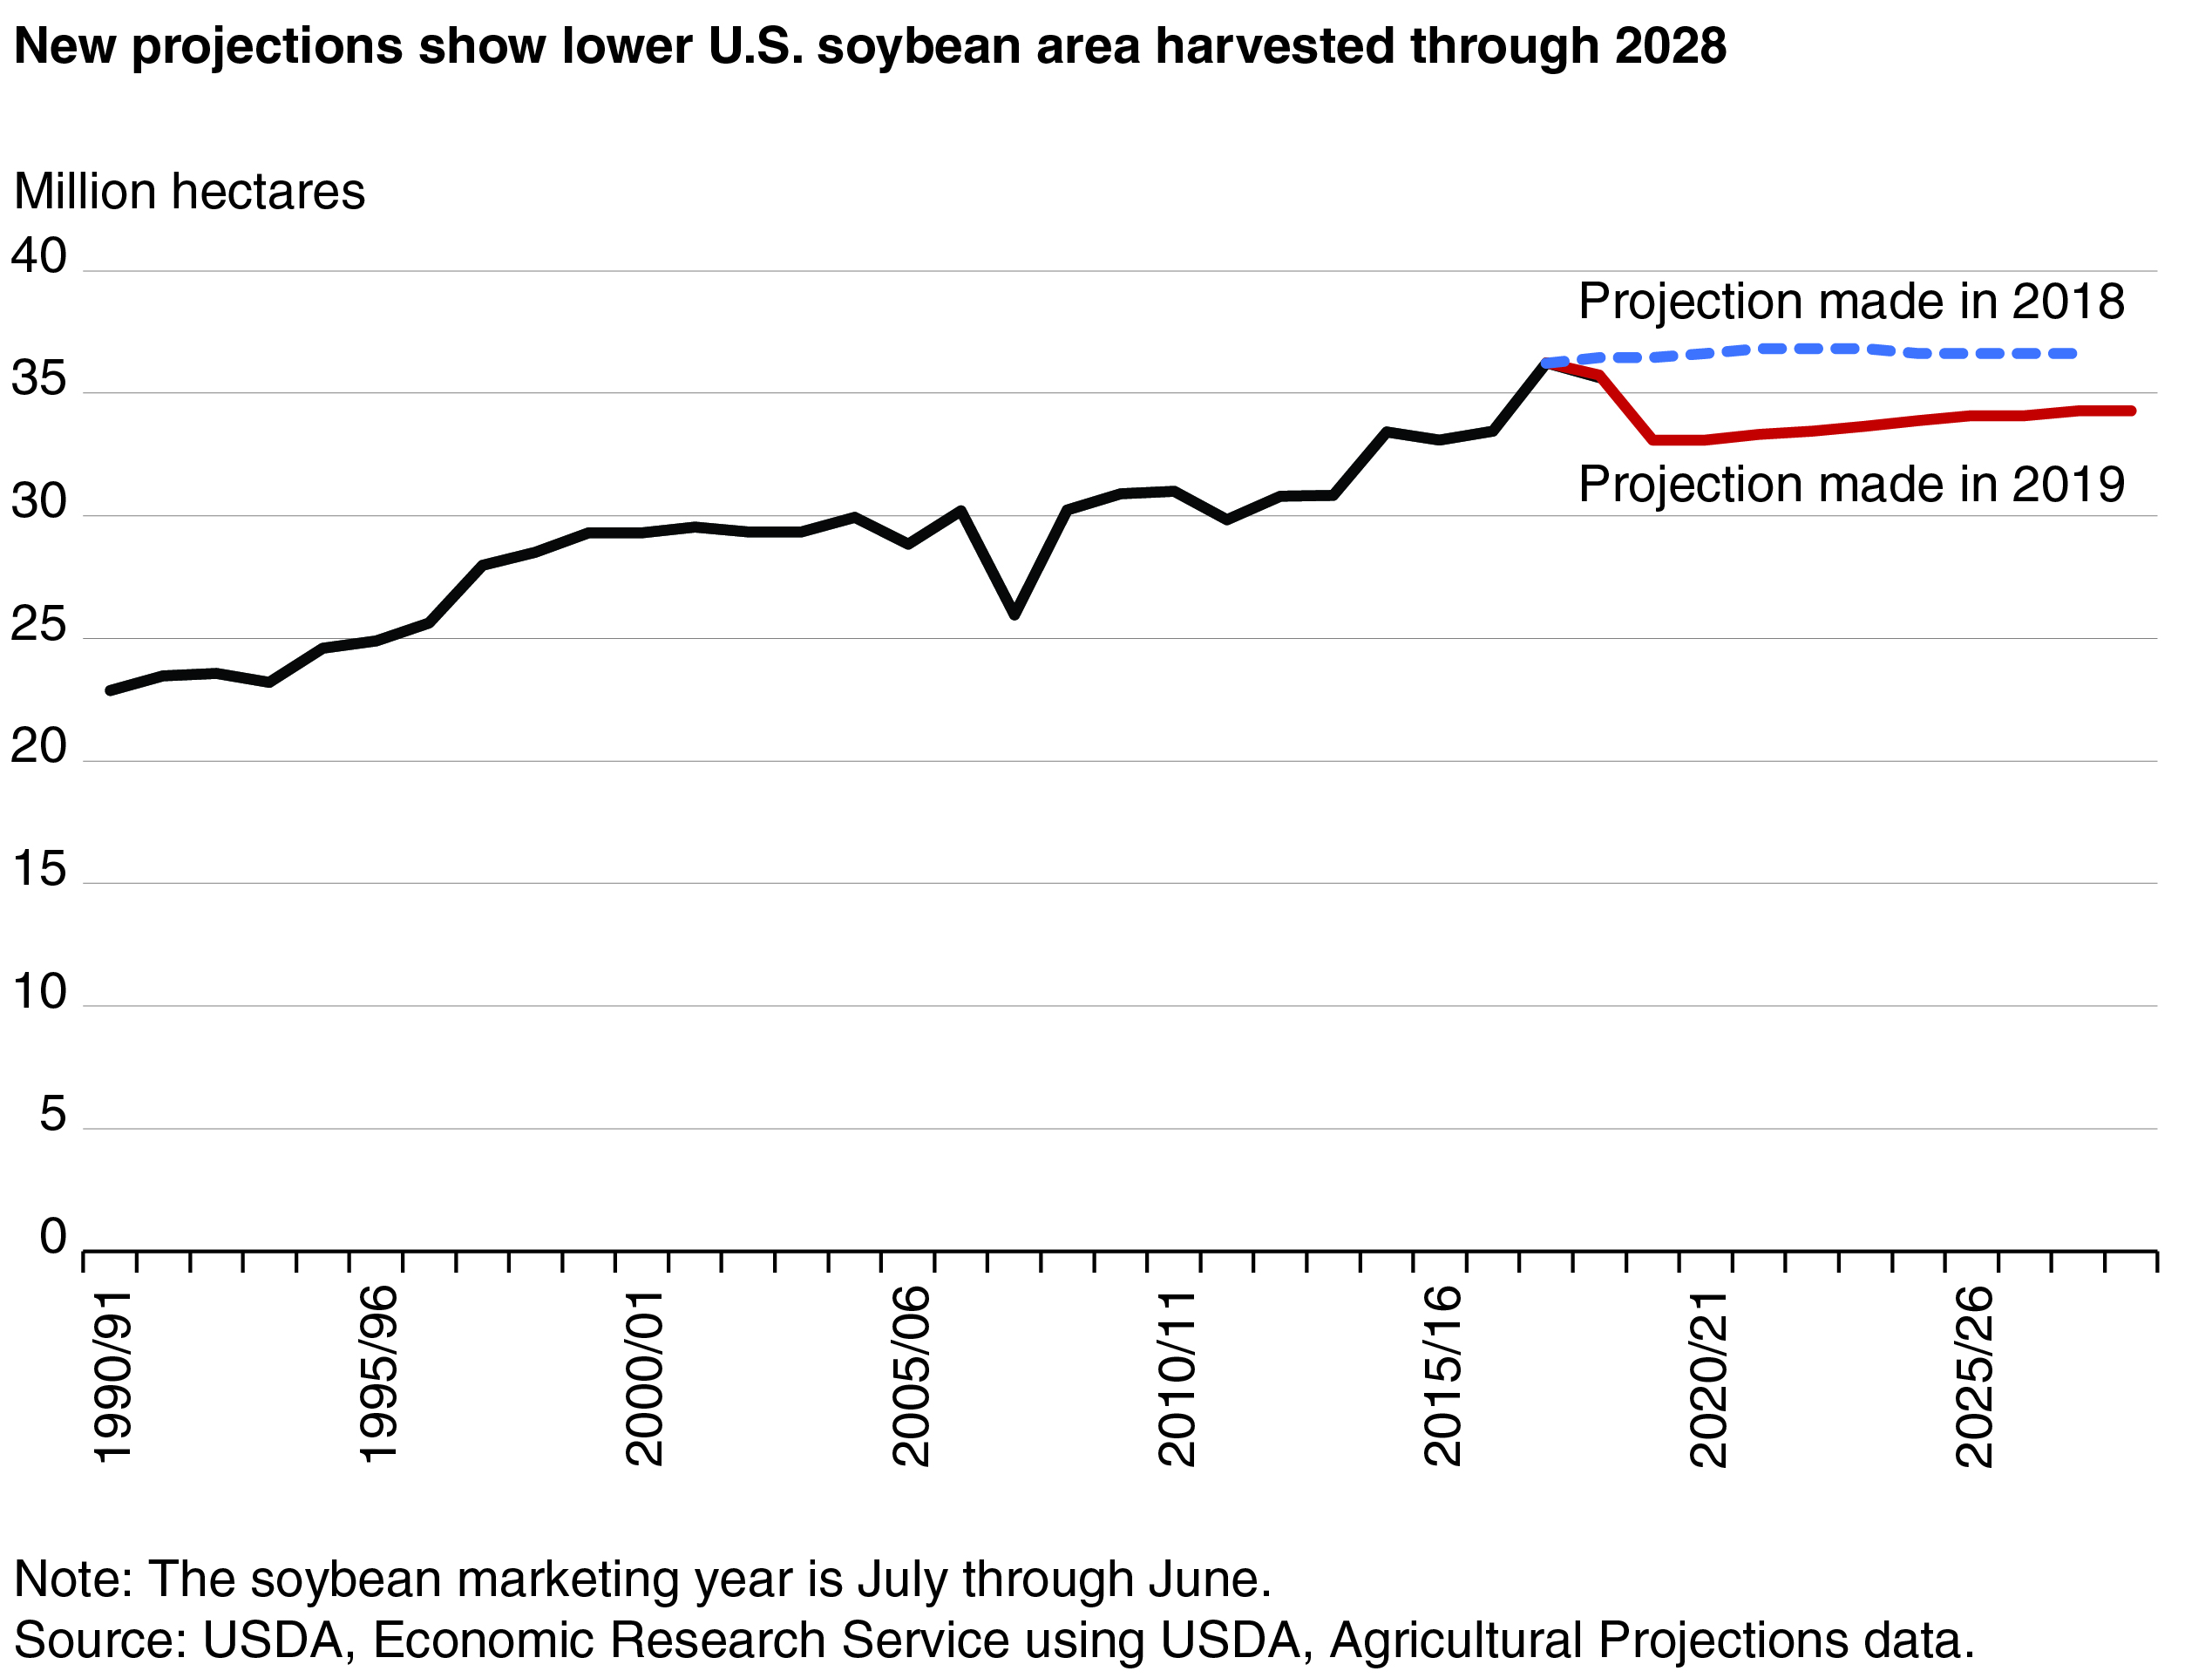
Rapid growth in China’s imports of both sorghum and soybeans was a factor that encouraged U.S. growers to shift acreage to these crops in recent years. In the latest projections, lower net returns to soybean production are expected to induce U.S. farmers to shift acreage away from soybeans and toward corn and wheat. Thus, less crop area will be devoted to soybeans than was previously projected. This is also a reversal of the previous year’s projection that soybean acreage would exceed corn acreage throughout the projection period.
| Commodity | Unit | Projection made in 2018 | Projection made in 2019 | Change in projection |
|---|---|---|---|---|
| Soybeans | MMT | 68.447 | 60.555 | -7.9 |
| Sorghum | MMT | 7.112 | 3.810 | -3.3 |
| Corn | MMT | 55.883 | 68.583 | 12.7 |
| Cotton | Million bales | 15.455 | 17.450 | 2.0 |
| Wheat | MMT | 27.488 | 27.157 | -0.3 |
| Rice | MMT | 3.731 | 3.366 | -0.4 |
| Beef | TMT | 1,350 | 1,535 | 185 |
| Pork | TMT | 3,155 | 3,044 | -111 |
| Poultry | TMT | 4,053 | 3,801 | -252 |
| Note: MMT = million metric tons; TMT = thousand metric tons. Source: USDA, Economic Research Service using USDA, Agricultural Projections data. |
||||
In contrast, the 2019 projections show gains in U.S. exports of corn and cotton compared with the previous year. China’s share of trade is much lower for these commodities, accounting for 3 percent of global imports of wheat, corn, and poultry. The broad-based growth in demand for corn to support the rising consumption of meat around the world was a theme highlighted in the 2019 report. Rising demand for U.S. corn exports spread across many markets, combined with China’s slowing demand for U.S. soybeans, could shift land from soybeans to corn.
China’s cotton use is projected to rise 44 percent by 2028 after completing a 5-year disposal of excess stockpiles. However, growth of textile production in other countries such as Vietnam, Bangladesh, Indonesia, Turkey, and Pakistan means U.S. cotton exports will have alternative markets that increase their resilience to China’s tariffs. By 2027, U.S. cotton exports are projected to rise to 17.45 million bales, nearly 2 million bales more than in the previous year’s projection.
During the coming decade, China is projected to become the world’s leading beef importer, but many other countries in Asia, the Middle East, Africa, and Latin America are also expected to import more beef. The United States is currently the top beef importer, but it is also an exporter of beef. U.S. beef exports are projected to grow despite China’s tariffs.
Statistical Revisions Boost China’s Corn Output and Inventory
Since the 1990s, USDA and other organizations often projected increases in U.S. corn exports to feed China’s growing livestock herd and poultry flocks. However, these assessments have long been clouded by imprecise statistics and secrecy about the country’s government reserves. U.S. corn exports to China peaked at 5 mmt in 2011/12 and have been less than 1 mmt each year since 2014/15.
The 2019 projections indicate that China’s corn use will grow faster than its supply over the coming 10 years. However, in view of China’s long-standing practice of limiting corn imports by quotas and other measures, USDA did not project large increases in Chinese corn imports to fill the gap. Instead, USDA projected that China would fill its needs by drawing down its own corn inventory. The inventory was projected to shrink from about 23 percent of annual use to less than 13 percent by 2023/24, a historically low ratio.
The projections did not take into account statistical revisions that increased estimates of China’s current corn supply. In November 2018, USDA’s World Agricultural Supply and Demand Estimates (WASDE)—which form the historical database used to make USDA’s long-term projections—incorporated revised agricultural production statistics from China’s National Bureau of Statistics. The Bureau raised its estimate of China’s corn production in 2016 by 20 percent, the largest upward revision of any commodity.
At the same time, WASDE more than doubled its estimate of China’s corn inventory. Little information is available to assess China’s grain inventories because the Chinese Government keeps commodity reserves a state secret. However, the Chinese Government reported selling large volumes of corn inventories over 2 consecutive years, and this information strongly suggested that China’s corn inventories were much larger than USDA had previously estimated.
Neither of these Chinese data revisions were incorporated in the 2019 projections because they were made after the projections had already been completed. The historical data used in USDA projections are from October 2018.
Because of the revisions, projections in the 2019 “International Baseline” database differ from the updated PS&D data that include China’s revised statistics. Projections of corn production and use for future years would also likely be higher if they were based on the revised statistics.
The data revisions added nearly 143 mmt to China’s stocks of corn and 31 mmt to China’s output of corn for 2018/19, thus increasing China’s estimated supply of corn for that year by nearly 174 mmt. After the revision, the ending inventory equaled 76 percent of annual use, suggesting that China has a much larger stock of corn to meet its needs without increasing imports.
Despite an apparently abundant current supply of corn, there are signs that China’s demand for corn could nevertheless outstrip its supply in future years once inventories are depleted:
- China’s corn prices are already much higher than world prices despite several near-record harvests supplemented by sales of Government reserves.
- The Chinese market’s ability to absorb large sales of corn from Government reserves implies a large deficit between domestic supply and use. Officials signaled plans for another round of large reserve sales in 2019.
- China’s livestock output and production of corn-based starch and alcohol products are expected to grow, further increasing consumption of corn.
- In 2017, Chinese authorities put forward a plan to require blending 10-percent ethanol with gasoline nationwide by 2020. With current technology, this objective could only be met by using large volumes of domestic corn for ethanol production or by importing ethanol. China’s imports of U.S. ethanol plummeted after tariffs were imposed in 2018.
- China’s potential as a corn producer is limited by Chinese subsidies designed to retire erodible corn land or replace corn with soybeans or other crops.
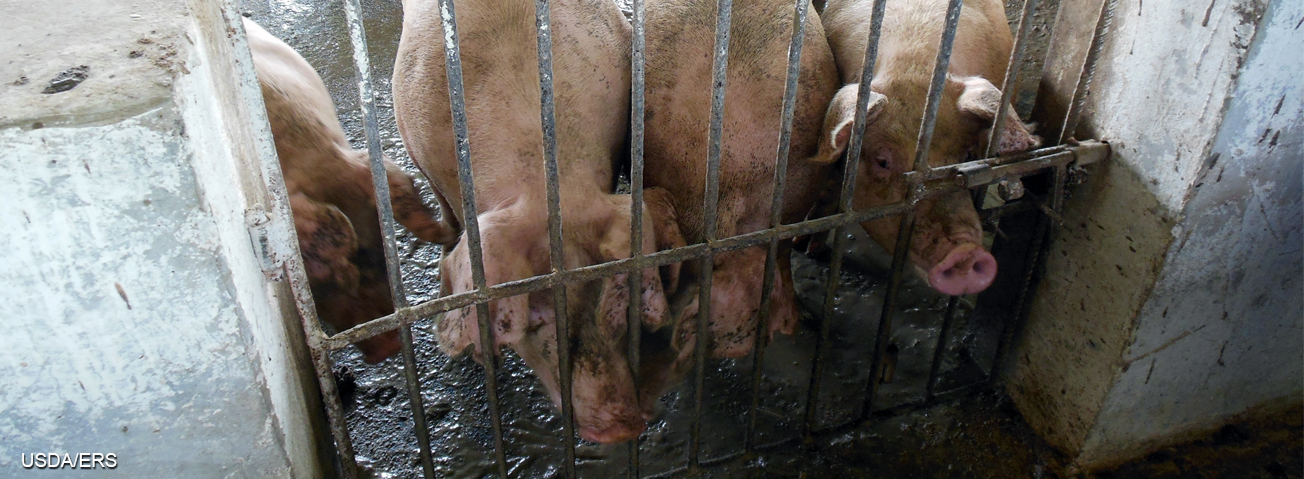
African Swine Fever May Impact Pork Output and Feed Use
Loss of livestock due to the spread of African swine fever (ASF) to China’s swine farms was not taken into account in the 2019 projections. The disease is deadly to swine (but does not spread to humans), spreads rapidly through contact with other swine, and has no vaccine or cure. The virus was first reported in China in August 2018, and it spread to every province of China and several neighboring countries within 8 months. A year later, nearly 150 outbreaks had officially been reported. Deaths from the disease, mandated culls in infected areas, and farmers’ liquidation of herds to avoid the disease reduced the swine herd during late 2018 and 2019.
The prospects for the disease’s impact were still unclear when USDA made its projections for 2019. USDA projected a 1-percent increase in China’s pork output in 2019 and an additional 12-percent increase during 2019–28. After the projections were made, China’s Ministry of Agriculture and Rural Affairs began reporting sharp declines in the swine inventory on farms it tracks on a monthly basis. In July 2019, the Ministry reported a 32-percent decline in the swine inventory from a year earlier. Chinese pork prices began rising rapidly in the second half of 2019 as the number of hogs shrank. The decline in swine numbers suggested that China’s pork output could remain low for several years, as replenishment of sow numbers and the raising of new cohorts of finished hogs would take a year or more.
Reductions in China’s domestic pork production could mean that the country’s pork imports could be much larger than USDA’s projection of a gradual increase from 1.75 mmt to 2.1 mmt during 2018–28. After the impacts of ASF were evident, USDA increased its short-term forecast of China’s pork imports for 2019 to 2.2 mmt—a record volume and larger than its original projection.
As long as China’s tariffs on U.S. pork remain in place, U.S. competitors may supply most of China’s pork imports. Nevertheless, U.S. exporters could benefit from rising China imports if competitors in Europe and South America divert exports from other markets to China, thus creating opportunities for U.S. exports. Fewer swine could also reduce Chinese demand for feed grains and protein meals, which in turn could reduce China’s imports of soybeans and feed grains below USDA projections. However, the impact on feed demand could be offset by a shift in Chinese consumption to poultry meat and other pork substitutes that could increase the demand for feed by those sectors.
More Agricultural Imports and More Uncertainty From China
China’s impact on U.S. markets could diminish if its retaliatory tariffs remain in place. On the other hand, the outlook for U.S. agricultural exports could revert to a scenario more similar to the 2018 projections if tariffs are lifted. Uncertainties related to incomplete statistics for China and African swine fever will remain even if tariffs are lifted. China’s role in agricultural markets will continue to be important, but its propensity to add uncertainty also seems likely to persist.
This article is drawn from:
- International Baseline Data. (n.d.). U.S. Department of Agriculture, Economic Research Service.
- O'Donoghue, E., Hansen, J. & Stallings, D. (2019). USDA Agricultural Projections to 2028. U.S. Department of Agriculture, Economic Research Service. OCE-2019-1.