
Participation in SNAP Varies Across States But Is Generally Decreasing
- by Alex Smith and Laura Tiehen
- 9/4/2018
The Supplemental Nutrition Assistance Program (SNAP)—USDA’s largest food assistance program—is available to most needy households with limited incomes and assets. In 2017, approximately 42 million low-income individuals received SNAP benefits in the United States. These individuals accounted for 12.9 percent of the U.S. population, down from 13.7 percent in 2016. The share of the population receiving SNAP benefits has declined each year since 2013, when 15.1 percent of Americans participated in the program.
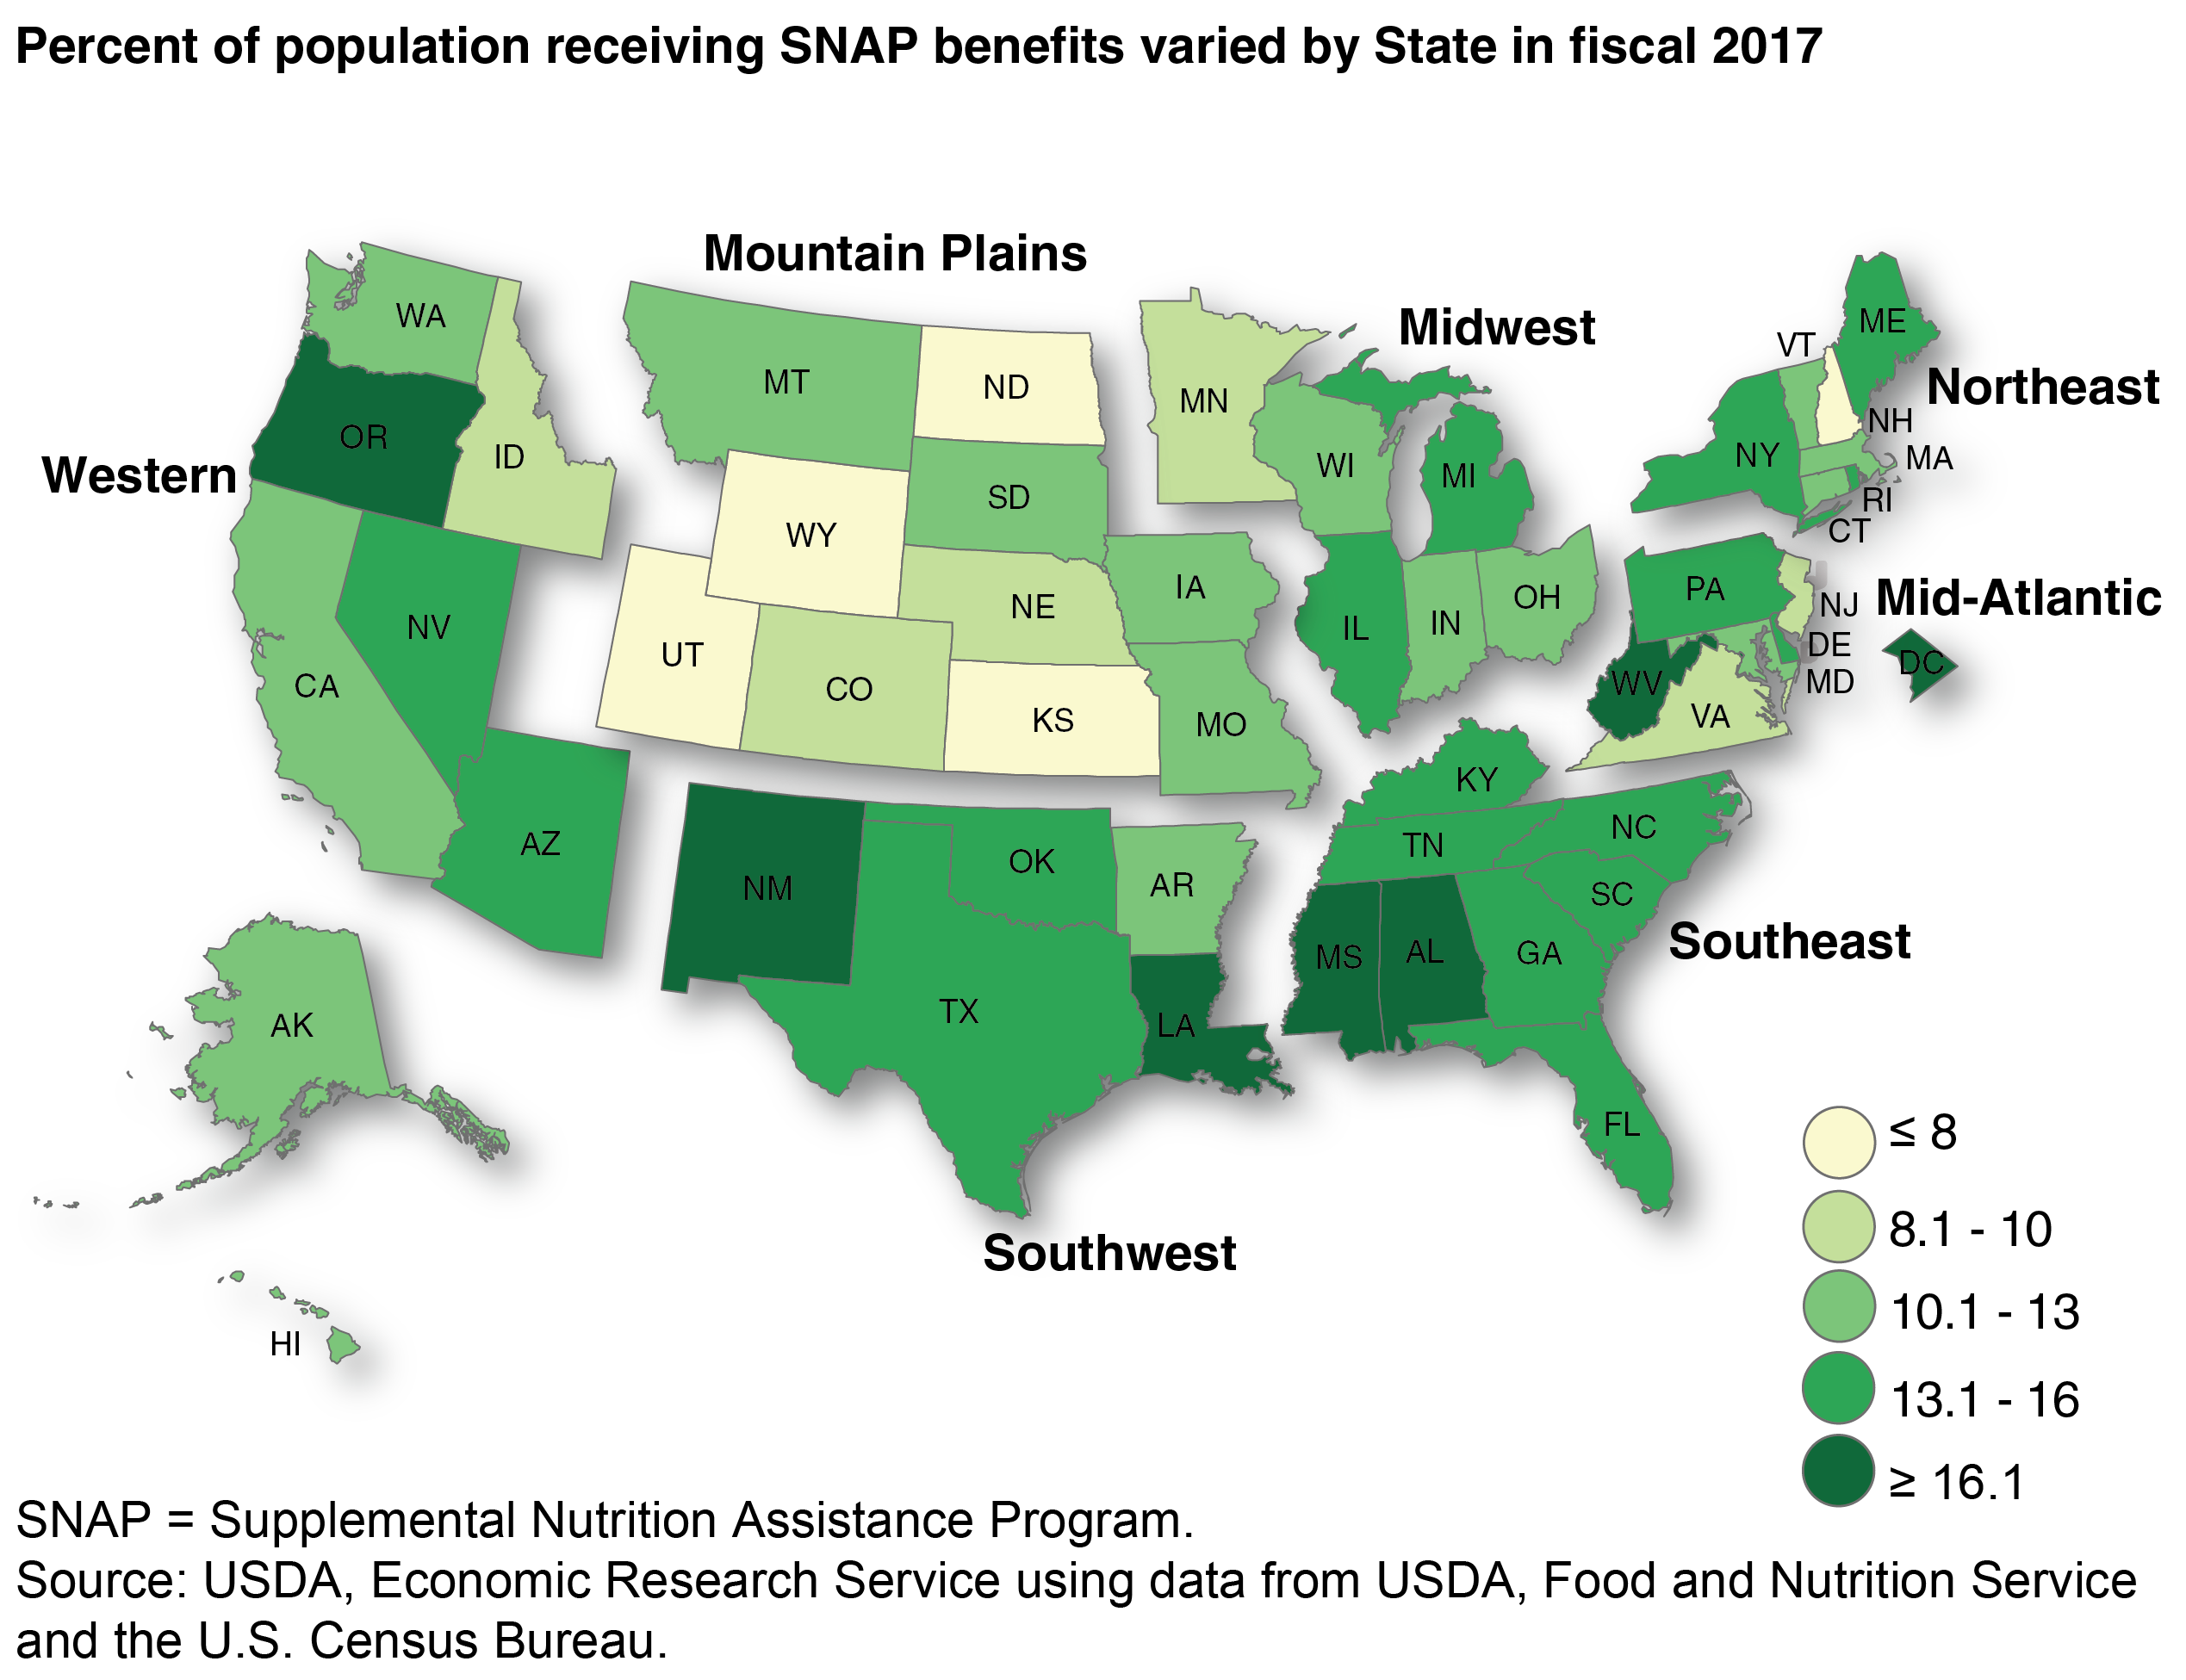
USDA’s Food and Nutrition Service (FNS) works with State partners to administer SNAP. In 2017, the shares of State residents receiving SNAP benefits ranged from 22.1 percent in New Mexico to 5.7 percent in Wyoming. Among seven FNS-defined regions nationwide, the Southeast region had the highest average share of residents receiving SNAP benefits at 15.1 percent. Shares for individual States within the Southeast ranged from 18.0 percent in Mississippi to 13.3 percent in North Carolina. The Mountain Plains region had the lowest average share of residents receiving SNAP at 9.6 percent. Of the five States that had resident participation rates at or below 8 percent, four were in the Mountain Plains region: Kansas, North Dakota, Utah, and Wyoming.
From 2016 to 2017, only three States saw an increase in the share of residents receiving SNAP: Alaska, Montana, and Texas. Alaska had the largest increase in participation, growing from 11.1 to 12.0 percent of residents, while Montana’s share went from 11.2 to 11.5 percent and Texas’s share went from 13.5 to 13.9 percent. Nebraska’s share of residents receiving SNAP stayed at 9.2 percent in both years.
The remaining States and the District of Columbia all experienced declines between 2016 and 2017 in the share of residents participating in SNAP. The average decline was 0.8 percentage points. North Carolina showed the largest decline in SNAP participation, moving from 15.5 to 13.3 percent of residents—a decrease of 14.2 percent. South Carolina and the District of Columbia also had decreases in participation shares greater than 10 percent.
The share of a State’s residents participating in SNAP is influenced by two major factors—economic conditions and program policies. Stronger economic conditions typically lead to increased employment and higher wages, decreasing the need for assistance. Differing policies related to SNAP can also influence participation. States administer SNAP differently and exercise unique policy options, as allowed by FNS and Federal law. A recent ERS study found that there was greater State variation in SNAP policies in 2014 (the latest year of the study) than in the mid-1990s, when States were first granted flexibility in some aspects of SNAP administration. For example, States differ in whether they offer an online application for SNAP and in the extent of their outreach activities, such as eligibility pre-screening and application assistance.
This article is drawn from:
- SNAP Policy Data Sets. (n.d.). U.S. Department of Agriculture, Economic Research Service.
- Supplemental Nutrition Assistance Program (SNAP). (n.d.). U.S. Department of Agriculture, Economic Research Service.
- Stacy, B., Tiehen, L. & Marquardt, D. (2018). Using a Policy Index To Capture Trends and Differences in State Administration of USDA's Supplemental Nutrition Assistance Program. U.S. Department of Agriculture, Economic Research Service. ERR-244.