

Supermarkets, Schools, and Social Gatherings: Where Supplemental Nutrition Assistance Program and Other U.S. Households Acquire Their Foods Correlates With Nutritional Quality
- by Lisa Mancino and Joanne Guthrie
- 2/21/2018
Highlights
- SNAP households acquire as many calories as non-SNAP households while spending fewer dollars.
- Foods from supermarkets provide the majority of calories for all households, but the nutritional quality of these purchases is lower for SNAP households.
- School meals and food from family and friends make up a large share of SNAP households’ away-from-home foods.
National data show that Americans’ diets are typically lower in fruits, vegetables, whole grains, and low-fat dairy, and higher in calorie-dense, low-nutrient foods compared to Federal recommendations. Since the first step to a healthy diet is purchasing, or otherwise acquiring, a nutritious mix of foods, understanding where households shop and the types of foods they select could inform strategies to improve Americans’ diets. USDA’s National Household Food Acquisition and Purchase Survey (FoodAPS) offers information on the foods acquired by American households, whether at grocery stores, restaurants, school cafeterias, food pantries, or other sources, allowing researchers and others to gain more insights into food choices. These insights can guide efforts to improve food choices and diets, and, in turn, health.
While dietary improvement is important for most Americans, the challenges facing low-income households are of particular concern. In 2017, USDA’s Supplemental Nutrition Assistance Program (SNAP) provided more than 42 million Americans with financial benefits that increased their food purchasing power. Evidence shows that SNAP benefits help alleviate poverty and food insecurity—households struggling to afford enough food for all members—among participating households. However, like most Americans, the dietary patterns of SNAP participants show room for improvement, with adult participants typically under-consuming fruits, vegetables, whole grains, and other healthy foods, while consuming excess calories from solid fats and added sugars.
Using data from FoodAPS, ERS researchers examined the nutritional quality of a week’s worth of food purchased or obtained for free, such as meals with family and friends, by SNAP households, low-income non-SNAP households, and higher income non-SNAP households. They also examined differences in nutritional quality of foods acquired across food sources, such as supermarkets and other retail stores versus restaurants and other sources primarily selling already prepared foods. The researchers found that, although SNAP households devoted more of their food dollars to foods purchased in supermarkets and other stores, the nutritional quality of those foods was lower than that of non-SNAP households. This finding suggests the importance of encouraging SNAP participants to improve the nutritional quality of their supermarket choices.
Meeting Recommendations Is a Struggle for All Households—Especially for SNAP Households
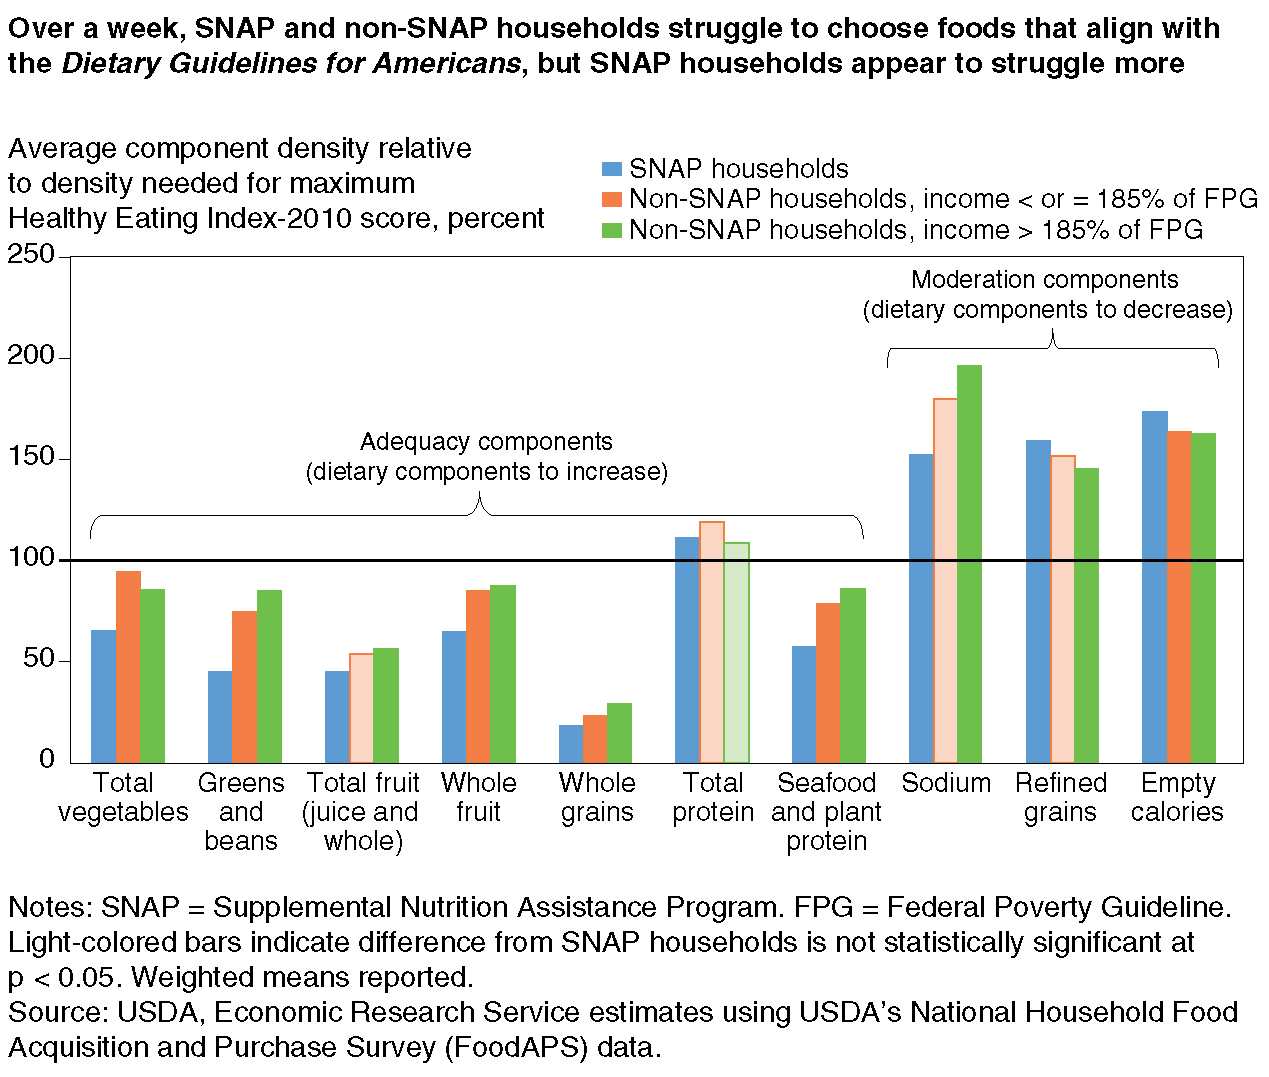
ERS researchers used information on the nutritional composition of each food item acquired over the survey week to calculate a Healthy Eating Index-2010 (HEI-2010) score for each household (see box, “Linking Nutrient Information to FoodAPS Data”). The HEI-2010 summarizes how well the mix of foods acquired compares to recommendations from the 2010 Dietary Guidelines for Americans. The HEI-2010 is scored from 0 to 100, with a higher score reflecting a healthier diet. A score of 100 would mean, given the number of calories acquired, the purchase basket met recommended amounts of nine components, such as whole grains, whole fruits, and vegetables, and the diet did not exceed recommended amounts of sodium, refined grains, and calories from solid fats, alcohol, and added sugars (empty calories).
Household composition can vary in ways that affect a household’s food needs—for example, two parents with a 5-year-old son do not need to buy as much food as they would were that son 15 years old. Thus, to compare nutritional adequacy between different households, household composition—the age, gender, and total number of household members—must be taken into account. To adjust for this, ERS researchers used a measure called calories per adult equivalent. This measure expresses an individual’s estimated energy requirements for age and gender relative to the 2,000-calorie-per-day standard reference used on the Nutritional Facts label and restaurant menu boards.
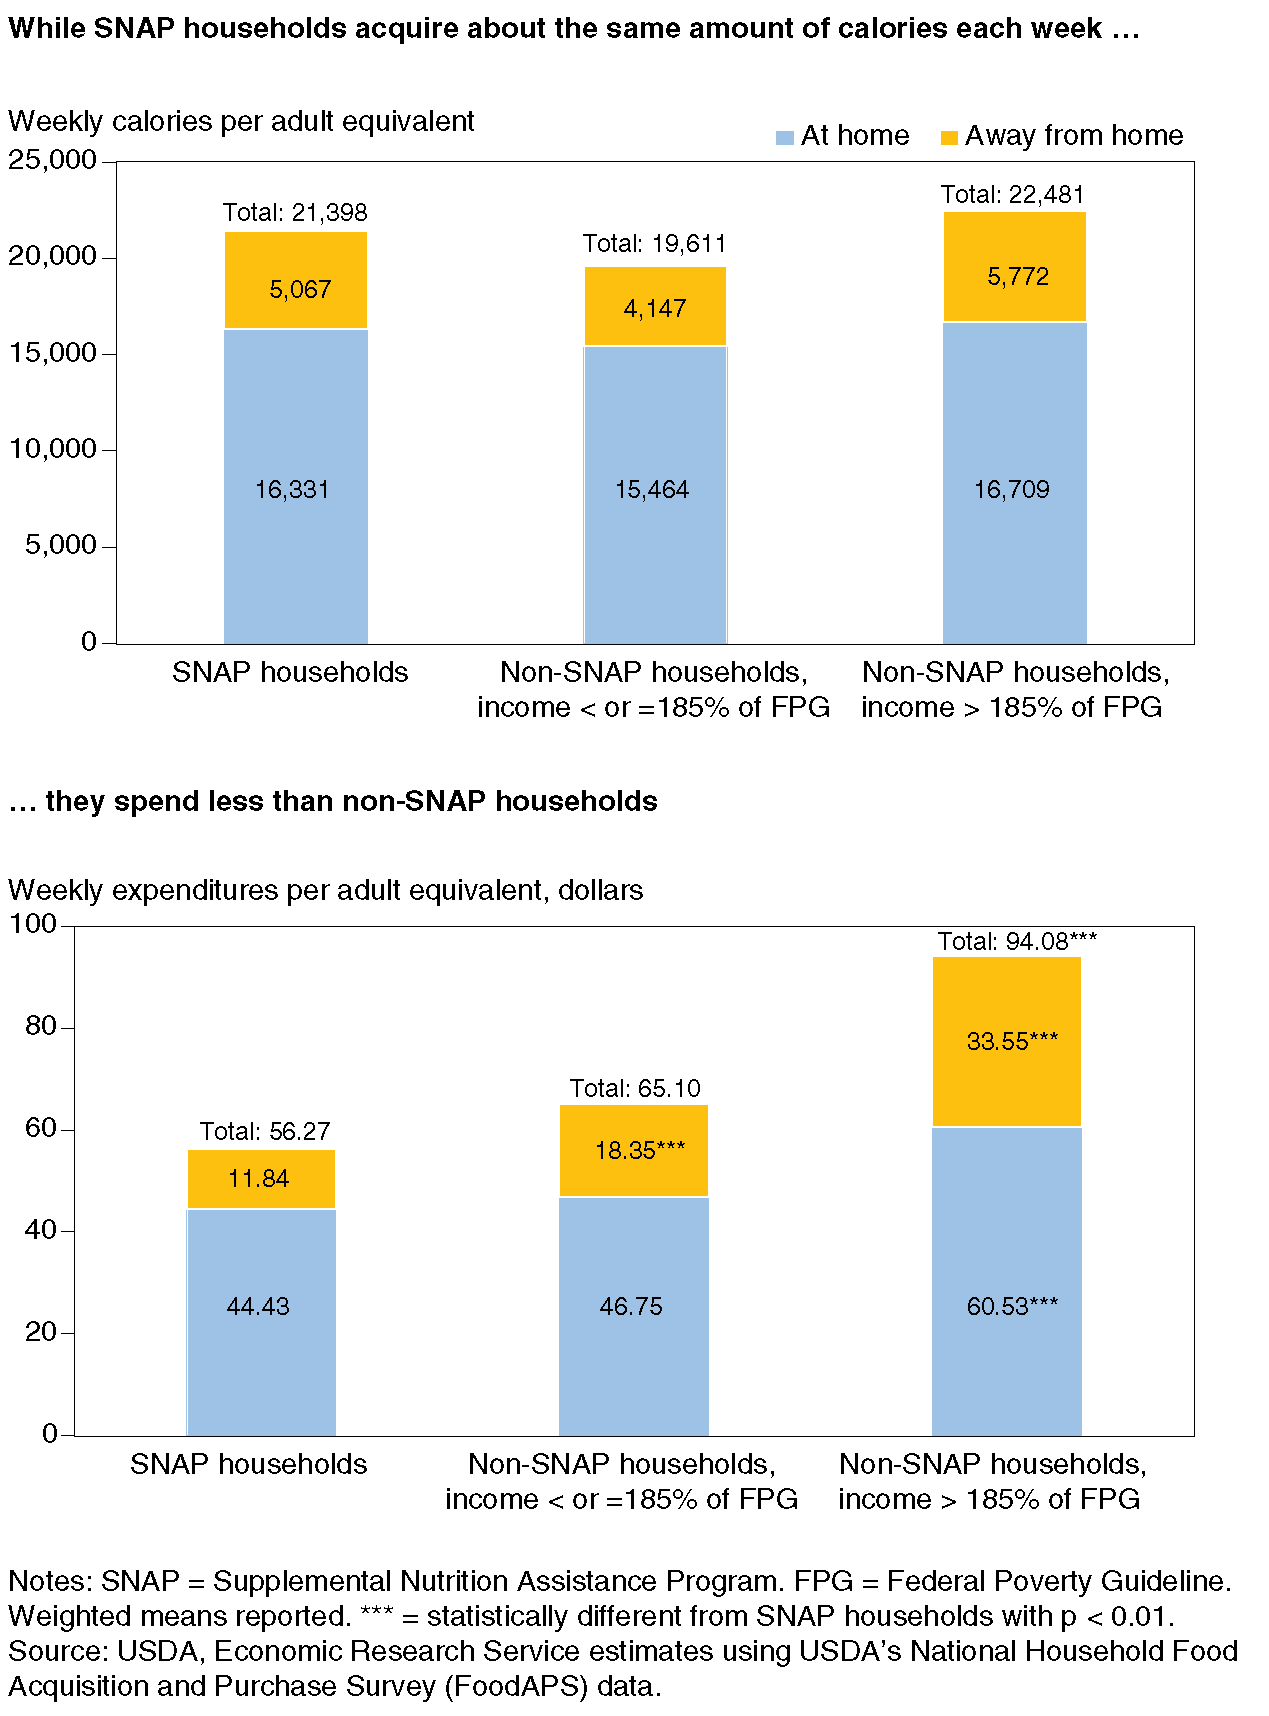
Average acquired calories per adult equivalent were similar for households from all three subgroups: SNAP households, households not participating in SNAP with incomes equal to or below 185 percent of the Federal poverty guideline (low-income non-SNAP households), and households not participating in SNAP with incomes above this level (higher income non-SNAP households). On a daily basis, SNAP households acquired roughly 3,000 calories per each adult equivalent, low-income non-SNAP households acquired 2,800, and higher income non-SNAP households acquired 3,200.
But estimates of expenditures per adult equivalent told a different story: on a per-adult-equivalent basis, SNAP households spent less, roughly $38 less per adult equivalent per week than higher income non-SNAP households and, although the difference was not statistically significant, $9 less than low-income non-SNAP households. Together, these findings suggest that SNAP households stretch their food budgets by acquiring calories at a lower cost than nonparticipating households.
The nutritional quality of foods purchased or otherwise acquired by Americans on average scored 53 out of 100 points using the HEI-2010. With the exception of total protein foods, the researchers found that none of the three groups met the benchmarks for components that make up a healthy diet, and all three groups exceeded the benchmark for diet components that should be eaten in moderation. Low-income non-SNAP households scored 51, higher income non-SNAP households scored 55, and SNAP households scored 48 on the HEI-2010.
SNAP households had lower acquisitions of vegetables, greens and beans, fruit, whole grains, and seafood and plant proteins than low-income and higher income non-SNAP households. SNAP households also acquired over 6 percent more empty calories than the other two groups as a share of total calories acquired.
However, it is important to remember that these associations do not prove a causal relationship between SNAP participation and nutritional quality. SNAP households differ from other groups in many characteristics—such as the number and ages of household members and the education levels of household heads—and these characteristics may be driving the variations in food choices and nutritional quality.
Nutritional Quality of Food-At-Home Choices Varies More Than Food-Away-From-Home Choices
Consumption of food away from home has been frequently investigated as a contributor to obesity trends—perhaps because obesity rates have increased as the number of calories consumers eat away from home has grown. Previous ERS studies found that Americans’ choices made when eating out come with higher calories, more sodium, and more empty calories than foods prepared at home. Differences in the nutritional composition of food at home and food away from home may reflect convenience, preferences, availability, or information factors. For example, packaged foods purchased in grocery stores have carried nutrition information labels since the mid-1990s, whereas at the time the FoodAPS data were collected, there was no Federal requirement for nutritional labeling on restaurant menus.
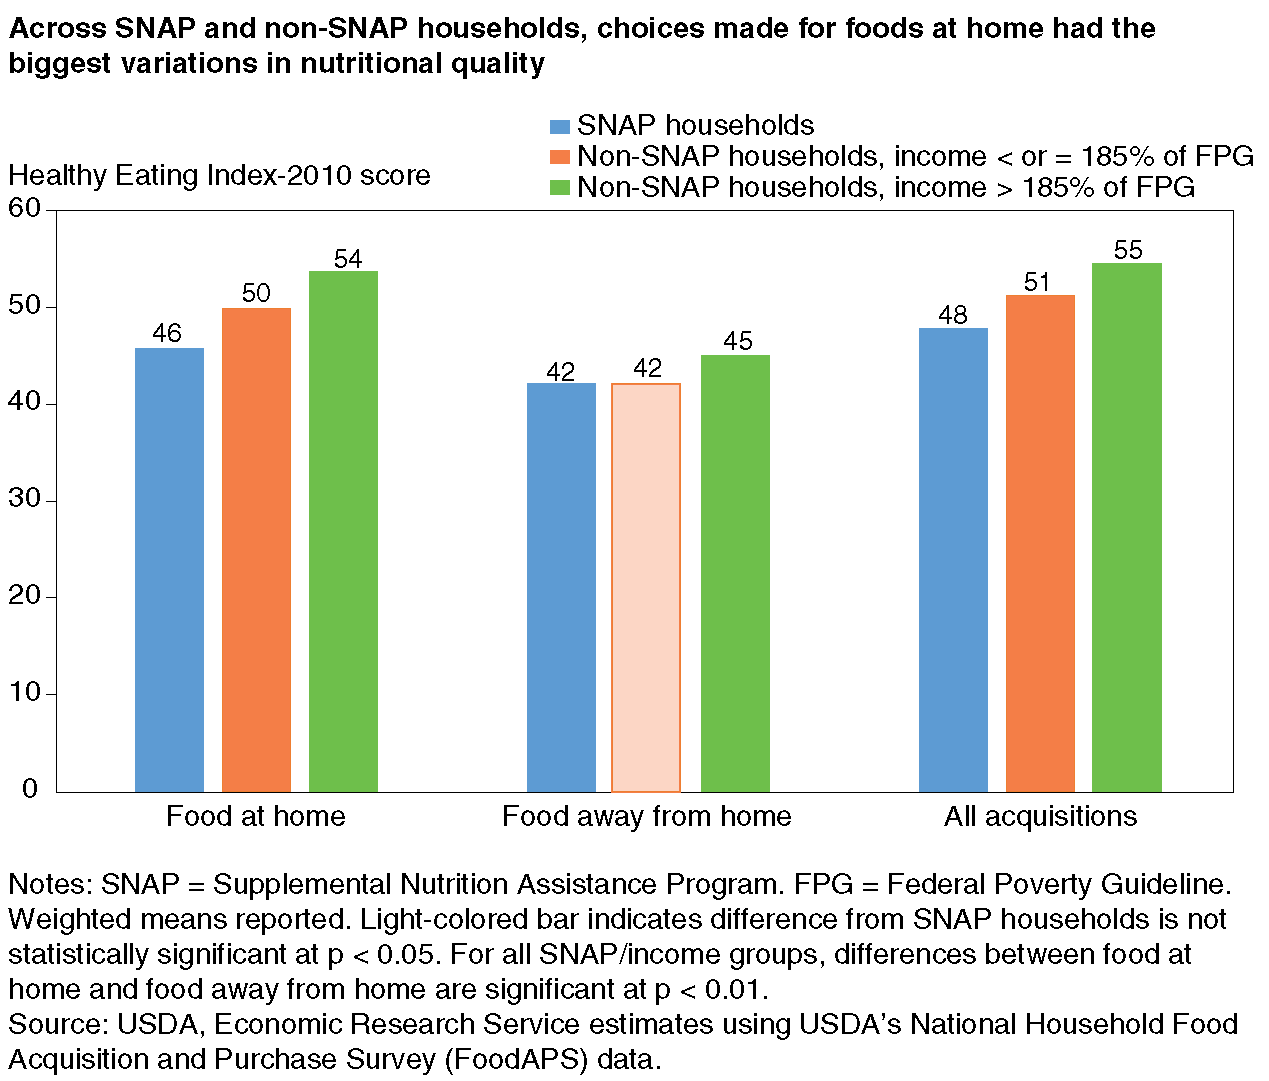
FoodAPS data show that the nutritional quality of foods acquired by all three groups from food-at-home sources is higher than those from away-from-home sources. However, the food-at-home acquisitions of SNAP households scored 8 points lower than higher income non-SNAP households on the HEI-2010 and 4 points below low-income non-SNAP households. The HEI-2010 scores for food-away-from-home acquisitions of SNAP households were the same as low-income nonparticipants and 3 points lower than the scores of food-away-from-home acquisitions of higher income nonparticipants.
Where Do Consumers Acquire Their Food?
Most shoppers acquire foods from multiple sources—supermarkets, convenience stores, fast-food restaurants, or family and friends are just a few options. Differences in how households choose among these categories can shed light on some of the observed differences in nutritional quality. Identifying where consumers acquire the bulk of their calories can also help to identify promising avenues for nutrition education efforts.
Regardless of SNAP participation or income, the main source of food was from large grocery stores—providing over 60 percent of a household’s calories over the week. For at-home sources, the second highest source of weekly calories was convenience, dollar, and other stores, with SNAP households acquiring about 1,000 more calories per adult equivalent per week from these types of stores than higher income nonparticipants. The third largest source of at-home calories was small and specialty food stores, such as fish markets and bakeries.
While SNAP households spent less per adult equivalent than either group of nonparticipants, they acquired similar levels of calories to those of higher income non-SNAP households and slightly more than those of low-income non-SNAP households. One way that SNAP households acquired similar amounts of calories at lower cost was by relying on different food sources, particularly away from home.
SNAP households acquired more weekly calories per adult equivalent from family and friends (roughly 370 more than higher income non-SNAP households), and fewer calories from restaurants and eating out (about 60 fewer than low-income non-SNAP households and about 1,500 fewer than higher income non-SNAP households).
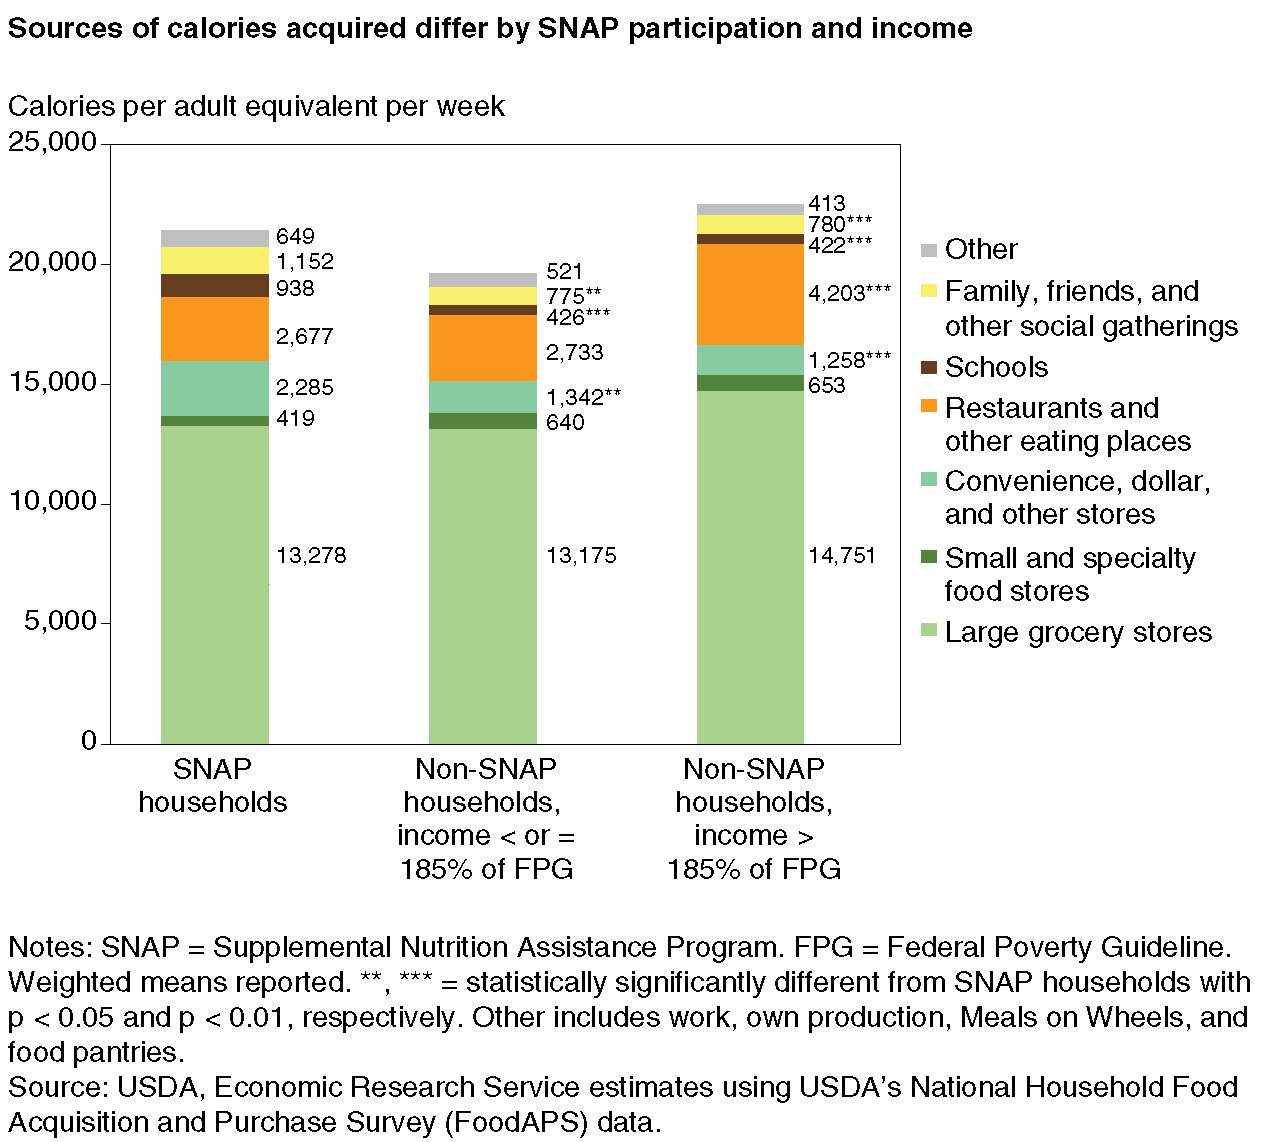
SNAP households also acquired more calories from schools—another source of away-from-home foods. SNAP households acquired about 500 more weekly calories per adult equivalent from schools than both low- and higher income non-SNAP households. Meals served as part of the National School Lunch and School Breakfast Programs must meet nutrition standards aligned with the Dietary Guidelines for Americans. And, whereas most food away from home is more expensive than at-home food purchases, children in low-income households are eligible for free or reduced-price USDA school meals, making them an economical and healthy choice for such families.
How Does Nutritional Quality Vary Across At-Home and Away-From-Home Sources?
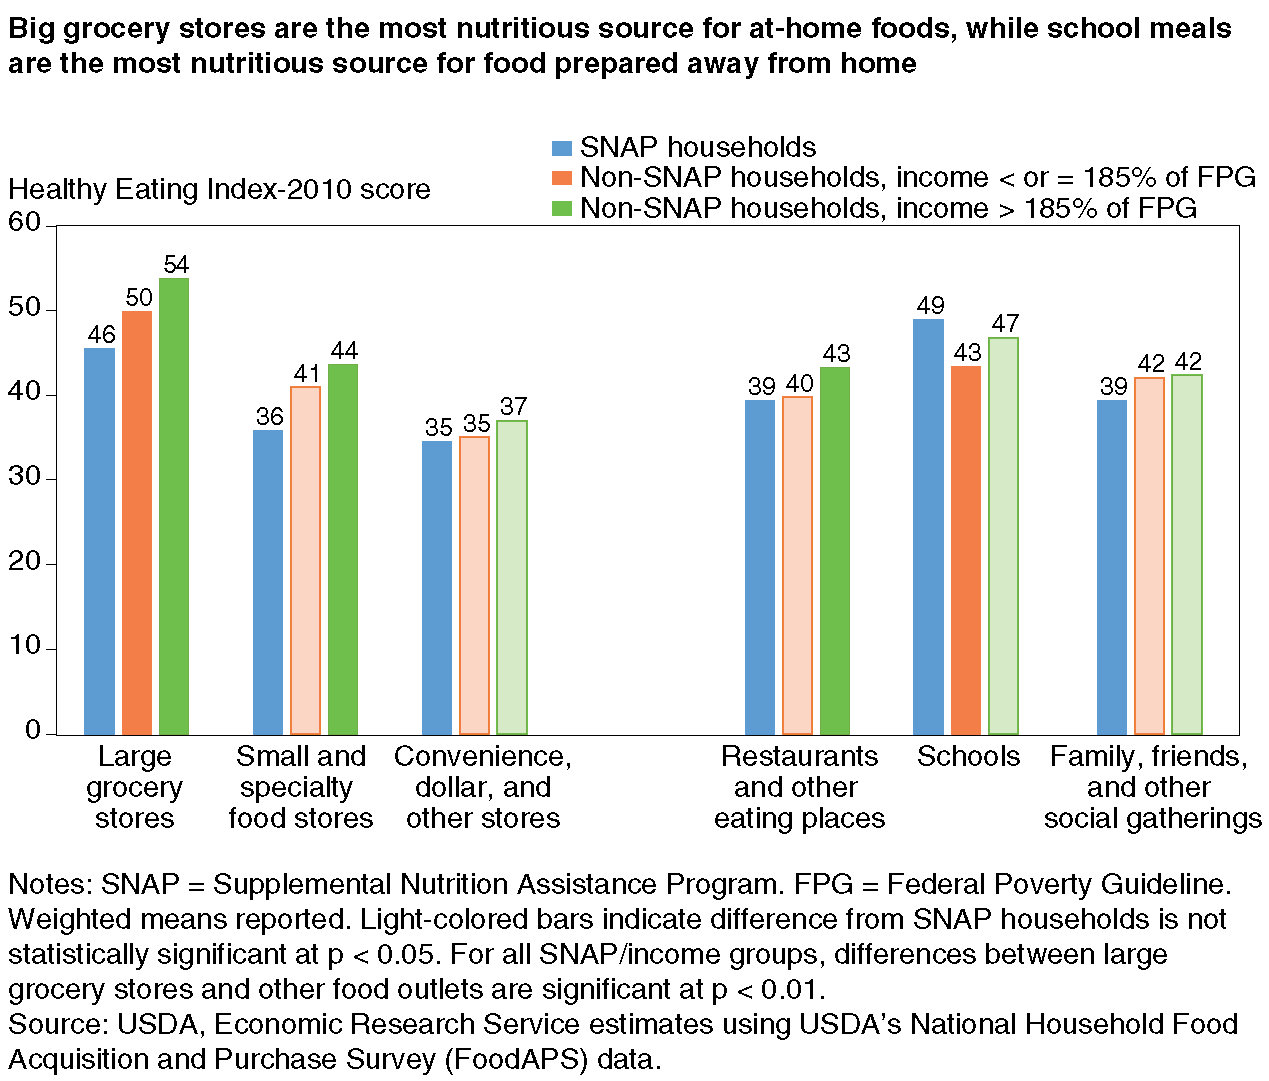
Large grocery stores, such as supermarkets and supercenters, typically offer a wide variety of fruits, vegetables, and protein foods, and are often used as a marker of availability of healthy and affordable food. Not surprisingly, FoodAPS data show that acquisitions from these stores had higher HEI-2010 scores than the other two food-at-home options—roughly 10 points higher than acquisitions from small and specialty food stores and between 11 and 17 points higher than acquisitions from convenience, dollar, and other stores.
While acquisitions from large grocery stores scored highest among food-at-home options for both SNAP and non-SNAP households, SNAP households’ acquisitions had lower HEI-2010 scores than either group of nonparticipants—4 points lower for low-income nonparticipants and 8 points lower than higher income nonparticipants. Because SNAP households acquire most of their calories from large grocery stores, improving the nutritional quality of these acquisitions is likely to have the largest effect of their overall diet quality.
Compared to higher income nonparticipants, SNAP households’ acquisitions from small and specialty food stores scored 8 points lower on the HEI-2010. While this suggests another potential avenue to improve overall diet quality, the effect is likely to be small, given these outlets make up less than 3 percent of SNAP households’ weekly calories.
For the full FoodAPS sample, HEI-2010 scores for school food were lower and provided fewer vegetables, fewer whole grains, less protein, and more refined grains than foods from large grocery stores. For SNAP participants, however, this was not the case. Foods from schools had higher HEI-2010 scores and provided more total fruit, whole fruit, and whole grains—and fewer empty calories—compared to acquisitions from large grocery stores. These findings may reflect the fact that children in SNAP households were more likely to consume the nutritious meals provided by USDA’s National School Lunch and School Breakfast Programs, while acquisitions from nonparticipants tended to include more foods from vending machines and à la carte items, which tend to have lower nutritional quality.
Regardless of SNAP participation or income, acquisitions from convenience, dollar, and other food-at-home stores had the lowest HEI-2010 scores, and there were no noticeable differences between SNAP and non-SNAP households. For SNAP households and both groups of non-SNAP households, acquisitions from food-away-from-home venues, like restaurants or fast-food places, also scored lower than acquisitions from grocery stores. However, higher income non-SNAP households acquired healthier foods when eating away from home than SNAP households.
Supermarket Choices Offer Opportunity for Dietary Improvement
SNAP households spend most of their food dollars in supermarkets and other large grocery stores, which typically offer the widest selection of nutritious foods. Nevertheless, the nutritional quality of their purchases lags that of other consumers. SNAP households face multiple challenges that complicate the task of making healthy, economical choices. In addition to lower incomes, SNAP households also tend to be younger, less educated, and more likely to be single parents.
Strategies focused on helping SNAP participants make more nutritious choices in the supermarket may be particularly useful. USDA’s SNAP-Ed program offers nutrition education to SNAP participants and other low-income Americans to help them make healthy, economical food choices. Understanding SNAP households’ food choices and the factors that influence their choices could assist officials in SNAP-Ed develop practical strategies to help low-income households make healthier choices within their income constraints.
This article is drawn from:
- Mancino, L., Guthrie, J., Ver Ploeg, M. & Lin, B. (2018). Nutritional Quality of Foods Acquired by Americans: Findings From USDA’s National Household Food Acquisition and Purchase Survey. U.S. Department of Agriculture, Economic Research Service. EIB-188.
- Lin, B. & Guthrie, J. (2012). Nutritional Quality of Food Prepared at Home and Away From Home, 1977-2008. U.S. Department of Agriculture, Economic Research Service. EIB-105.
You may also like:
- Mancino, L. & Guthrie, J. (2014, November 3). SNAP Households Must Balance Multiple Priorities To Achieve a Healthful Diet. Amber Waves, U.S. Department of Agriculture, Economic Research Service.
- Tiehen, L., Newman, C. & Kirlin, J.A. (2017). The Food-Spending Patterns of Households Participating in the Supplemental Nutrition Assistance Program: Findings From USDA's FoodAPS. U.S. Department of Agriculture, Economic Research Service. EIB-176.
- Todd, J.E. & Scharadin, B. (2016). Where Households Get Food in a Typical Week: Findings from USDA’s FoodAPS. U.S. Department of Agriculture, Economic Research Service. EIB-156.