
Large Family Farms Continue To Dominate U.S. Agricultural Production
- by James M. MacDonald and Robert A. Hoppe
- 3/6/2017
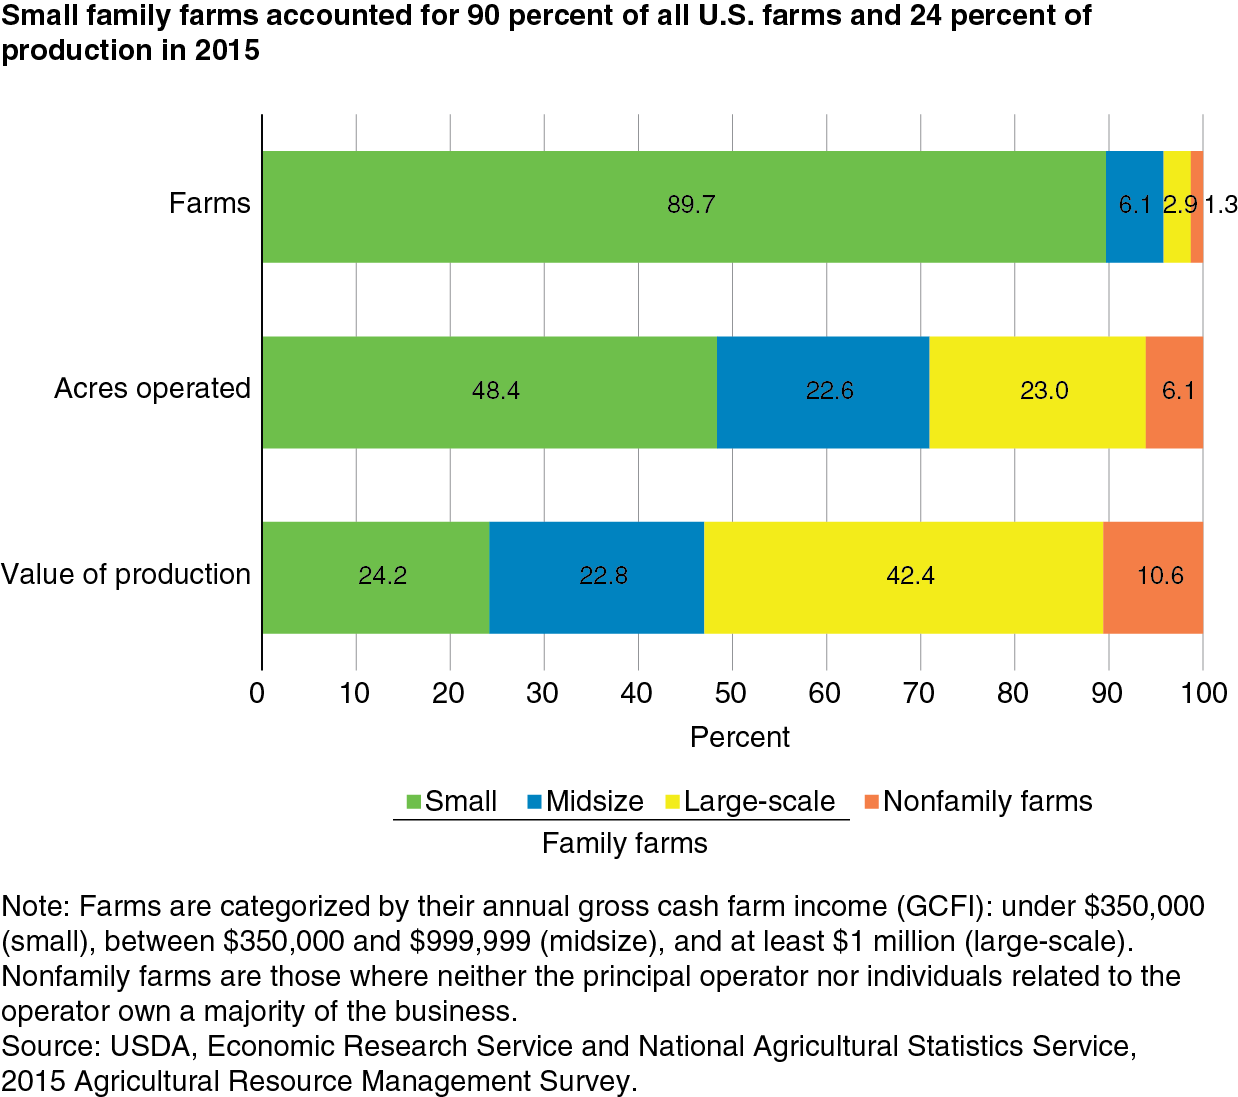
Family farms play a dominant role in U.S. agriculture. In 2015, these farms accounted for 99 percent of U.S. farms and 89 percent of production. On family farms, the principal operators and their relatives (by blood or marriage) own more than half of the business’s assets—in short, a family owns and operates the farm.
In 2015, 90 percent of U.S. farms were small family operations with under $350,000 in annual gross cash farm income (GCFI)—a measure of revenue that includes sales of crops and livestock, Government payments, and other farm-related income. These small farms, however, only accounted for 24 percent of the value of production. By comparison, large-scale family farms with at least $1 million in GCFI made up only 2.9 percent of U.S. farms but contributed 42 percent of total production. Nonfamily farms accounted for only 11 percent of agricultural production.
Production has been shifting to larger farms for many years. Family and nonfamily farms with over $1 million in GCFI accounted for half of the value of U.S. farm production in 2015, up from about a third in 1991. That comparison takes account of inflation in farm product prices over time, and therefore reflects shifts of production to larger farms.
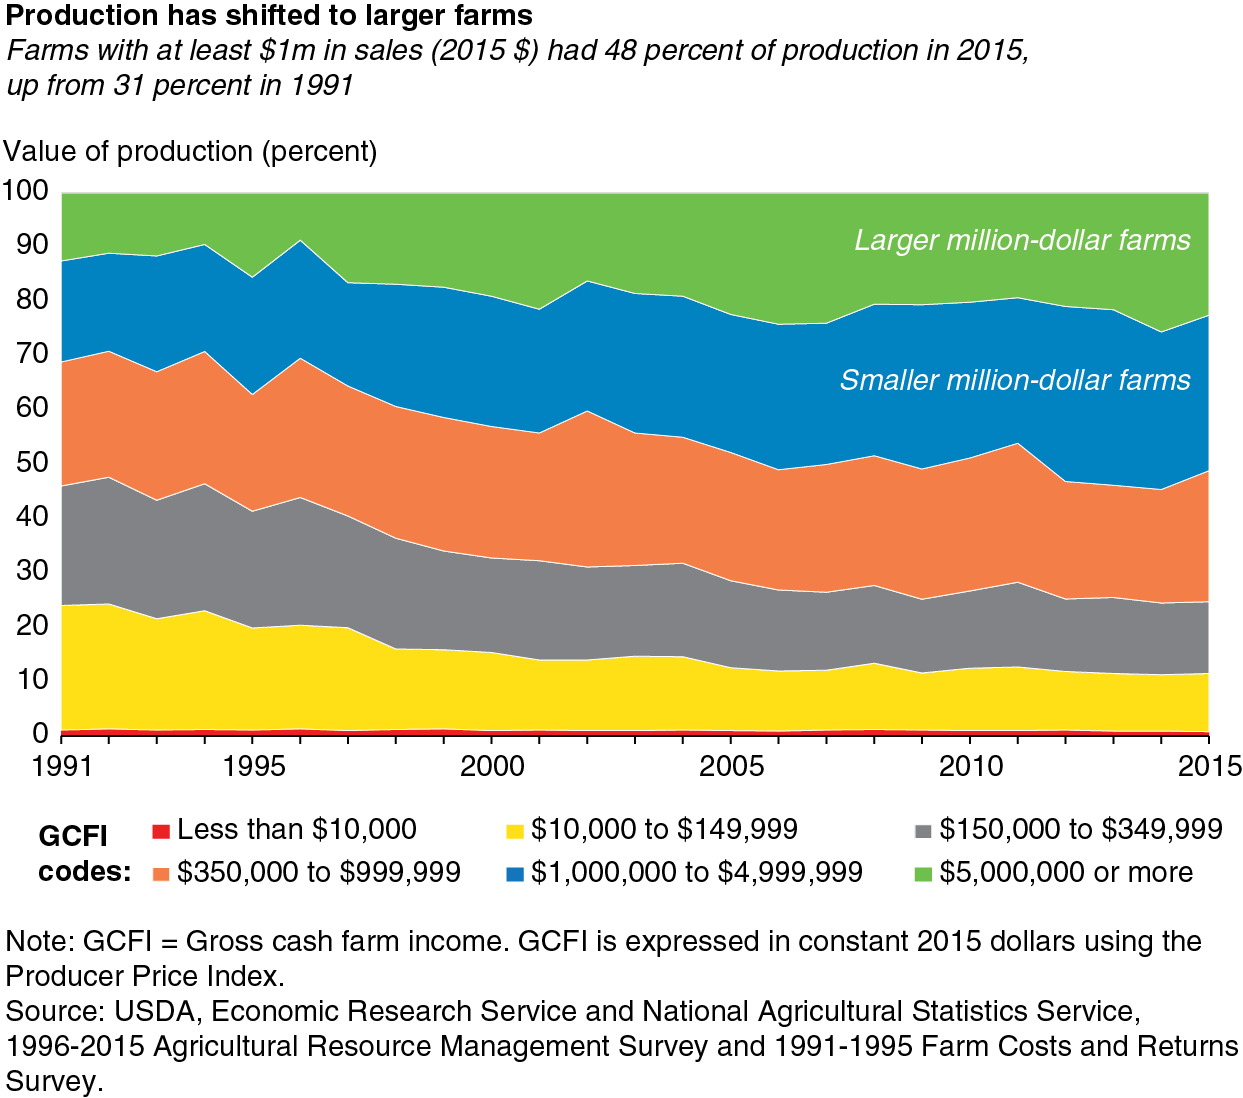
The shift has come at the expense of small farms. Small family and nonfamily farms accounted for 46 percent of production in 1991, but by 2015, that share had fallen under 25 percent.
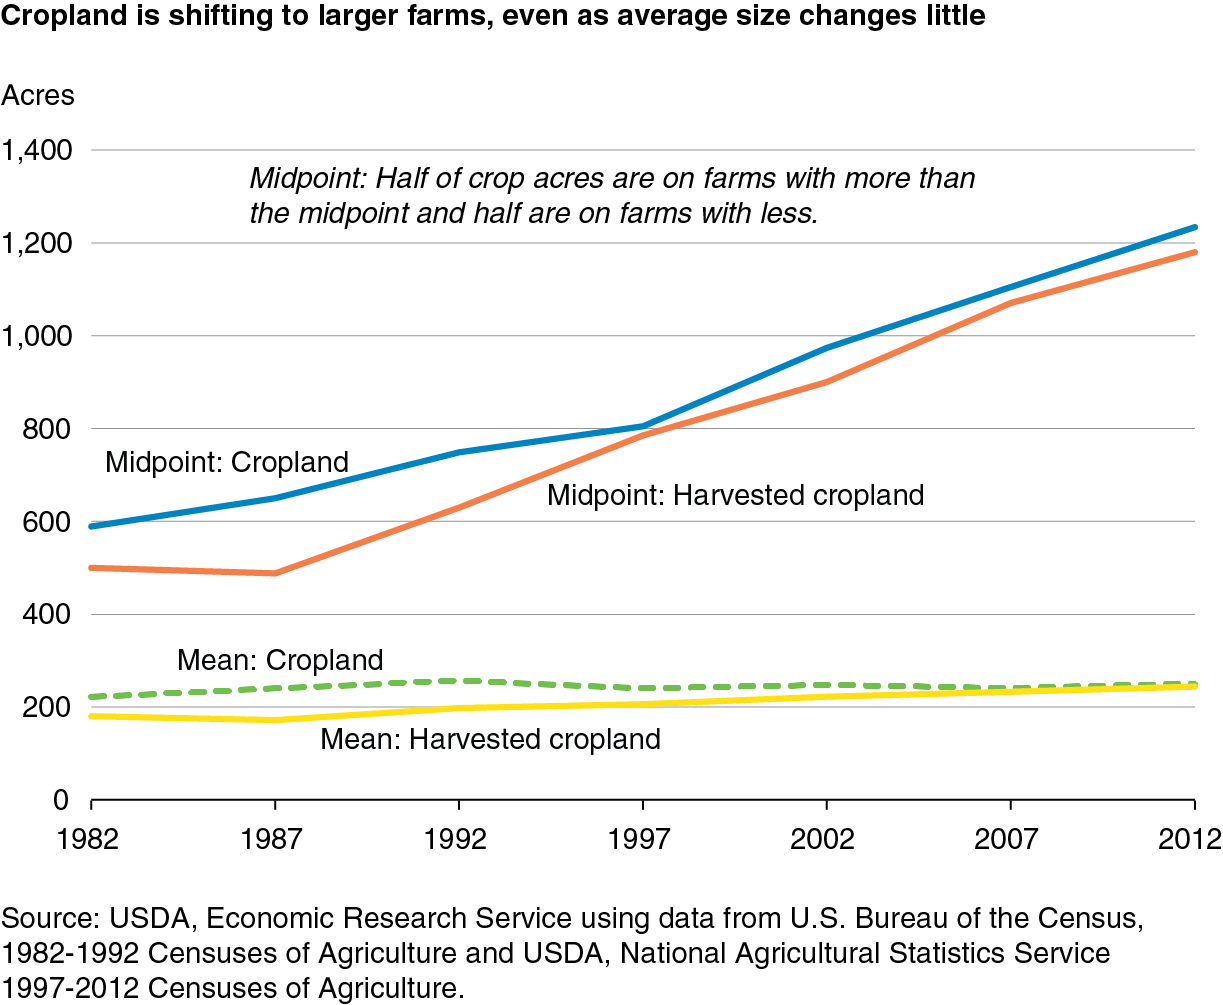
Cropland has also shifted to larger farms. For example, the midpoint size—the farm size that marks the middle of the distribution of cropland—was 589 acres in 1982. This means that half of U.S. cropland was on farms that operated under 589 acres, and the other half was on farms that operated over 589 acres. As cropland shifts to relatively large farms, the midpoint increases—as it has done steadily over the last 30 years—reaching 1,234 acres by 2012. This shift was not only large and persistent but also ubiquitous, occurring in almost all States and for all crops.
Even as the midpoint farm size increased over time, the average (mean) farm size changed little. Among farms with cropland, the average size was 222 acres in 1982, 257 acres in 1992, and 251 acres in 2012. The relative stability in the mean follows from a decline in the number of midsize farms as cropland consolidated into larger operations. This trend, in turn, was offset to a great extent by an increasing number of very small farms (under 20 acres of cropland) since the early 1990s.
The increase in the number of very small farms may reflect more small fruit and vegetable operations. But much of the increase likely reflects improved data collection efforts in the census and USDA surveys since 1997, as well as the effect of inflation. USDA defines a farm as any place that sells or could normally have sold $1,000 worth of agricultural commodities in a year. Average farm commodity prices rose by 94 percent between 2002 and 2012, so a place with $550 in sales in 2002 would not have been counted as a farm. But the same quantity of production would properly have qualified it as a farm in 2012 by reaching the $1,000 sales threshold after price inflation.
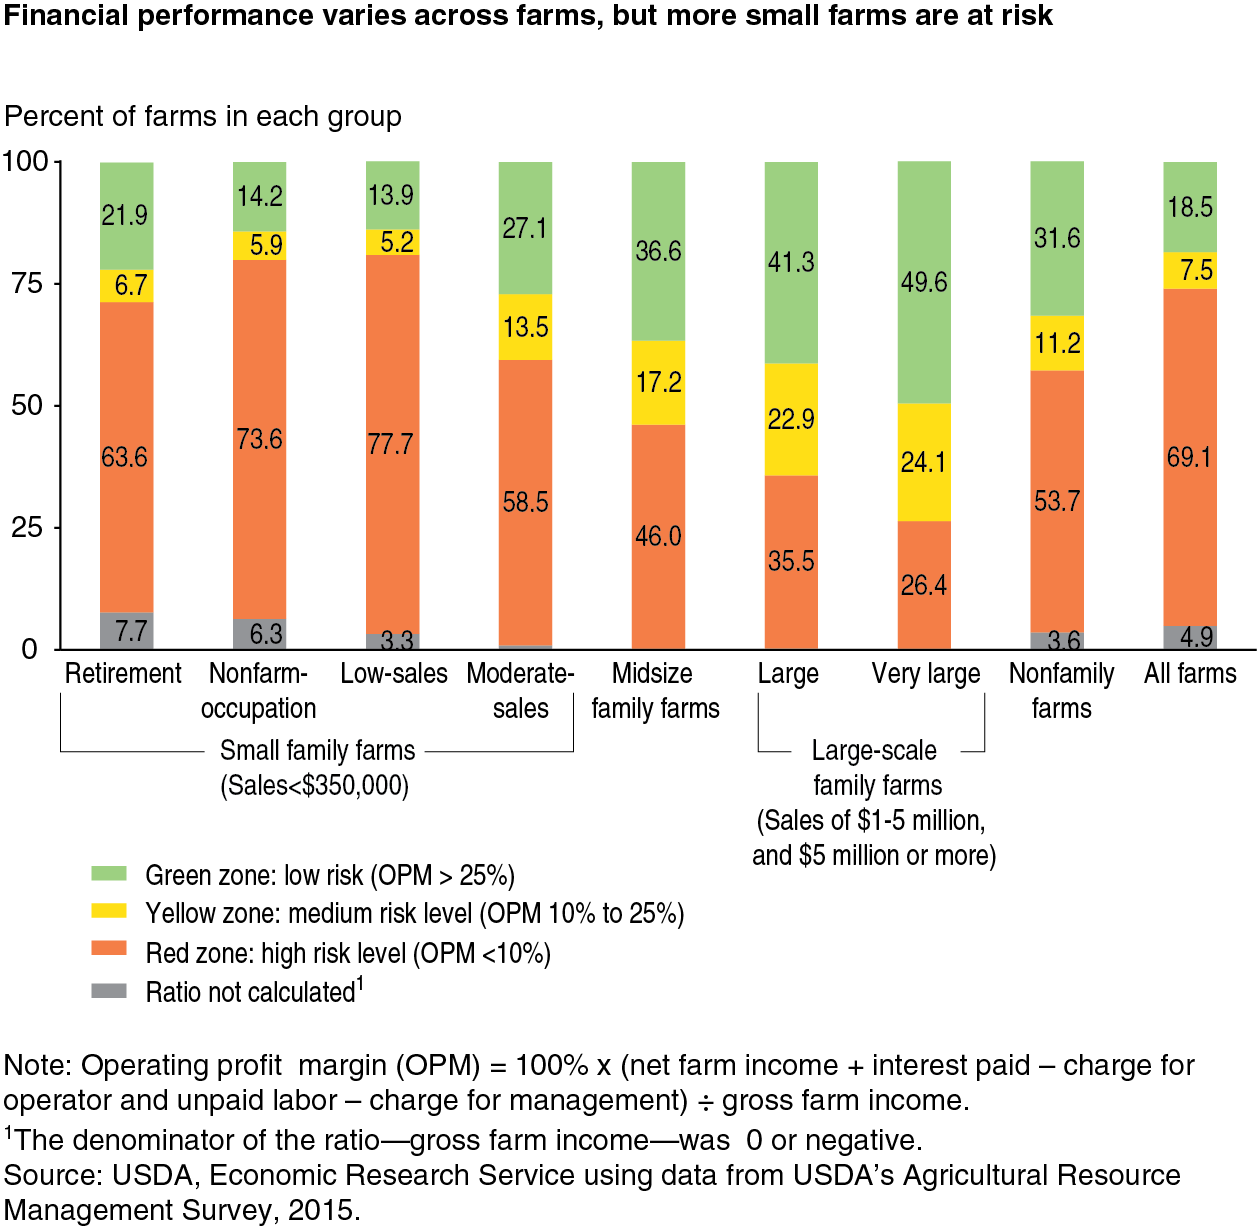
Ongoing innovations in agriculture have enabled a single farmer, or farm family, to manage more acres or more animals. Farmers who take advantage of these innovations to expand their operations can reduce costs and raise profits because they can spread their investments over more acres. In 2015, larger family farms displayed stronger financial performance, on average, than smaller farms. For example, 74 percent of very large family farms (GCFI of $5 million or more) had estimated operating profit margins in excess of 10 percent of sales in 2015—compared to 54 percent of midsize family farms (GCFI of $350,000 to $999,999) and 41 percent of moderate-sales small family farms (GCFI of $150,000 to $349,999).
Following these margins over time shows that these differences persist regardless of the performance of the farm sector. Farm sector financial performance has weakened in recent years: ERS estimates that sector net farm income in 2015 was 13 percent lower than in 2014 and 35 percent below the record value of 2013. The persistent gap in financial performance between large and small farms in 2015 indicates that consolidation is likely to continue.
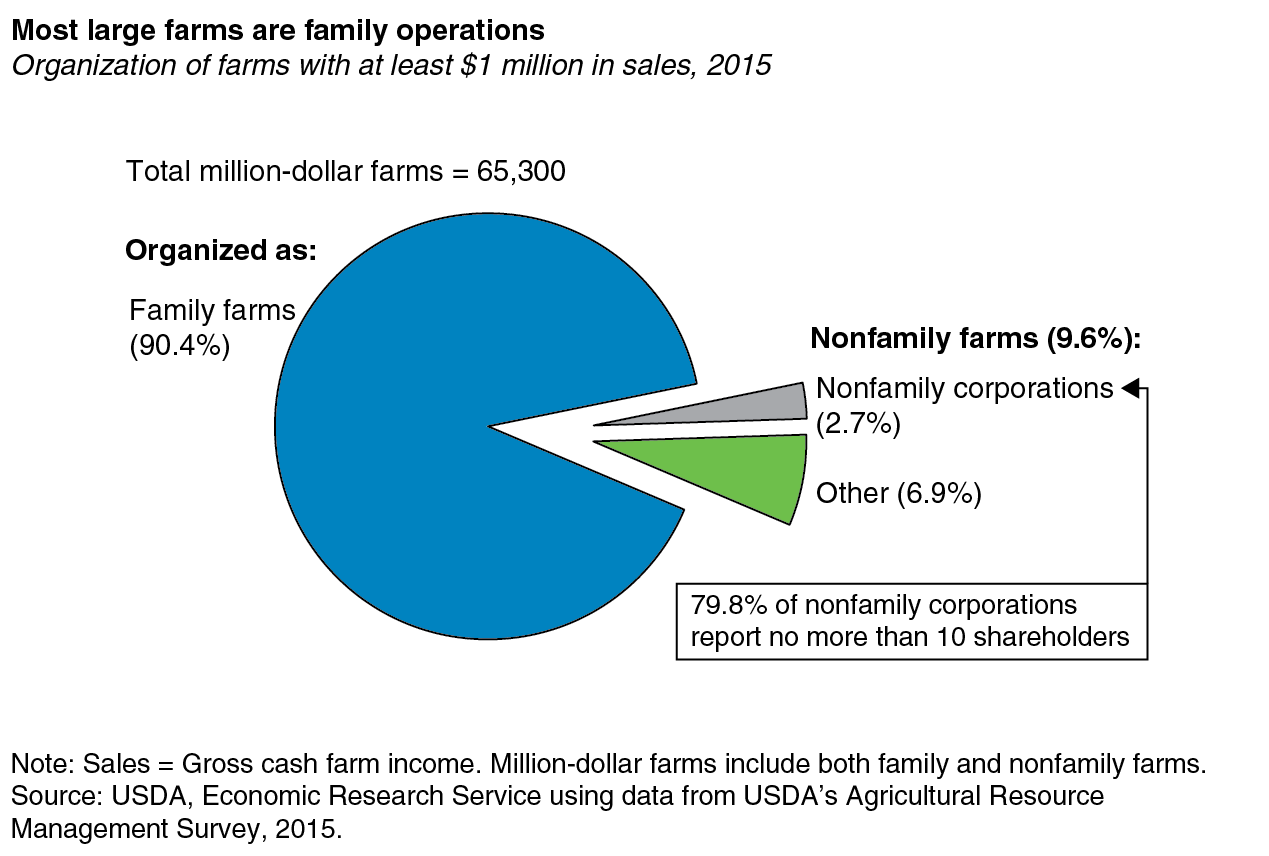
Most large-scale U.S. farms in 2015 were family operations: over 90 percent (about 59,000 farms). Among the 6,300 large nonfamily farms, about 1,760 were organized as corporations, with almost all of the rest organized as partnerships among unrelated individuals; as cooperatives; or as farms operated by hired managers on behalf of trusts, estates, families, or institutions.
Most of the large nonfamily farms that were organized as corporations had 10 or fewer shareholders. Corporations with more than 10 shareholders operated a few hundred large U.S. farms, or about 0.5 percent of all large U.S. farms. Large corporations play an important role in setting procurement standards and organizing supply chains for farm products, but they directly operate very few U.S. farms.
This article is drawn from:
- Hoppe, R.A. & MacDonald, J.M. (2016). America's Diverse Family Farms, 2016 Edition. U.S. Department of Agriculture, Economic Research Service. EIB-164.