
The Relationship Between Energy Prices and Food-Related Energy Use in the United States
- by Patrick Canning and Sarah Rehkamp
- 6/5/2017
Highlights
- The U.S. food system accounted for 12.5 percent of the Nation’s energy use in 2012.
- Three-quarters of the energy used by the U.S. food system in 2012 was in the form of electricity and natural gas.
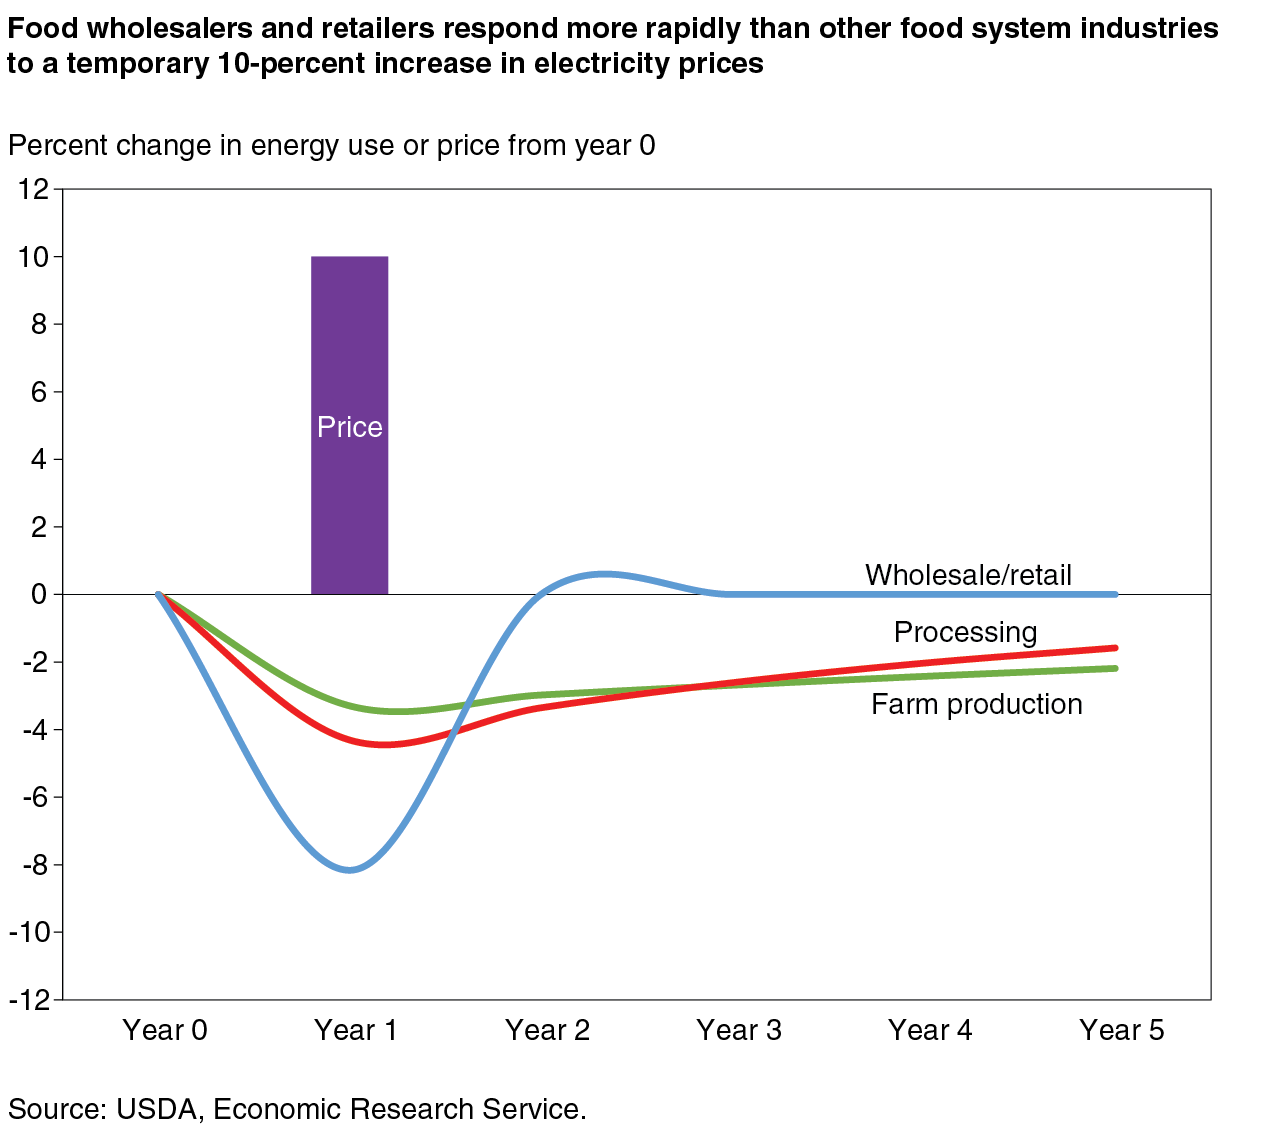
- Within the first year after facing a 10-percent increase in electricity prices, food processors would reduce electricity use by about 4 percent; food wholesalers and retailers would curb use by about 8 percent.
Food-related energy use includes all energy used in the production and preparation of foods and beverages purchased by and for U.S. consumers. Natural gas is used to produce the fertilizers applied on farms, and farmers use diesel fuel to run their tractors. Gasoline is used in transporting fresh produce from farms to grocery stores and restaurants, and from grocery stores to homes. Processing plants, supermarkets, and restaurants use electricity to power their equipment and lights. And consumers use electricity in their homes to run kitchen appliances.
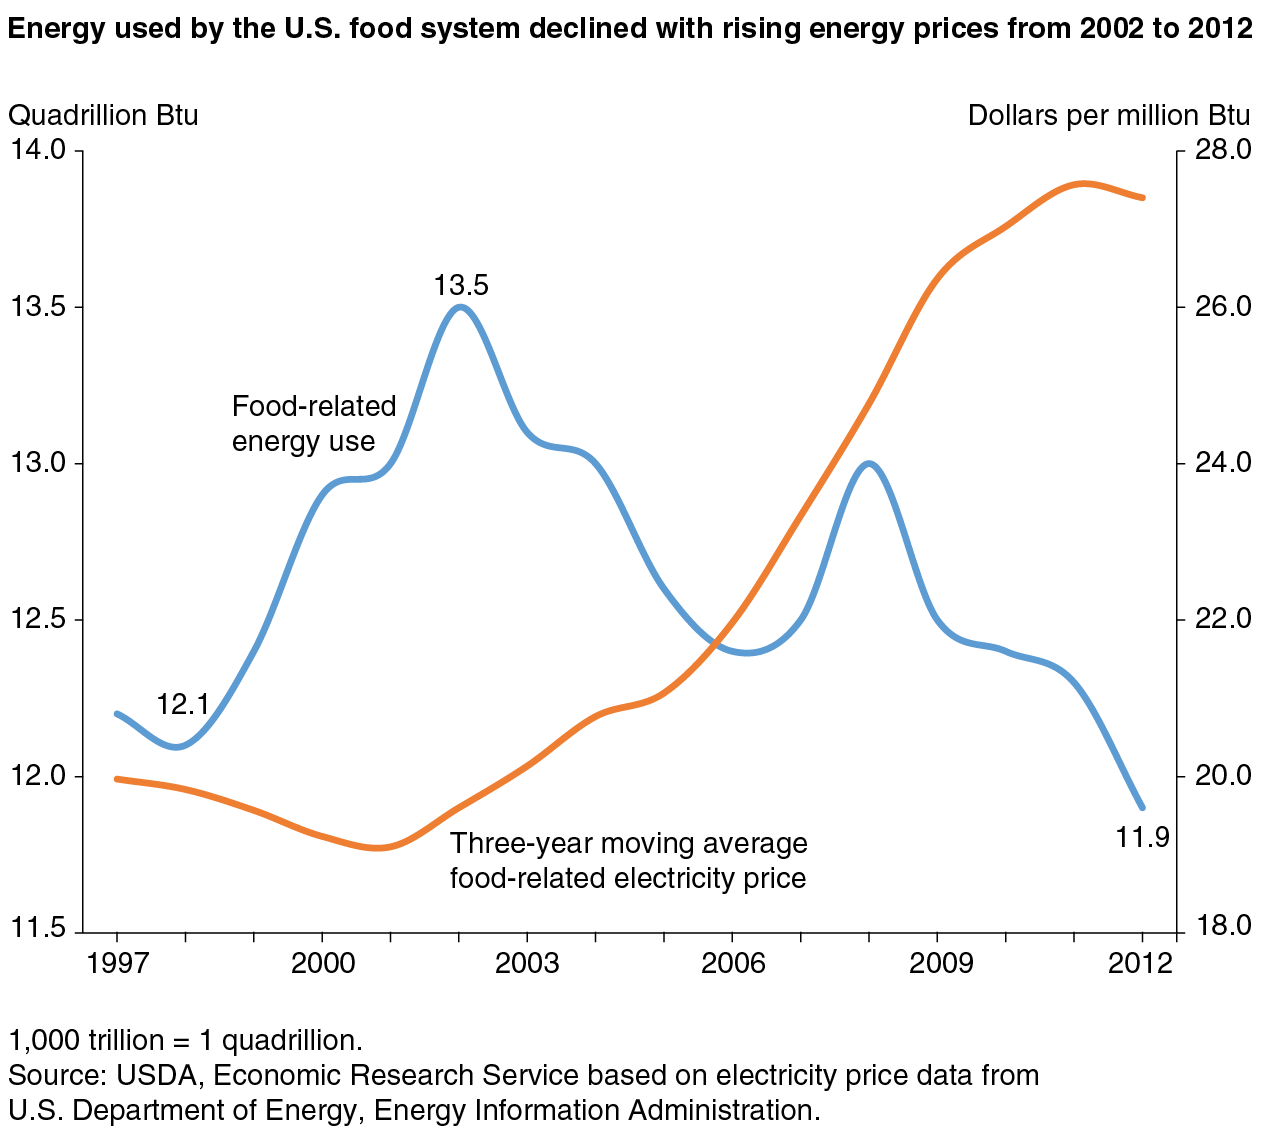
Researchers at ERS looked at energy use over time and found that in 1997, the U.S. food system used 12.2 quadrillion British thermal units (qBtu). Energy use increased over the next few years, peaking in 2002, when food-related energy use reached 13.5 qBtu. After that, energy use trended downward, dropping to 11.9 qBtu in 2012, the end of the time period measured—an economically rational response to rising energy prices at the time.
Electricity Is the Main Energy Source for Most Food-System Industries
To assess direct and indirect energy used throughout the U.S. food system, ERS researchers developed a dataset called the Food Environment Data System (FEDS) and an accompanying Environmental Input-Output (EIO) model (FEDS-EIO). This dataset and model relied heavily on the 1997, 2002, and 2007 benchmark data from the U.S. Department of Commerce’s Bureau of Economic Analysis, similar but less detailed annual data (1993 to 2012) from the U.S. Department of Labor’s Bureau of Labor Statistics, and the State Energy Data System from the U.S. Energy Information Administration. These data describe all market transactions throughout the economy, allowing estimates of the amount of energy used directly and indirectly by the U.S. food system.
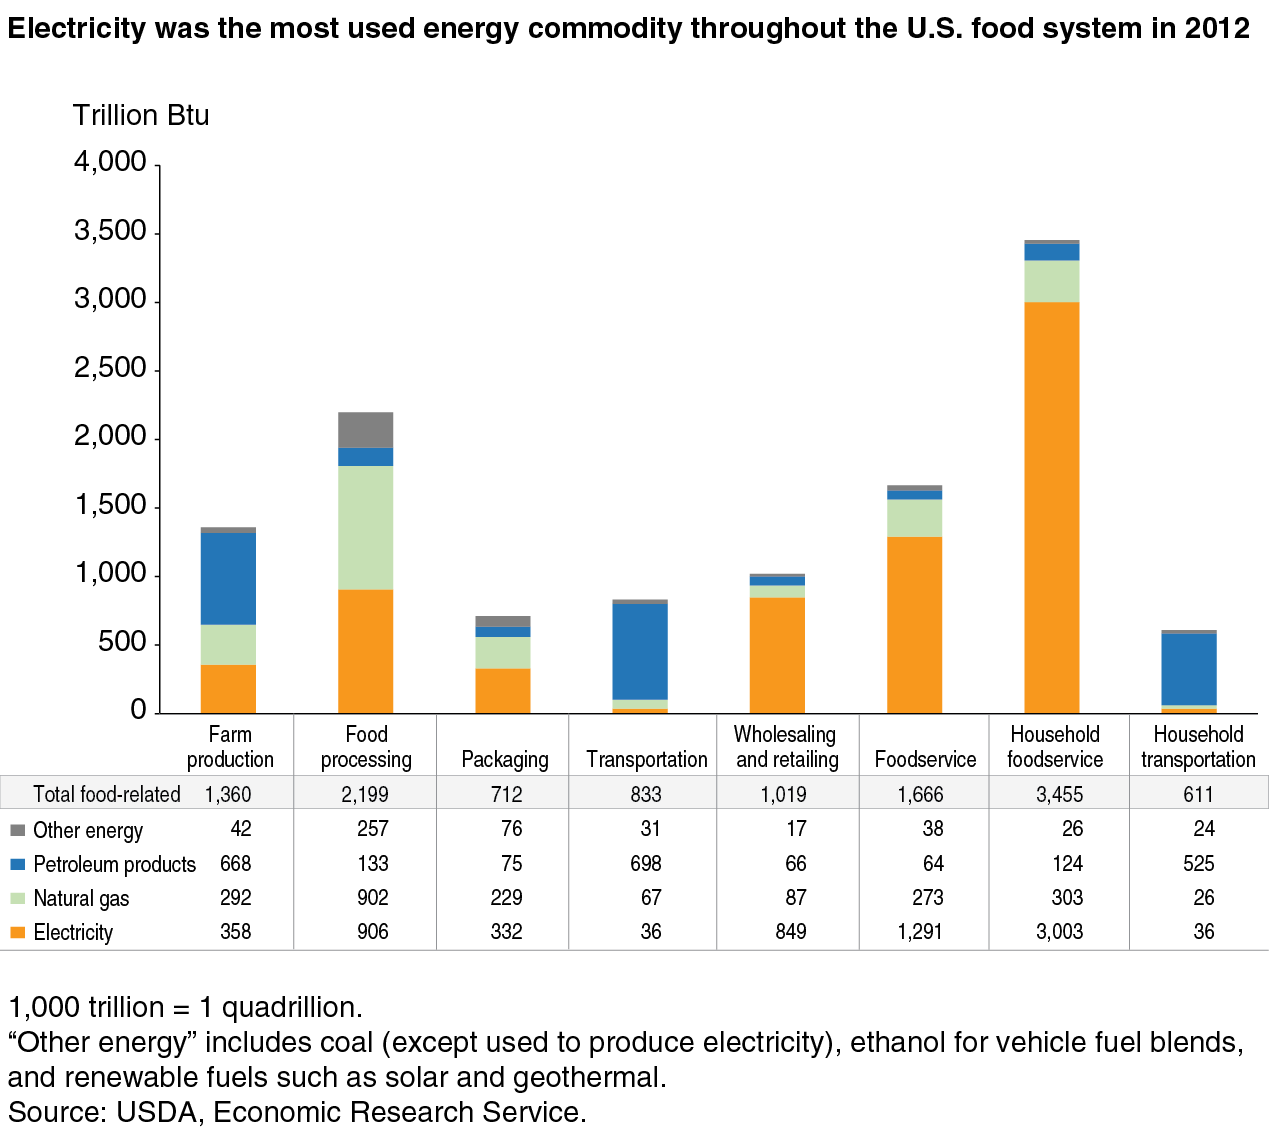
Of the 11.9 qBtu used by the food system in 2012, 1.4 qBtu were used by the producers who grew the crops, raised the livestock, and produced agricultural inputs such as fertilizers and farm machinery. Food and beverage processors, such as meat packers, commercial bakeries, and breweries, used 2.2 qBtu. Other industry groups used 4.2 qBtu in energy through all points of purchase, including wholesalers and food retailers (1.0 qBtu); foodservice establishments, such as restaurants with wait staff, fast food places, and coffee shops (1.7 qBtu); trucking and other commercial freight services (0.8 qBtu); and the packaging industry (0.7 qBtu).
The remaining 4.1 qBtu attributed to the food system were used at the household level in kitchens (3.5 qBtu) and for food-related transportation (0.6 qBtu). That means the energy used directly—to drive to the grocery store and to power refrigerators, stoves, and other kitchen appliances— and indirectly—to build those appliances— accounted for more than a third of total U.S. food-related energy use in 2012.
Electricity accounted for an average of 58 percent of total food-system energy use over the 20-year period (1993 to 2012) studied by the ERS researchers. The largest electricity users in the food system are households, to run kitchen appliances, followed by foodservice establishments, such as fast food restaurants and coffee shops. Other major users of electricity in the food system include wholesalers and retailers, such as grocery stores, and food processors like meat packing plants and ice cream manufacturers.
The other two major sources of energy used by the U.S. food system are natural gas and petroleum products, such as gasoline and diesel. Farm production and both commercial food-related transportation and household food-related transportation (trips to grocery stores) are the major users of petroleum products, primarily to run their vehicles and other machinery. Natural gas is a major source of energy among food processors and is on par with their use of electricity.
Rising Price of Electricity Resulted in Reduced Use Throughout the U.S. Food System
In the years leading up to 2002, electricity prices paid by U.S. processing plants, grocery stores, restaurants, and other food-system participants—including consumers for their kitchen appliances—were trending downward. As a result, the U.S. food system substantially increased its use of energy between 1998 and 2002 and accounted for over half of the increase in the total energy used nationwide over this period.
Between 2000 and 2010, the average price paid for electricity across the U.S. food system increased about 50 percent. Faced with this steep increase in electricity prices, food-related energy use declined over most of this period, falling to 11.9 qBtu in 2012. Food-related energy use accounted for 12.5 percent of the Nation’s energy budget that year.
The trends in U.S. food-related energy use and electricity prices indicate a negative relationship between the two. The ERS researchers conducted a statistical analysis of this relationship to measure the rate and intensity of reactions to changing energy prices among the different stages of the food system, from farm production through all points of consumer purchases.
They found that different stages of the food supply chain react at different paces and intensities. For example, if faced with a one-time, temporary 10-percent increase in the price of electricity, wholesalers and retailers would reduce their electricity use per customer by about 8 percent in the year of the price increase. Electricity use per customer would return to previous levels when electricity prices returned to levels before the 10-percent increase.
In contrast, farm producers and food processors would decrease their electricity use per unit of production by lesser amounts—3.3 percent and 4.3 percent respectively—in the year of the 10-percent price increase, and would not fully return to previous levels, even 4 years after prices returned to pre-price increase levels. These results indicate that all stages of the food supply chain are price sensitive, but their responses vary.
There are several hypotheses for why farmers, processors, and wholesalers/retailers react differently to changing electricity prices. Different types of businesses have varying access to more efficient equipment—for example switching to slightly more expensive energy-efficient lighting. Another reason could be that some businesses are more able than others to pass costs of higher electricity prices on to their customers and so are less likely to take measures to avoid the higher costs of using electricity. Businesses already in long-term price contracts with their energy suppliers may be slower to react to temporary changes in energy prices. On the other hand, businesses able to lock in expected future energy price changes with a pre-arranged price change schedule are likely to react more decisively to these expected changes.
The U.S. Food System Can Drive National Trends in Energy Use
The ERS researchers compared their analysis of food-system energy use with other analyses of economywide energy use in the United States. Their comparison showed that percentage increases in electricity use would be greater among food-system industries than for nonfood-related industries in response to an equal percentage price drop faced by all U.S. industries. Similarly, food industries would decrease electricity use by a greater percentage than other industries in response to an equal percentage rise in electricity prices.
The U.S. annual energy budget has ranged from 88 to 101 qBtu between 1993 and 2012, ending this period at around 95 qBtu. Food-related energy use has ranged between 12 and 14 qBtu over this same period, which is not a trivial share of the national energy budget. Given the food system’s above-average sensitivity to electricity prices, it has the ability to drive nationwide energy consumption trends during periods of sustained electricity price increases or decreases.
Presenting energy-use data on a per capita basis has the effect of removing population-driven change in energy use. For example, even if the average amount of energy used per person in the United States did not change from year to year, total national energy use would still increase given the growing U.S. population. Measured as energy use per person, use of energy by food-related and nonfood-related industries can move in opposite directions.
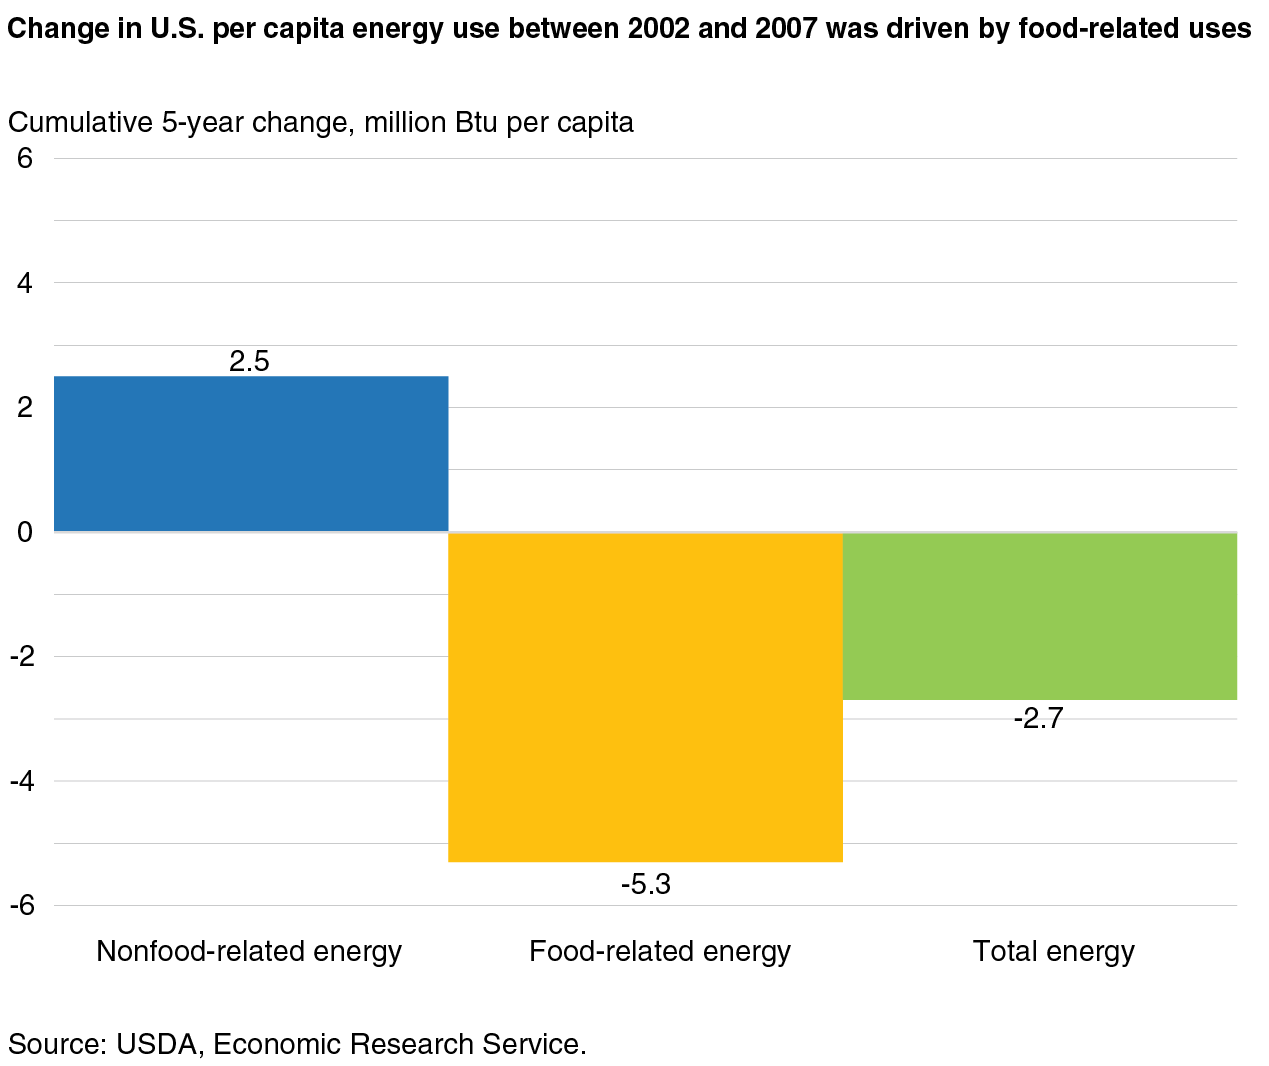
This was the case between 2002 and 2007—a period of rising energy prices. For example, between 2002 and 2003, food-related energy use per person in the United States declined by 1.8 million Btu (mBtu) and declined again by 0.6, 1.6, 1.2, and 0.1 mBtu in subsequent years, for a cumulative 5-year change of -5.3 mBtu per person. This change is equivalent to each American using about 48 gallons less regular unleaded gasoline over this 5-year period.
Over this same time period, nonfood-related energy uses increased in 3 of the 5 annual intervals and ended the period with a cumulative increase of 2.5 mBtu per person. So while nonfood-related energy uses per person trended up between 2002 and 2007, food-related declines far exceeded this increase, such that national average per capita energy use declined by 2.7 mBtu between 2002 and 2007.
Food and energy are staple goods for American consumers. This new ERS study shows that the food system accounts for a large share of the annual energy budget in the United States and is highly responsive to energy prices. The contribution of energy costs was measured to be as high as 7.5 percent of annual food expenditures at supermarkets and other food stores in 2008, during a time of rising energy prices, and was most recently 4.5 percent in 2015, a reflection of the U.S. food industry’s energy-saving measures and lower energy prices. This feedback between the industries that make up the food system and energy markets highlights how the U.S. food system can drive economywide energy use and future energy prices.
This article is drawn from:
- Canning, P., Rehkamp, S., Waters, A. & Etemadnia, H. (2017). The Role of Fossil Fuels in the U.S. Food System and the American Diet. U.S. Department of Agriculture, Economic Research Service. ERR-224.