
International Food Security Assessment, 2017-2027
- by Birgit Meade and Karen Thome
- 6/30/2017
Highlights
- Given projections for low food prices and rising incomes, food security is expected to improve through 2027 for 76 low- and middle-income countries covered by ERS’s <em>International Food Security Assessment, 2017-2027</em> (IFSA). The share of the population in the 76 countries that is food insecure, defined here as not having access to at least 2,100 calories per day, is projected to fall from 17.7 percent in 2017 to 8.9 percent in 2027, with the number of food insecure people declining from just below 650 million to about 370 million.
- Gross Domestic Product (GDP) in developing Asian countries is projected to grow 6.3 percent per year—much faster than the global average of 3.8 percent—and the share of Asia’s population that is food insecure is projected to decline the most of all the regions studied, from 13.5 percent in 2017 to 4.6 percent in 2027. The food security challenge is greater in Sub-Saharan Africa (SSA), where population growth is higher and income growth slower. In 2017, 31.7 percent of SSA’s population is projected to be food insecure, but will remain above 20 percent by 2027.
- Over time, diets in all regions have improved and diversified. Meat as well as fruits and vegetables make up a larger share of the diet in the IFSA countries, while the cereal share declined. Between 2000 and 2013, average calorie, protein, and fat consumption increased and all regions reached calorie and protein requirements, while average fat consumption shares fell slightly short of the 20 percent recommendation in SSA and Asia. Lower income populations continue to fall short of targets in all regions.
Food Security Expected To Improve, but Regional Differences Persist
ERS’s International Food Security Assessment, 2017-2027 (IFSA) analyzes food security conditions in 76 low- and middle-income countries, all of which are historic or current food aid recipients. In 2017, 17.7 percent of the IFSA population is estimated to be food insecure. This means that about 646 million people out of a population of 3.5 billion in those countries consume less than a daily caloric target of 2,100 calories. For these 76 countries, projected income growth and sustained low food prices are expected to produce a decline in the share of people who are food insecure, which is projected to drop to 8.9 percent by 2027, and the number of food-insecure people to 372 million.
The IFSA uses a demand-oriented framework to estimate food insecurity at a national level. The model projects per capita food consumption based on prices and income levels and evaluates it against a daily caloric target of 2,100 calories per person per day, a level necessary to sustain life at a moderate level of activity, and the level at which people are considered food secure. Disparity in food access at the sub-national, community, and even household level is well documented, but exceeds the scope of this analysis. The model is also used to determine the shortfall or ‘food gap’ between food consumption of food-insecure people and the target level. Given projections for ongoing low food prices and rising incomes over the medium term, food demand is projected to increase and as a result, food security is expected to improve through 2027. While access to sufficient calories is only one aspect of food security, leaving questions concerning proper utilization and stability of food supplies unanswered, food access indicators can inform decision makers about shortfalls and progress in the context of international comparisons.
Although projected income growth is positive, it is below last year’s more optimistic outlook. International food prices are projected to remain stable. However, international food price declines do not always translate into domestic price drops, as is the case in several countries in Sub-Saharan Africa (SSA) with weak currencies or disruptions along the food supply chain. Slower growth projections for some countries, as well as some domestic food price increases, lead to a less optimistic food security assessment for 2027 than was projected a year ago.
The food gap, the amount of food needed to allow all food-insecure people to reach the caloric target, is an indicator of the intensity of food insecurity. It can be expressed as a per capita daily shortfall (measured in calories) or aggregated on an annual or national basis (expressed in grain equivalent quantities). Food insecurity is projected to become less intense over the coming decade, reflected by a decline in the food gap in all regions and in most countries, from a total of 28.5 million metric tons of food in grain equivalent in 2017 to 17 million metric tons in 2027.
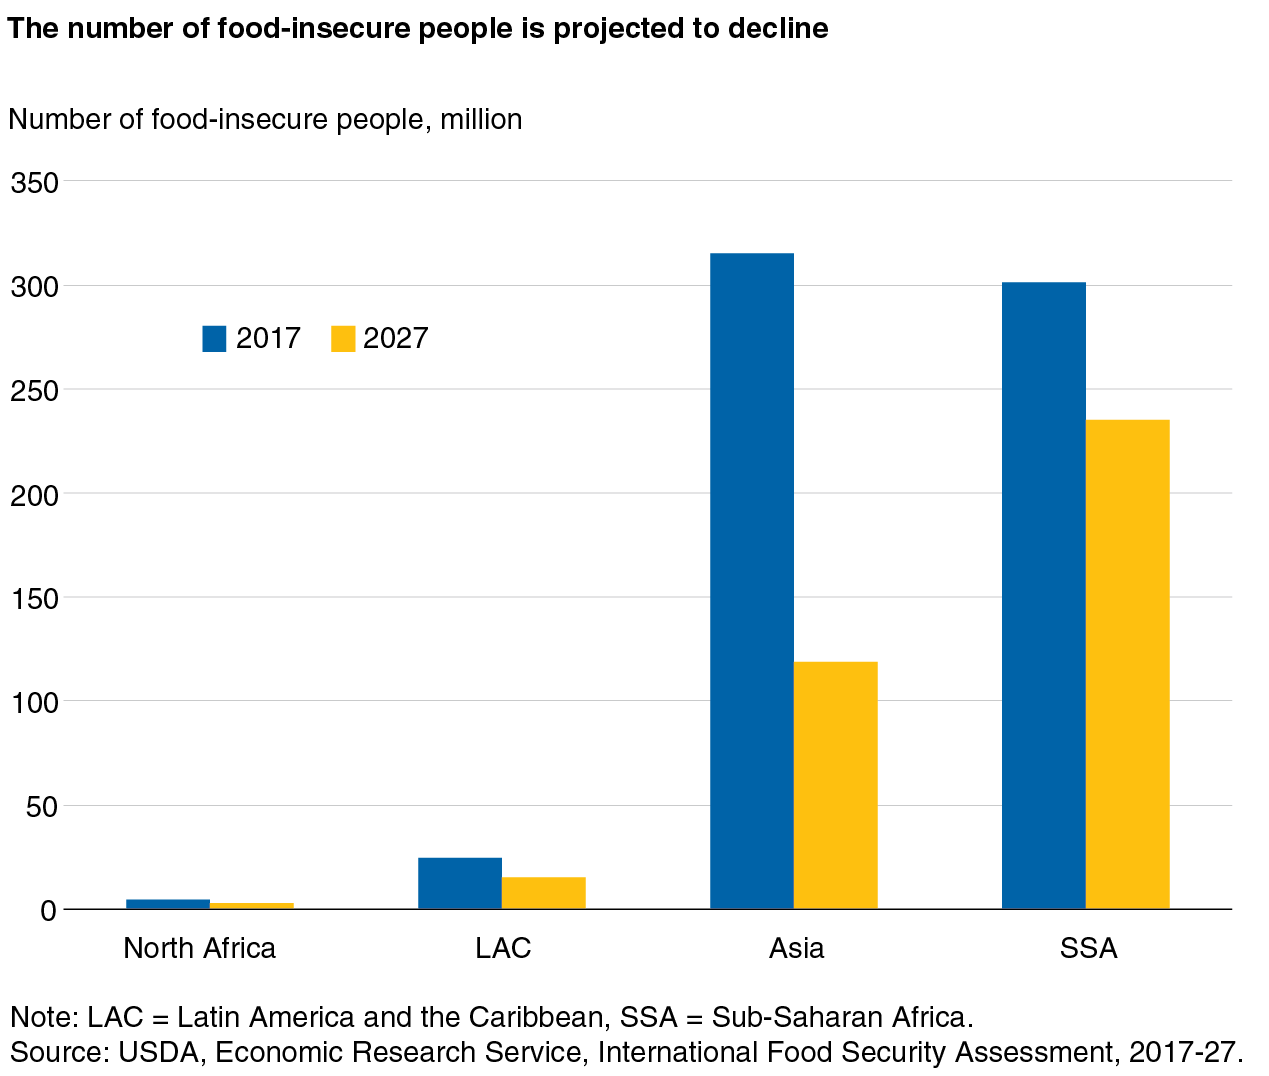
Food security indicators differ greatly by region. SSA has the highest share of food-insecure people, with 31.7 percent of the population food insecure in 2017, a total of 301 million people. There is considerable variation among the 39 countries in the SSA region. In nine countries, more than half of the population is food insecure, including Burundi, Central African Republic, Democratic Republic of Congo, Eritrea, and Liberia; all countries that still suffer or have suffered civil war and its devastating effects on agriculture and people’s livelihoods. They are among the poorest countries in the IFSA analysis. On the other hand, several countries in SSA, mainly in West Africa, have less than 10 percent food insecurity.
The Asia region has the largest number of food-insecure people in 2017, with 315.2 million individuals who are food insecure. However, the share of the population that is undernourished is 13.5 percent, below the 76-country share of 17.7 percent. In the few Asian countries that have not experienced rapid GDP growth in the last decade, the share of the population that is malnourished is much larger. Examples include Afghanistan (39 percent) and Yemen (84 percent), both countries suffered years of armed conflict, and the Democratic People’s Republic of Korea (North Korea) (54 percent).
The food security situation in the 11 countries in the Latin America and the Caribbean (LAC) region included among the set of 76 countries is projected to continue the trend of strong improvements seen over the past two decades. The share of the population that is food insecure is projected to drop from 14.8 percent in 2017 to 8.3 percent by 2027, reducing the number of food-insecure people from 24.7 to 15.4 million. Haiti, after suffering several devastating natural disasters, continues to be the Western Hemisphere’s most food-insecure country, with almost half of the country’s population projected to be food insecure in 2017. Improvements in Haiti’s food security situation are expected, and by 2027, this share drops to less than one third.
The North Africa region is the most food secure among the four regions analyzed. Just 2.5 percent of the region’s population in 2017 is estimated to be food insecure. Like all regions, North Africa is projected to make further improvements in the coming decade, and the region is on track to decrease its food insecurity to 1.3 percent by 2027.
Improvements in Food Security Are Mostly Driven by Rising Incomes
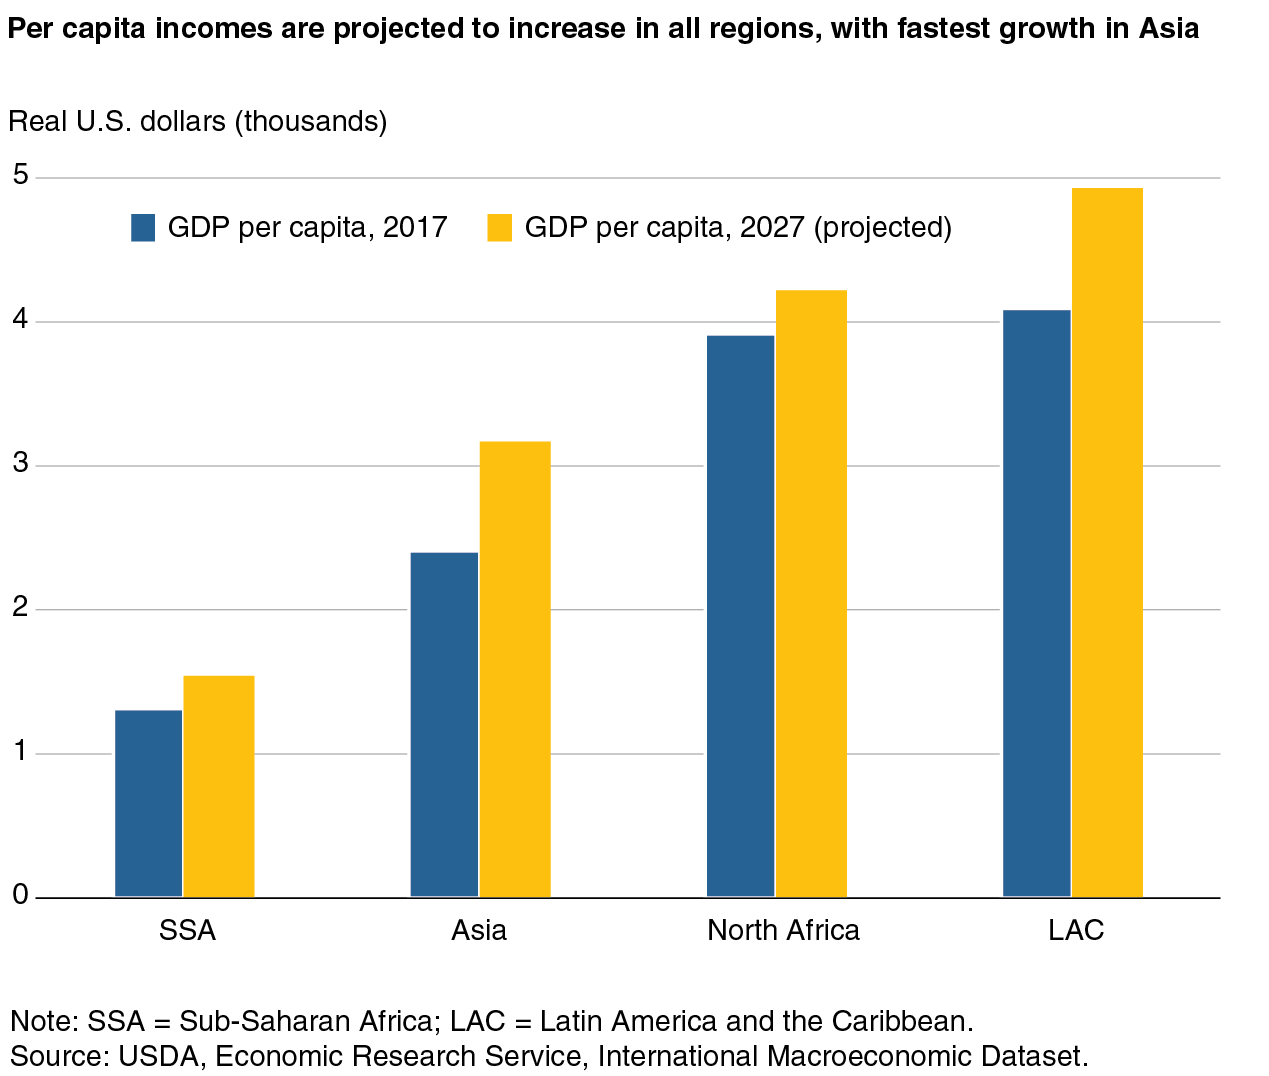
Incomes are projected to increase in almost all of the 76 countries studied; per capita incomes (in local currency) are expected to fall in a handful of countries in SSA, where nonrenewable exports are important. Since the beginning of the 21st century, developing countries have experienced strong economic growth, outpacing the advanced economies and, as a group, contributing more than half of global output and consumption growth. While this growth is forecast to remain strong over the medium term, growth rates are below those projected about a year ago.
Among the 76 countries, average per capita incomes in real U.S. dollars differ considerably across regions, with a low of $1,313 in SSA and a high of $4,092 in LAC, compared to more than $50,000 in the United States. Furthermore, the regions differ in their growth prospects over the next 10 years. North Africa has relatively high per capita incomes, but the region is facing uncertainties due to budgetary problems and a greater risk of weather-induced grain production shortfalls. Above-average population growth and reduced oil income for Algeria and tourism income for Morocco, Tunisia, and Egypt contribute to lower income growth prospects. Income growth is expected to remain strong in Asia, where India is projected to continue to have growth rates in excess of 7 percent over the foreseeable future. International food prices differ for each country because they are converted into local currencies and therefore depend on the real exchange rate. The ongoing strengthening of the U.S. dollar has led to real exchange rate depreciations around the world. Three-fourths of the countries included in this study are projected to have depreciating currencies vis-à-vis the dollar, partially offsetting the gains achieved through higher incomes and falling food prices.
Rising incomes and stable food prices lead to increasing demand for both food grain and grain used as feed or for industrial processing. This higher demand will be met by domestic production and imports. Annual grain production for the 76 countries studied is projected to increase 5.9 percent between 2017 and 2027, with most of this growth coming from yield increases. The majority of the countries studied here are projected to have declining or stagnant grain planted area growth, as many countries are approaching the limit of area expansion.
Regions differ in their reliance on the international market for food supplies. Countries in LAC and the North Africa region depend on imports for more than 50 percent of their grain supplies, either because their domestic agricultural sectors cannot produce the quantity of grain demanded or because land and water resources are instead used in higher value export crops. Those export revenues may then be used to import food grains commercially. Historically, commercial import growth has outpaced production growth and this trend is expected to continue.
All Regions Are Diversifying Diets
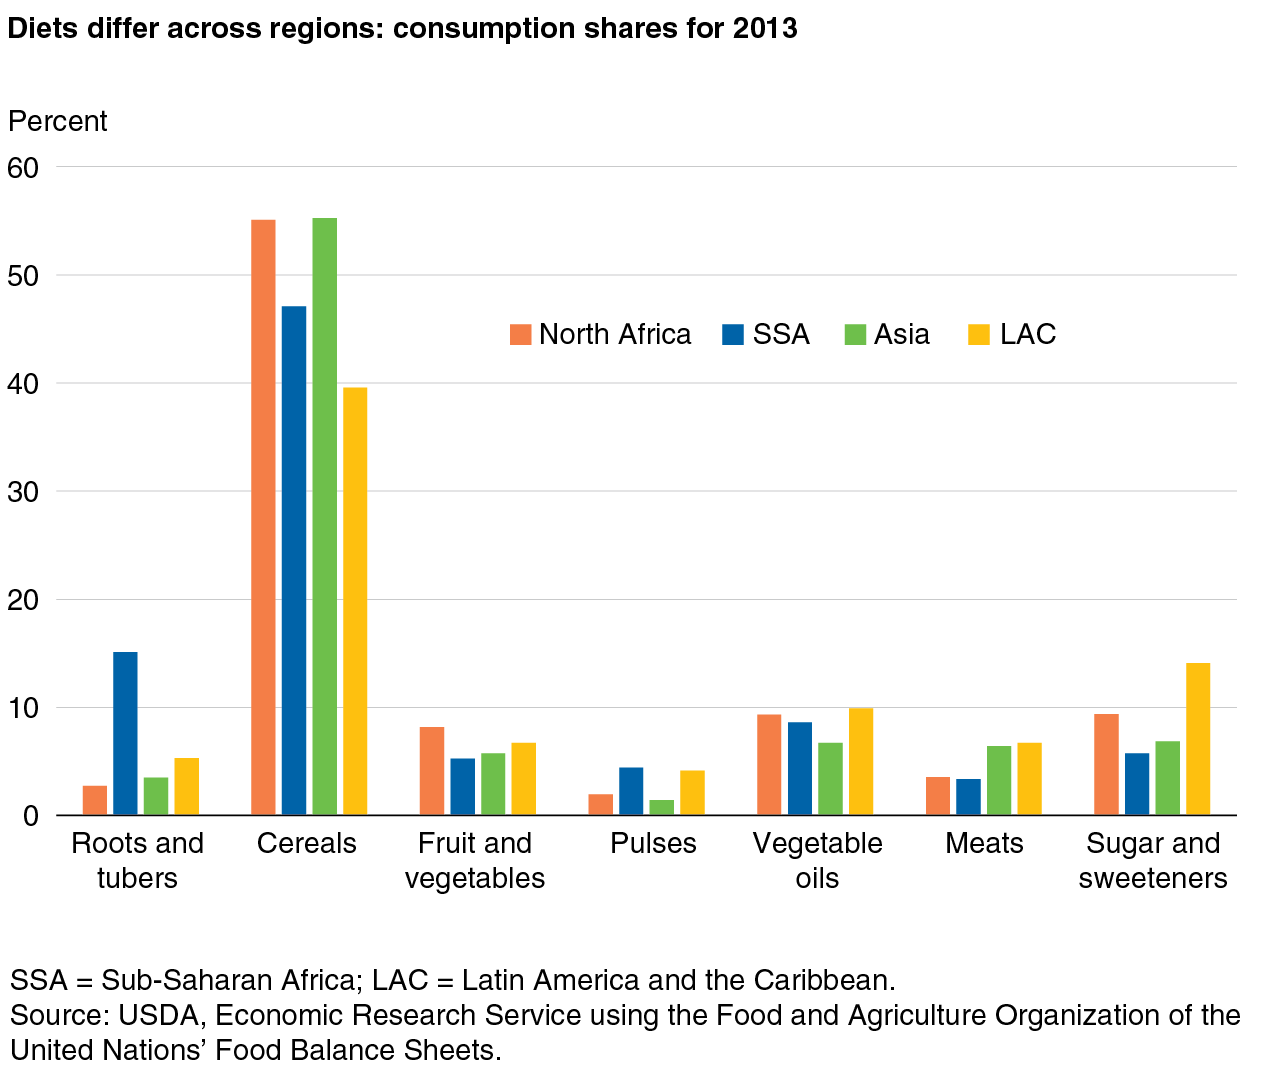
As incomes increase, consumers tend to diversify their diets and move away from staples like cereals and roots and tubers (e.g. potatoes and cassava) toward higher value foods such as meats, dairy, and high-value fruits and vegetables. Income and food price changes are the main drivers of food demand in the IFSA model, and given rising incomes and stable prices, average demand is projected to increase for all food groups.
Rising incomes over an extended period have contributed to a shift in diets across all regions. These shifts are incremental and slow, but the trend confirms a gradual convergence toward dietary patterns observed in middle- and high-income countries. Consumption of meats and of fruits and vegetables are increasing at the expense of cereals and roots and tubers. Vegetable oil is increasingly viewed as a necessity and consumption levels have remained relatively stable.
There are regional differences, however. LAC, with the highest average income among IFSA regions, has the lowest share of staple foods in its food intake and the highest shares in meat, vegetable oil, and sugar consumption. SSA, the poorest region, has the highest shares in staples and pulses and the lowest shares in higher value products such as meat and fruits and vegetables.
Another important dimension of food security is nutritional quality. Governments are now more aware of the necessity to address the wider burden of malnutrition, which comes in two forms: under and overnutrition (which is associated with obesity and non-communicable diseases). In the IFSA study the focus is on undernutrition defined here narrowly as consuming less than 2,100 calories per person per day. Insufficient dietary diversity and shortages of key nutrients are also important components of undernutrition, but beyond the scope of the ERS study.
One way of assessing improved nutritional quality is to observe trends in dietary diversification and macronutrient consumption, which are represented by carbohydrates, protein, and fat. A healthy diet aims to reach a minimum threshold of calories, 2,100 in this context, 10 percent of protein content, and a minimum of 20 percent fat. The main sources of protein (other than grains) are meat, dairy, and pulses. Fat consumed from vegetables mainly comes in the form of vegetable oil and oil crops, such as peanuts, or from meat and fat (butter) via animal products.
There are clear signs of dietary improvements in all regions over time. When studying annual food balance sheets, published by the Food and Agriculture Organization of the United Nations, upward trends in calorie and macronutrient consumption become apparent, illustrating the rate of improvement in nutritional quality across regions. Average per capita calorie availability continues to be the lowest in SSA, but the region experienced significant growth in caloric availability over the 13-year period. Asia, aggregated here without including the countries of the Commonwealth of Independent States (CIS), had the second-fastest growth in average per capita caloric availability, at 11 percent. Caloric increases slowed with higher starting levels, leaving North Africa to grow at the slowest rate, 8 percent, with an absolute increase in calories slightly below that seen in SSA. North Africa added 260 calories per capita, which brought caloric availability close to levels seen in high-income countries. While there was a protein and fat intake share shortfall in Asia and SSA in 2000, all dietary macronutrient markers were reached by 2013, except for a slight shortfall in fat consumption share in SSA and Asia.
| Country | Consumption: energy kcal1 |
Consumption: protein grams1 |
Consumption: fat grams1 |
Ratio to requirement: 2100 kcal energy |
Ratio to requirement: 10 percent protein2 |
Ratio to requirement: 20 percent fat3 |
|---|---|---|---|---|---|---|
| 2000 | ||||||
| 76 country average | 2,210 | 55 | 46 | 1.05 | 1 | 0.93 |
| Sub-Saharan Africa | 2,137 | 52 | 41 | 1.02 | 0.97 | 0.86 |
| Asia4 | 2,251 | 54 | 43 | 1.07 | 0.96 | 0.86 |
| Latin America and Caribbean | 2,316 | 58 | 60 | 1.1 | 1 | 1.16 |
| North Africa | 3,133 | 86 | 69 | 1.49 | 1.1 | 0.99 |
| 2013 | ||||||
| 76 country average | 2,532 | 67 | 58 | 1.21 | 1.05 | 1.03 |
| Sub-Saharan Africa | 2,404 | 61 | 52 | 1.11 | 1.01 | 0.98 |
| Asia4 | 2,493 | 65 | 53 | 1.19 | 1.04 | 0.96 |
| Latin America and Caribbean | 2,530 | 65 | 68 | 1.23 | 1.01 | 1.21 |
| North Africa | 3,393 | 98 | 75 | 1.62 | 1.15 | 1 |
| 1Calculated based on Food and Agriculture Organization of the United Nations' food balance sheet. 2Based on U.S. Food and Drug Administration, recommended threshold target 10 percent of diet. 3Based on American Heart Association, recommended threshold target 20 percent of diet. 4Commonwealth of Independent States (CIS) countries are excluded from Asia category. Source: USDA, Economic Research Service using the Food and Agriculture Organization of the United Nations' food balance sheets. |
||||||
Nutritional Improvements Vary by Income
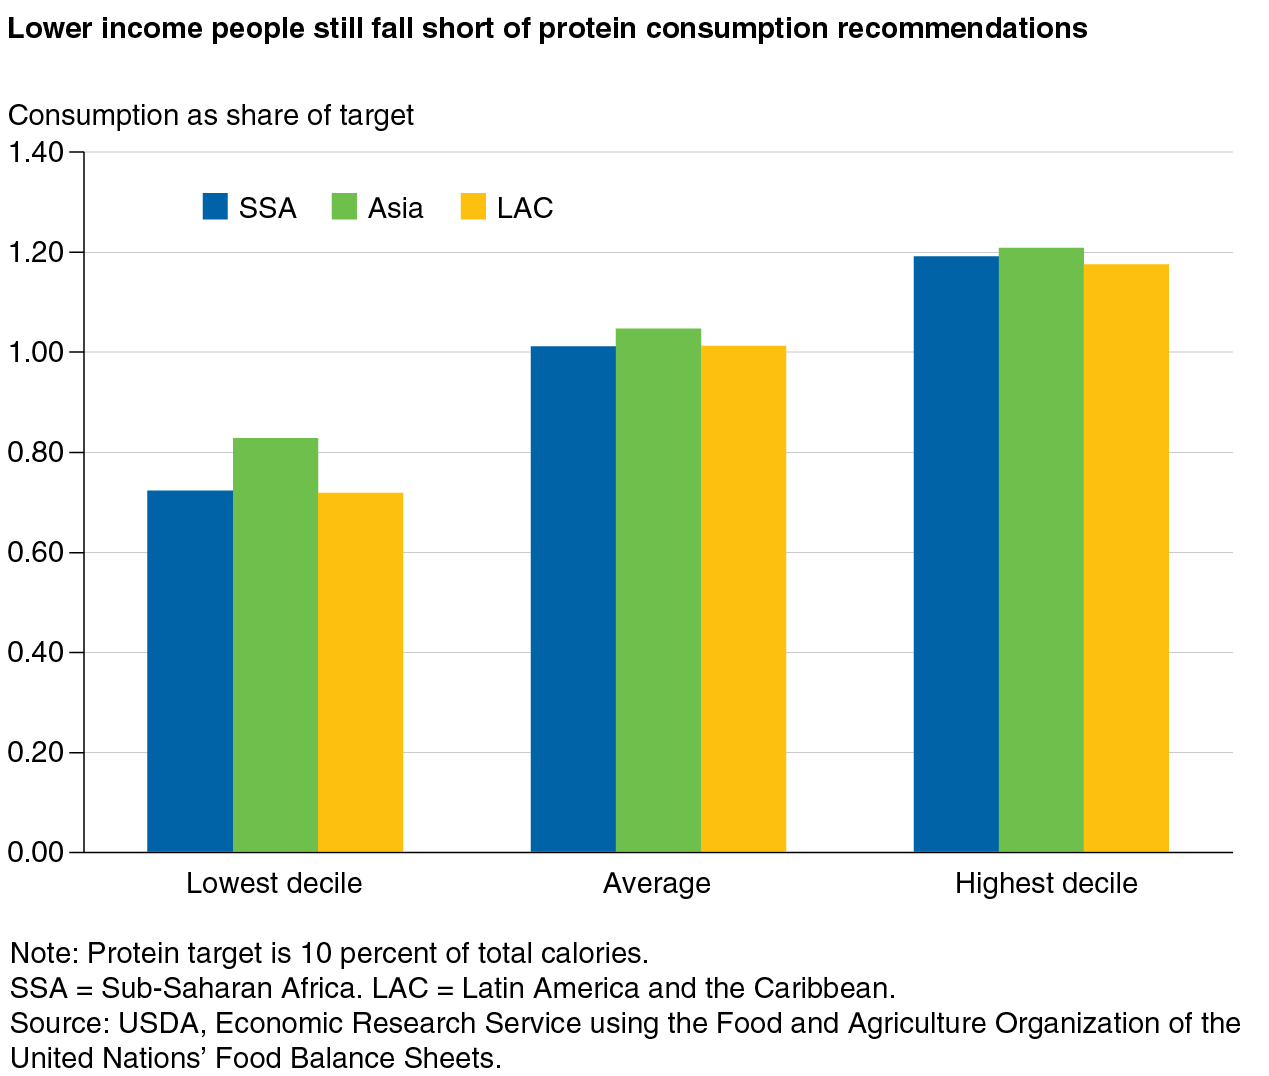
Improvements in average diets are welcome developments, but lower income households continue to fall short of nutritional targets. A closer look at consumption of protein, fat, and fruits and vegetables for the three most food-insecure regions—SSA, LAC, and Asia (minus the CIS countries)—reveals insufficient access for the lowest income groups in all regions.
The disparity between low-income versus high-income intake levels within each region is particularly pronounced in the case of proteins. Here, average consumption in all three regions studied is close to the recommended level of 10 percent of total diets, with SSA’s consumption falling slightly below the threshold. While the highest income decile has a protein share 20 percent above the target, the lowest income consumers are 20-30 percent below, with the lowest level in LAC, followed by SSA. This example illustrates that food security is not only linked to a country’s average income levels, but also, importantly, to how this income is distributed within the country. While average incomes in LAC are higher than in SSA and Asia, income distribution is more unequal, leaving the lowest income households more vulnerable to food insecurity.
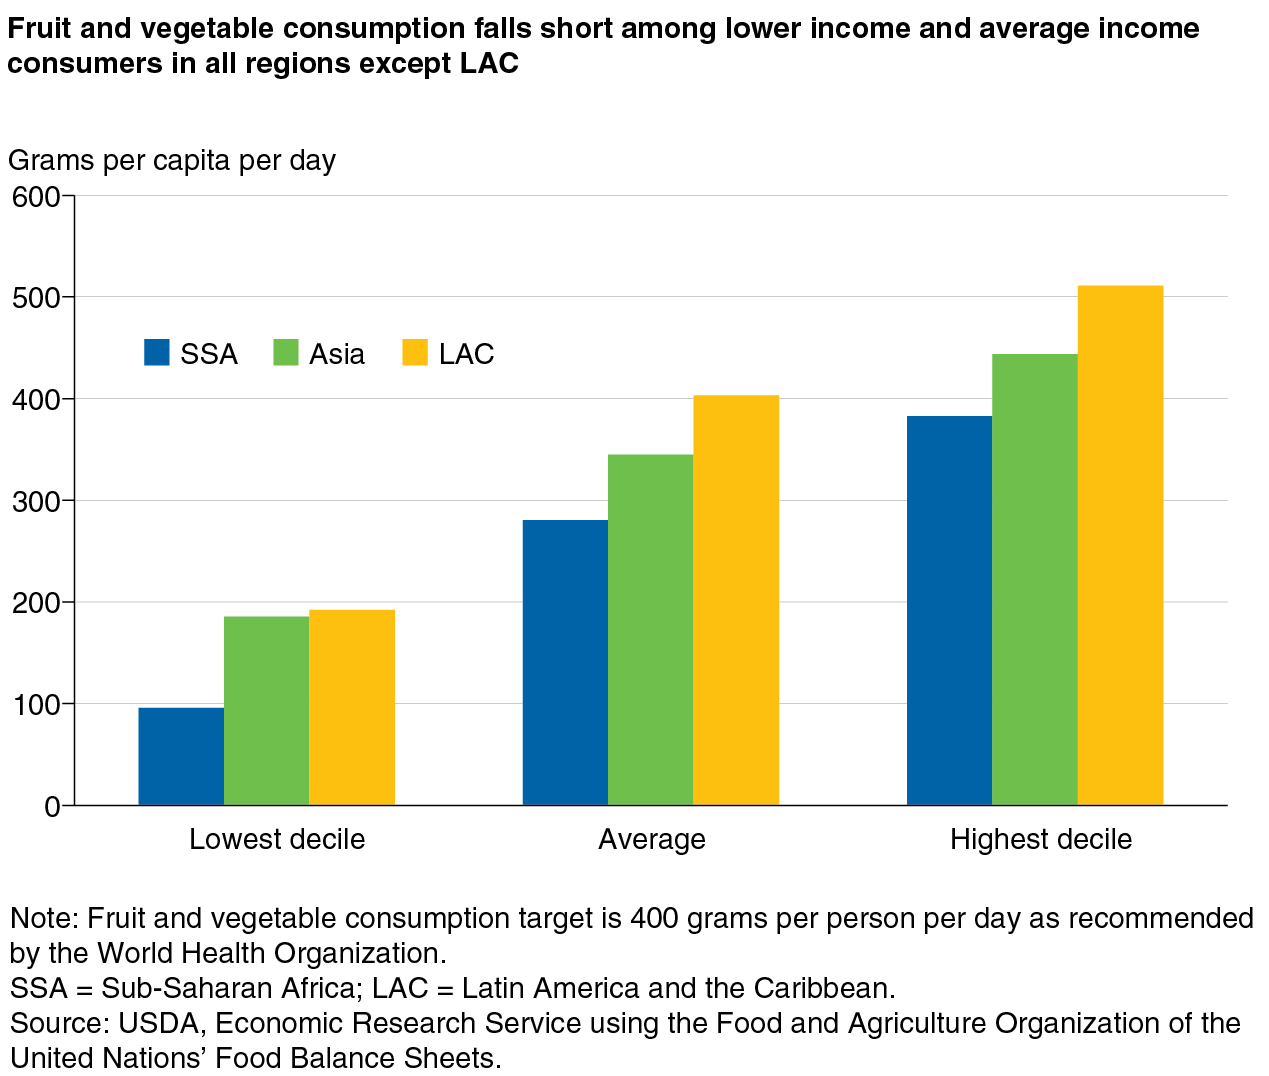
Lower income consumers also fall below target consumption levels for fat and fruits and vegetables. LAC has the highest intake levels of fruits and vegetables, being the only region with average consumption reaching the World Health Organization’s (WHO) recommendation of 400 grams per capita of fruit and vegetable consumption per day. SSA falls short of the threshold for all income groups, and in Asia, only the highest income consumers are currently exceeding the target.
This article is drawn from:
- Meade, B. & Thome, K. (2017). International Food Security Assessment, 2017-27. U.S. Department of Agriculture, Economic Research Service. GFA-28.