
U.S. Diets Still Out of Balance With Dietary Recommendations
- by Jeanine Bentley
- 7/3/2017
By monitoring and examining food consumption trends, public health professionals and others can assess the dietary health of Americans and identify the direction eating patterns are headed. A comparison of ERS’s loss-adjusted food availability data to recommendations in the 2015-2020 Dietary Guidelines for Americans reveals that while the American diet has improved in some ways, many people still fall short of targets for some food groups and over-indulge in others. In 2014, Americans, on average, were above the Guidelines’ recommendations for added fats and oils, added sugar and sweeteners, protein foods, and grains, and below the recommendations for vegetables, dairy products, and fruit.
Consumption of Fruit, Vegetables, and Dairy Products Below Recommended Amounts
The Guidelines’ recommendations are expressed in cup- or ounce-equivalents. Since people consume foods in various forms (canned, dried, juice, etc.), foods are not equal in terms of what counts as a cup- or an ounce-equivalent. Some foods are more concentrated and others contain more water. For example, a cup of cooked spinach and 2 cups of fresh spinach both equal a 1 cup-equivalent of vegetables.
A recent ERS report converted loss-adjusted food availability data from 1970 to 2014 to daily cup equivalents (informally, servings) to see how average U.S. consumption has changed over the last four decades and how it compares with the Guidelines’ recommendations. The report updates a 2008 ERS report that looked at dietary trends over 1970 to 2005. Loss-adjusted data are derived from the supply of food available for consumption and adjusted for inedible peels and pits and for spoilage, plate waste, and other losses to more closely approximate actual intake, or consumption.
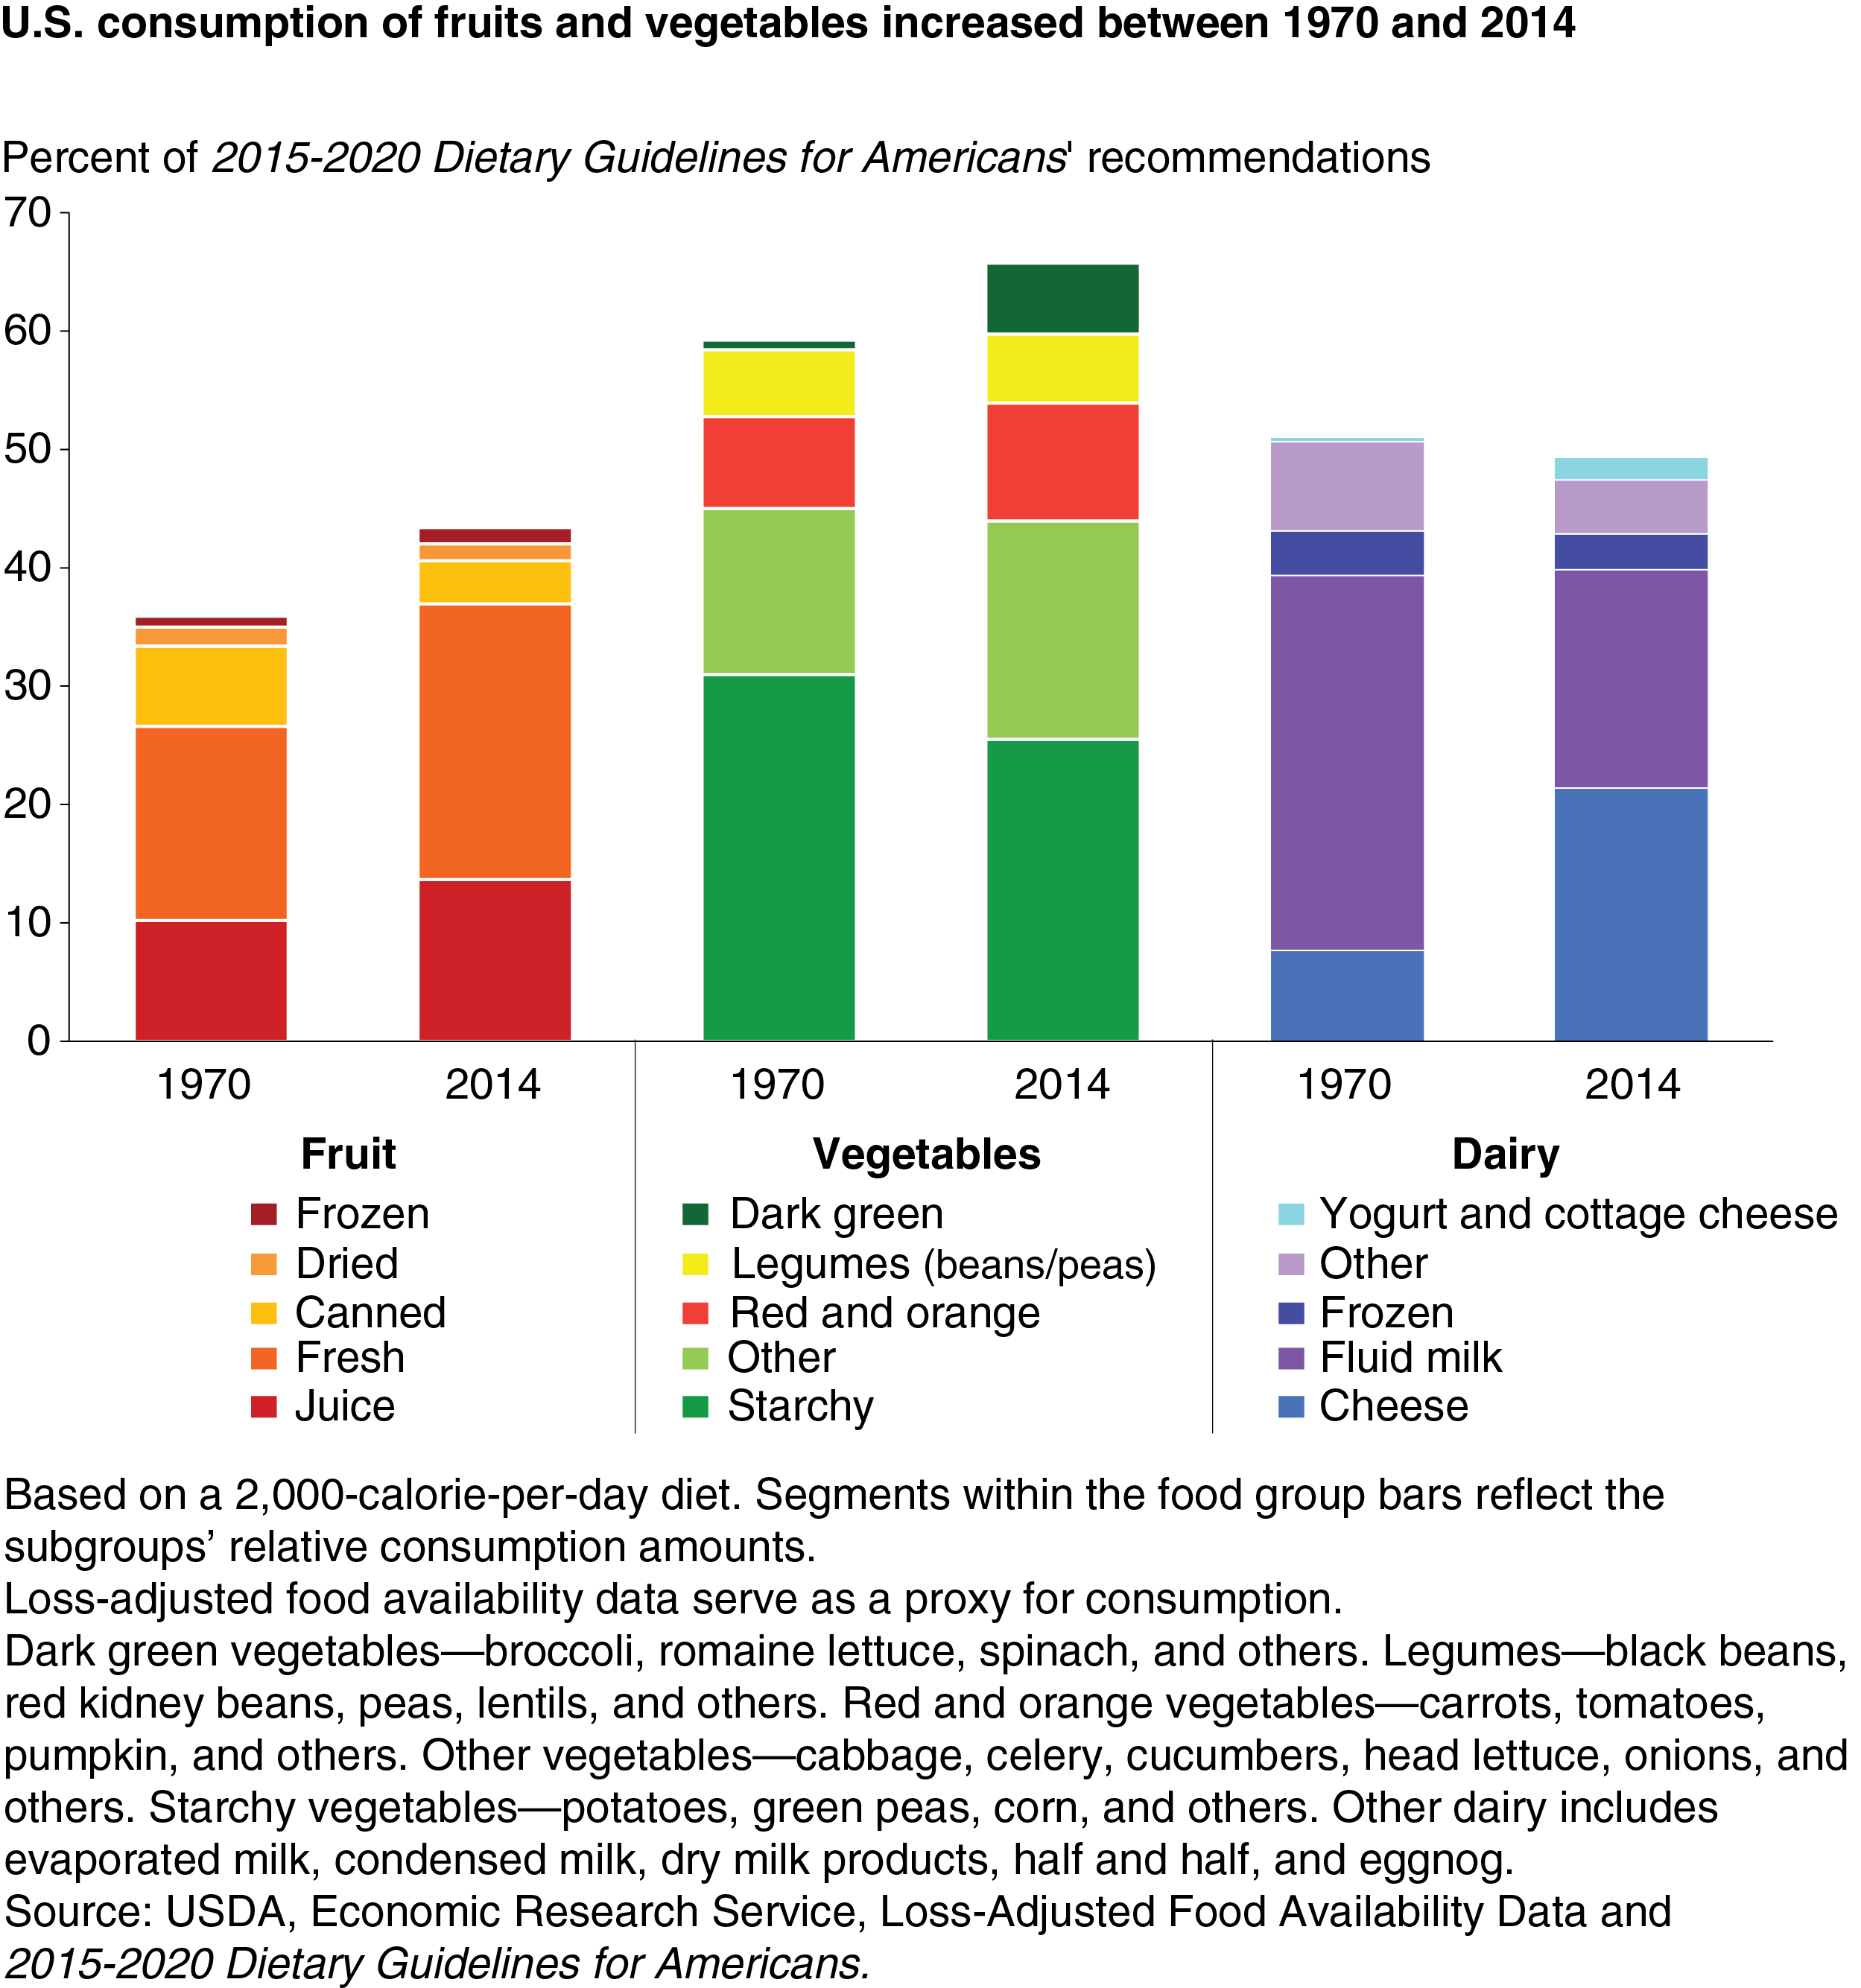
Fruit. The Guidelines recommend that people requiring 2,000 calories per day consume 2 cup- equivalents of fruit—at least half of which should be in the form of whole fruit, as opposed to juice. According to the loss-adjusted food availability data, the average American consumed 0.87 cup-equivalents of fruit per day in 2014, up from 0.72 cup-equivalents in 1970. Daily whole fruit consumption—frozen, canned, fresh, and dried—increased by 15 percent from 0.52 cup-equivalents per person in 1970 to 0.60 cup-equivalents in 2014. Fresh fruit contributed to the bulk of the fruit consumption increase. U.S. fruit juice consumption grew by 35 percent from 1970 to 0.27 cup-equivalents in 2014. This increase in fruit juice consumption came from noncitrus juices such as apple juice and grape juice.
Vegetables. Americans consumed 1.64 cup-equivalents per person in 2014—66 percent of the recommended 2.5 cup-equivalents of daily vegetables and legumes. The Guidelines recommend that Americans consume a variety of vegetables from five vegetable subgroups (dark green, red and orange, legumes, starchy, and other). Between 1970 and 2014, per person consumption grew for all subgroups, except starchy vegetables. The largest increase was for dark green vegetables. Dark-green vegetable consumption climbed from 0.02 cup-equivalents per person per day to 0.15 cup-equivalents during this period, with romaine and leaf lettuce and fresh broccoli the largest contributors.
Dairy. In 2014, U.S. dairy consumption was 1.48 cup-equivalents per person per day (49 percent of the recommended 3 cup-equivalents), down from 1.53 cup-equivalents in 1970. The tumble in fluid milk consumption from 0.95 cup-equivalents per person per day in 1970 to 0.55 cup-equivalents in 2014 was not made up by growth in cheese and yogurt intake. Studies have found that Americans consume milk less frequently than in the past, opting to replace a glass of milk at a meal with soft drinks, iced teas, or other nondairy beverages. Consumption of frozen dairy products also fell between 1970 and 2014. Consumption of cheese, on the other hand, more than doubled, from 0.23 cup-equivalents per person per day in 1970 to 0.64 cup-equivalents in 2014. The biggest growth was in consumption of Italian cheeses (provolone, Romano, Parmesan, mozzarella, ricotta, and others), and yogurt’s popularity grew over the 44 years as well.
Consumption of Grain Products, Protein Foods, and Added Sugars and Fats Above Recommended Amounts
On a 2,000-calorie-per-day diet, the 2015-2020 Dietary Guidelines for Americans recommend that Americans consume 6 ounce-equivalents of grains (half should be whole grains), 5.5 ounce-equivalents of protein foods, and 27 grams of fats that have a high percentage of monounsaturated and polyunsaturated fats and are liquid at room temperature. The Guidelines also advise that less than 10 percent of calories should be added sugars and sweeteners and saturated fats.
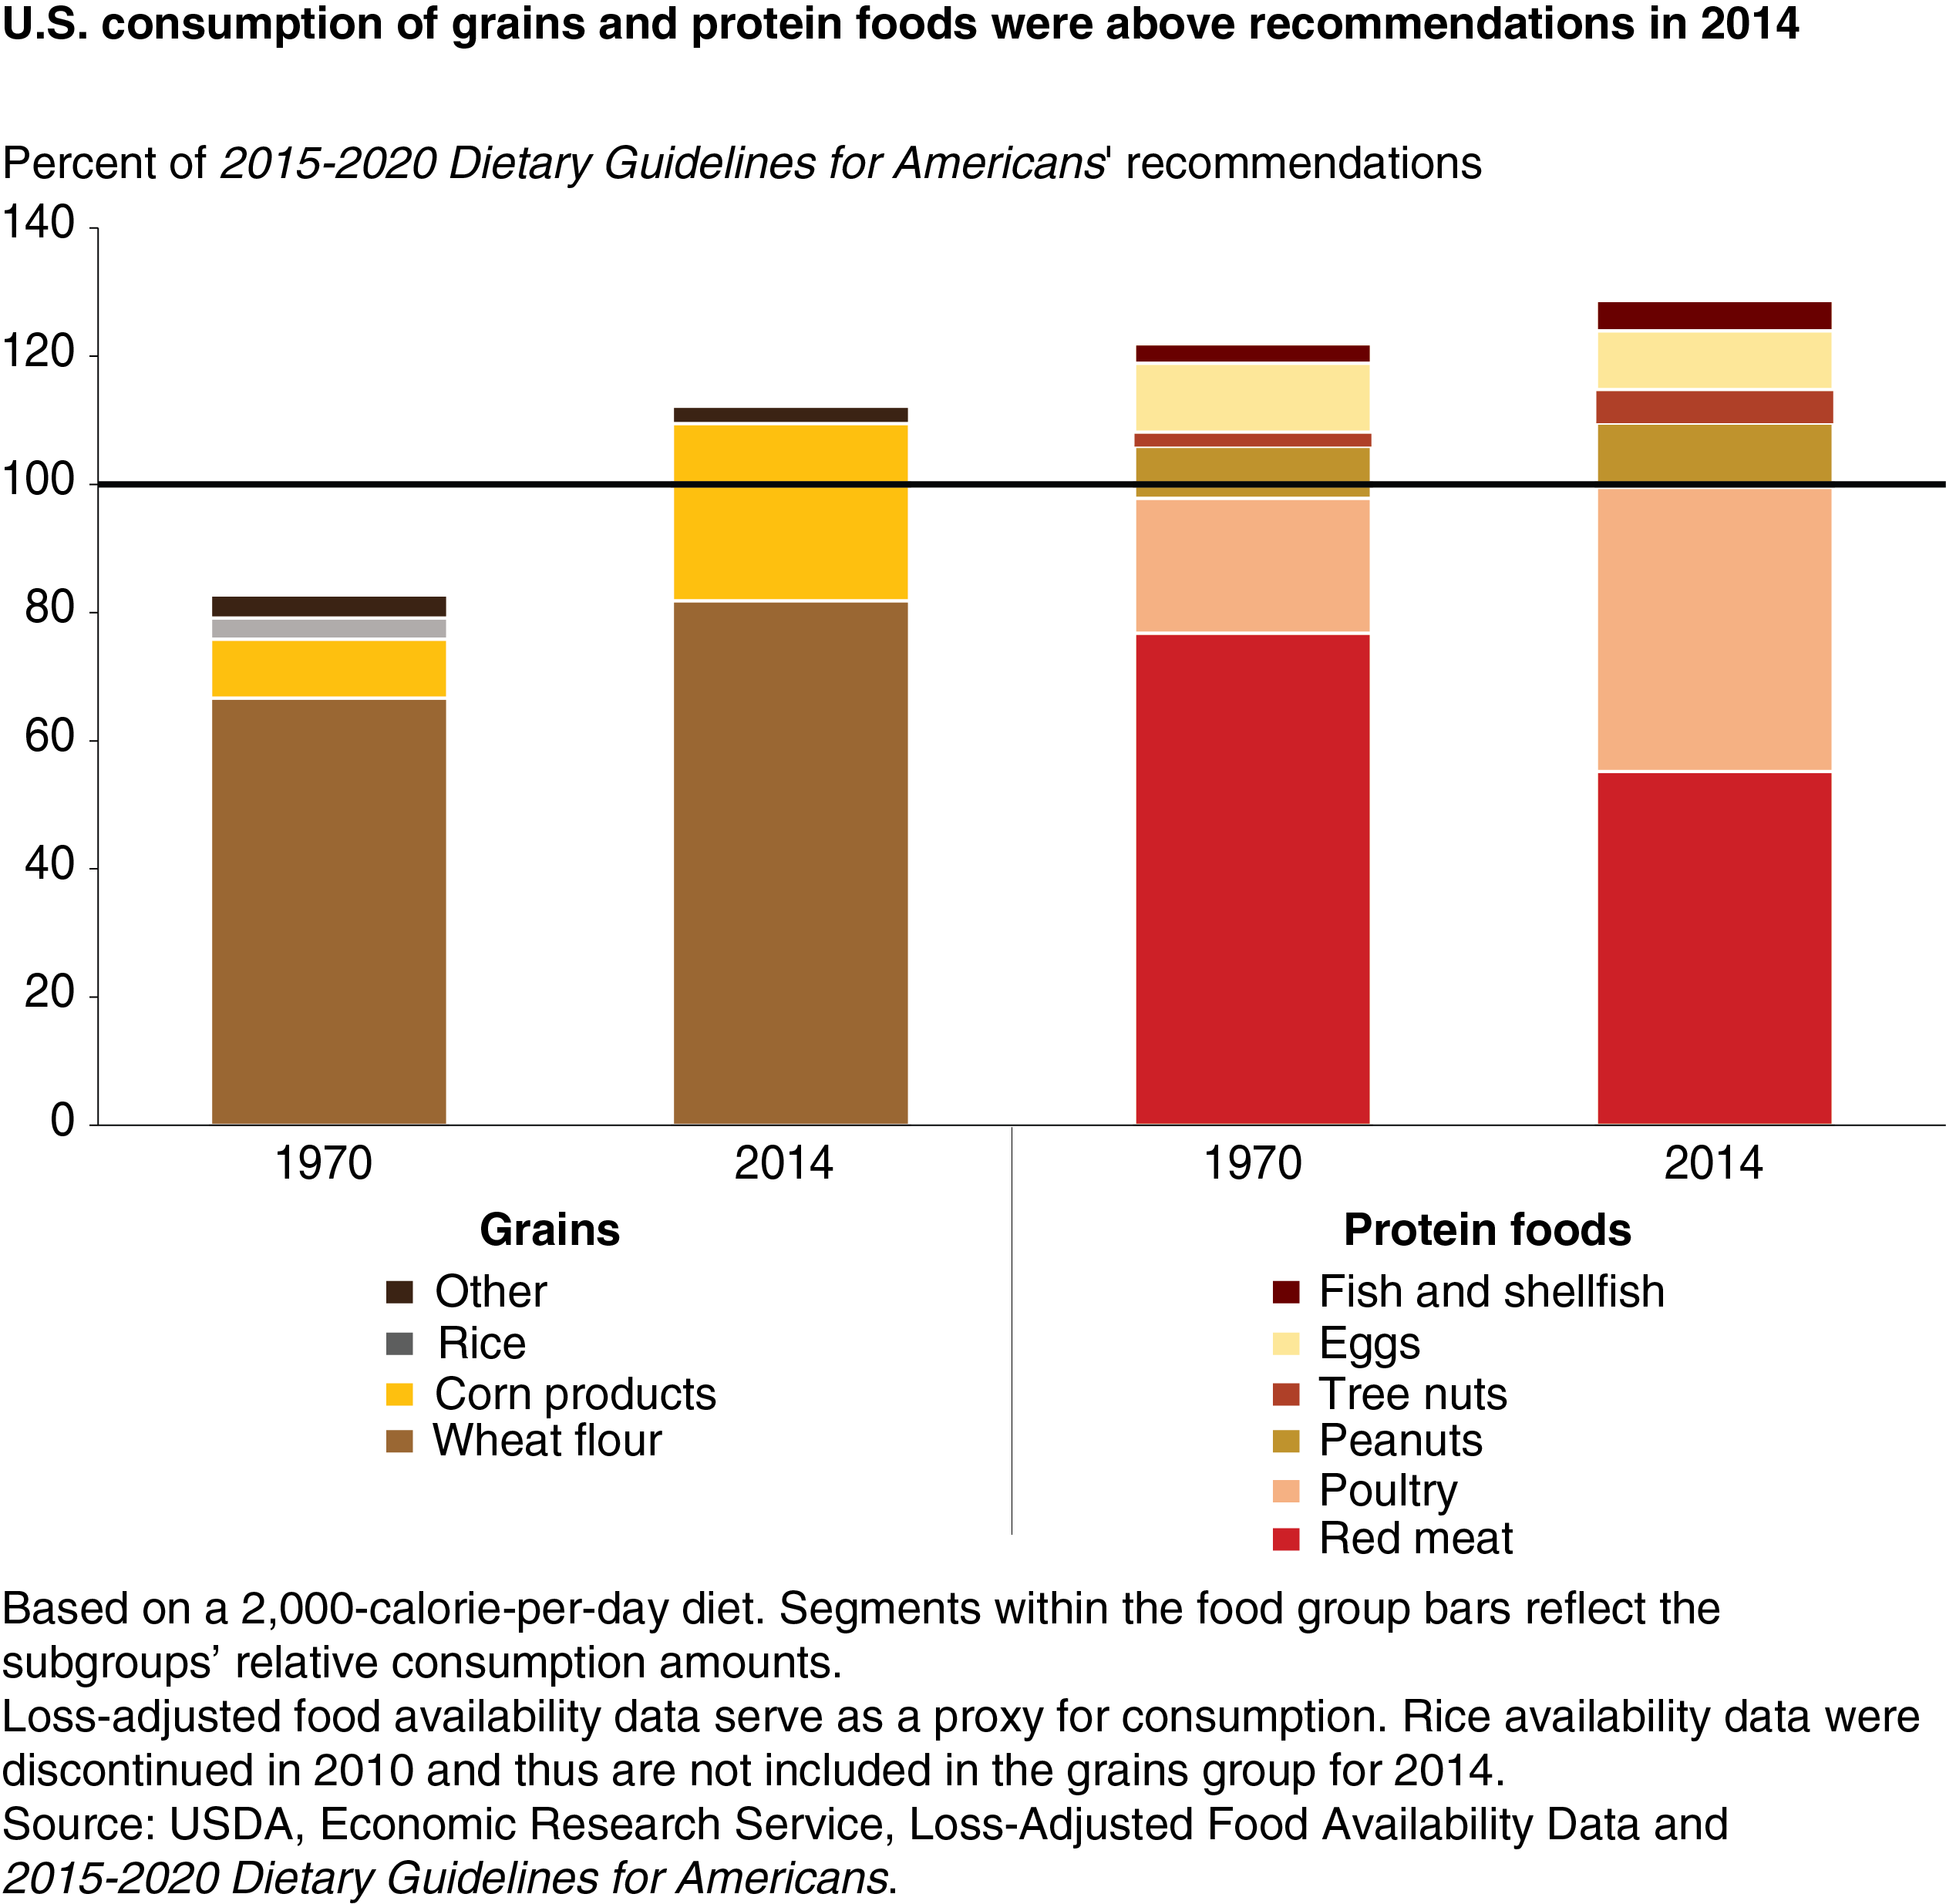
Grains. Consumption of wheat flour, rice, corn products, and other grains (rye flour, oat products, and barley products) rose 35 percent, from 5.0 ounce-equivalents per person per day in 1970 to 6.7 ounce-equivalents in 2014. While wheat flour consumption grew by 23 percent, consumption of corn products grew by 202 percent, reflecting the growing popularity of corn-based foods, such as tortillas and chips, and the use of cornstarch in processed foods. Consumption of other grains fell from 0.21 to 0.16 ounce-equivalents per person per day during this time.
Protein foods. In 2014, the average American consumed an estimated 7.1 ounce-equivalent of protein foods (not including seeds and soy products) per person per day compared to 6.7 ounce-equivalents in 1970. Red meat consumption declined by 29 percent to 3.0 ounce-equivalents per person per day in 2014. Daily egg consumption dipped from 0.59 to 0.50 ounce-equivalents per person. During 1970 to 2014, chicken consumption more than doubled to 2.1 ounce-equivalents per person per day and turkey consumption increased from 0.2 to 0.3 ounce-equivalents per person per day. Americans increased their daily consumption of tree nuts by 136 percent between 1970 and 2014, with almonds and pecans posting the biggest gains.
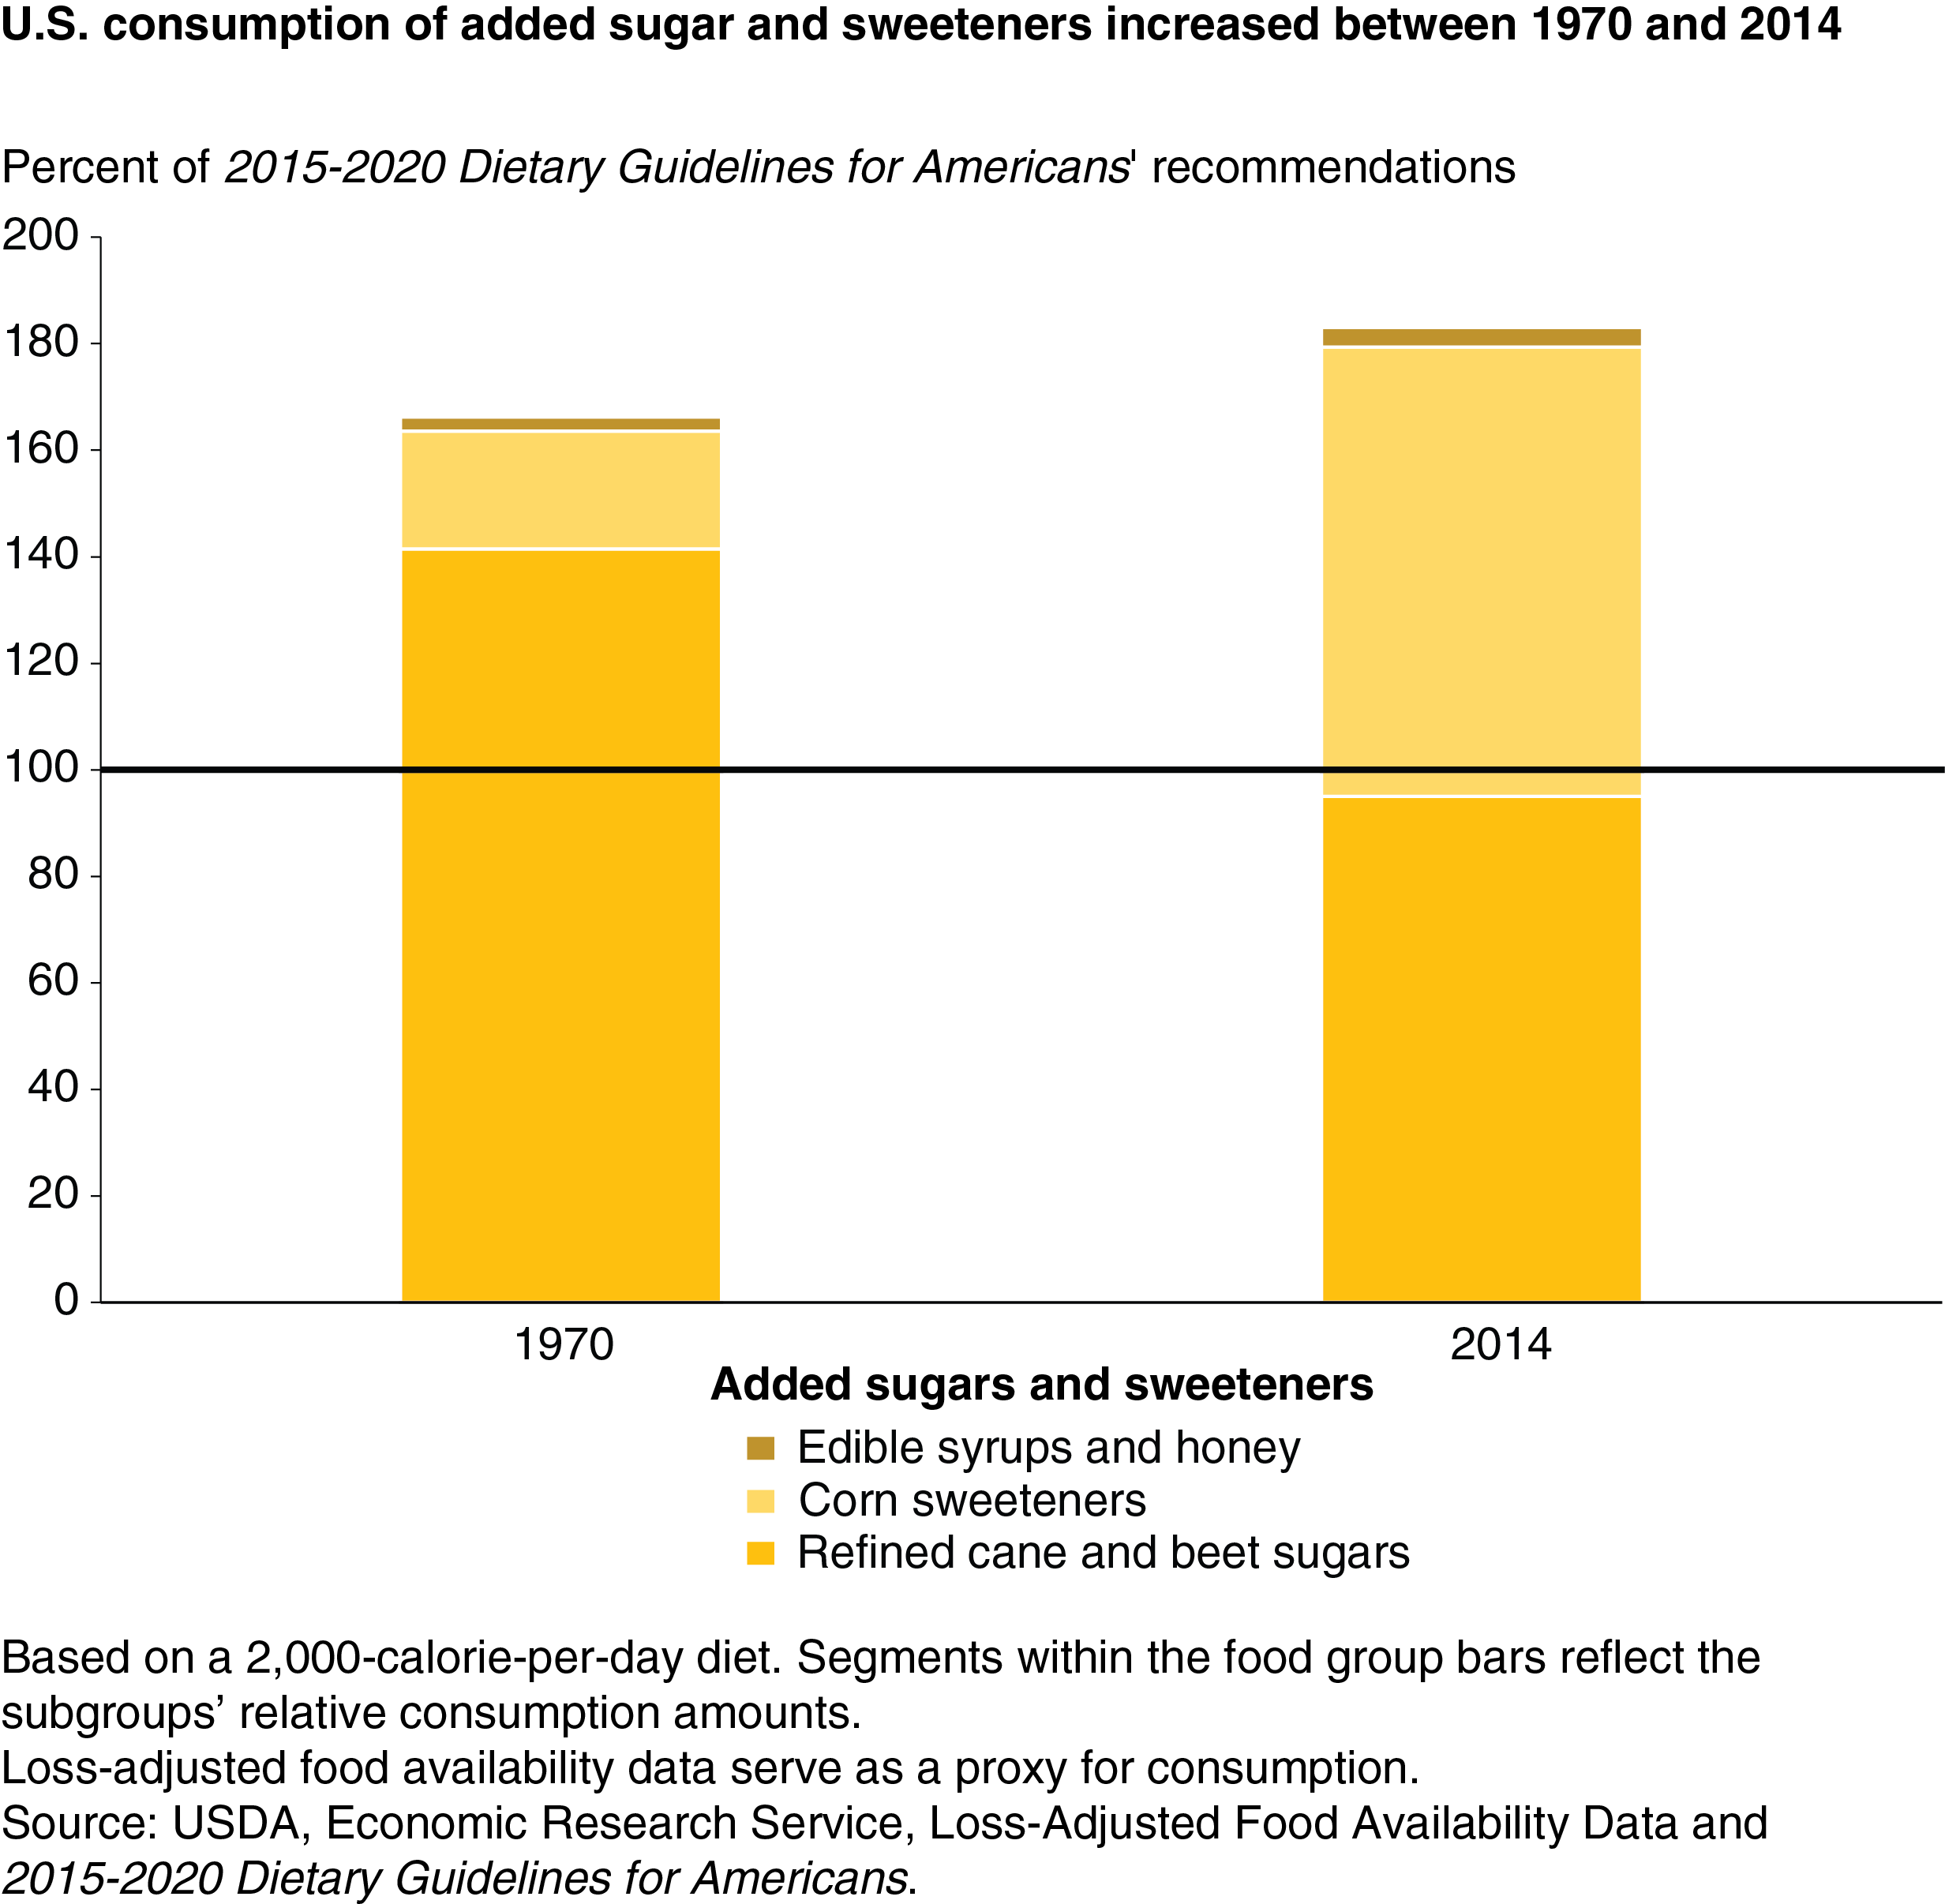
Added sugar and sweeteners. Daily consumption of added sugars and sweeteners—those added to foods and beverages during processing or by the consumer—totaled 22.9 teaspoons per person in 2014 compared with 20.8 teaspoons per person in 1970. The Guidelines suggest that calories from added sugars and sweeteners should not exceed 10 percent of daily calories (12.5 teaspoons for a 2,000-calorie-per-day diet). While refined cane sugar and beet sugar declined by 5.8 teaspoons per person per day, loss-adjusted availability of high-fructose corn syrup grew by 7.8 teaspoons between 1970 and 2014. Honey consumption also increased during this time.
Added fats and oils. U.S. consumption of added fats and oils reached 63.0 grams per person per day in 2010. (Data on added fats and oils, except butter, are not available beyond 2010.) In 2010, 15 grams of added fats and oils consumed per person per day were solid fats from butter, lard, shortening, and tallow. Another 44.7 grams were vegetable oils, also called salad and cooking oils.
This article is drawn from:
- Bentley, J. (2017). U.S. Trends in Food Availability and a Dietary Assessment of Loss-Adjusted Food Availability, 1970-2014. U.S. Department of Agriculture, Economic Research Service. EIB-166.
You may also like:
- Food Availability (Per Capita) Data System. (n.d.). U.S. Department of Agriculture, Economic Research Service.