
Conservation Compliance in the Crop Insurance Era
- by Roger Claassen and Maria Bowman
- 7/27/2017
Highlights
- Conservation Compliance, which links eligibility for farm program benefits to soil and wetland conservation, has significantly reduced soil erosion on highly erodible cropland.
- The 2014 Farm Act eliminated some benefits subject to Compliance under the 2008 Act (e.g., Direct Payments) but also linked some benefits that were not subject to Compliance (e.g., crop insurance premium subsidies); in aggregate, the magnitude of these incentives is similar to those under the 2008 Farm Act.
- Crop insurance premium subsidies are an important part of the financial incentives to implement conservation efforts under the 2014 Farm Act; incentives would be significantly lower on many farms if crop insurance premium subsidies were not subject to Compliance sanction.
Since the 1930s, the Federal Government has set policies that support farm incomes in the event of low crop prices or crop failure. These policies also encourage farmers to conserve soil and, in more recent years, enhance environmental resources like water and air quality. By the 1980s, however, policymakers realized that farm support and conservation programs could work against each other. While conservation programs supported farmers in reducing soil erosion, for example, price and income support programs encouraged them to expand crop production onto environmentally sensitive lands, including erosion-prone land and wetlands. By linking farm program benefits to conservation, policymakers sought to limit these unintended consequences.
Conservation Compliance, first enacted as part of the 1985 Food Security Act, makes soil and wetland conservation a condition of eligibility for most Federal farm programs. Under Highly Erodible Land Conservation (HELC), farmers who grow crops on highly erodible land must apply an approved conservation system—one or more practices that work together to reduce soil erosion. Under Wetland Conservation (WC), farmers must refrain from draining wetland for crop production.
Compliance can encourage soil and wetland conservation on farms where the Compliance incentive exceeds the cost of meeting Compliance requirements. The Compliance incentive is based on Federal farm program benefits. Farmers who violate HELC or WC could become ineligible for many Federal agricultural programs, including commodity (income support) programs, crop disaster assistance, voluntary conservation payment programs and—under the Agricultural Act of 2014—crop insurance premium subsidies. Because the farmer becomes ineligible, benefits could be lost throughout the farm, not just on land where the violation occurred. The cost of Compliance requirements includes the cost of applying conservation systems on cropland in highly erodible fields and income foregone on wetland that could have been profitably farmed after draining except for Wetland Compliance.
While Conservation Compliance can protect and improve environmental quality by using farm program benefits to incentivize the adoption of environmentally sound practices, a critical question is whether these programs do protect these resources. In other words, have these programs had a measurable effect on soil erosion or wetland conservation on U.S. farms? Are incentives large enough to sustain these gains over time? And how have changes in the Agricultural Act of 2014 affected compliance incentives?
HELC and Soil Erosion
The implementation of HELC (1985-1995) coincided with a 38-percent decline in soil erosion on U.S. cropland. Between 1982 and 1997, cropland erosion dropped from 2.93 to 1.83 billion tons per year. While the timing of erosion reduction suggests that HELC played an important role, farmers also respond to a wide range of market and policy incentives (including the adoption of new technology) in selecting crops and production practices—decisions that also have a large effect on soil erosion.
Previous ERS research showed that roughly 25 percent of erosion reduction during 1982-1997 occurred on highly erodible cropland that was cropped continuously. The balance of erosion reduction occurred on land that is not highly erodible (and therefore not subject to HELC), or resulted from an overall decline in the amount of land used for crop production.
Because of the broad reductions in soil erosion, particularly on land that is not subject to HELC, researchers have doubts about the role of HELC in leveraging soil conservation gains. Broad-based soil erosion reduction may suggest that the timing of erosion reduction relative to HELC was largely coincidental. That is, soil erosion reductions might have happened even without the Compliance requirement.
To test this theory, ERS researchers used a statistical model to compare soil erosion on cropland in fields subject to HELC (known as HEL fields) to similar cropland not in HEL fields. HEL fields include land with at least a third (or 50 acres) of highly erodible soil. ERS researchers estimated that, in 2012, 92 million acres of cultivated cropland were located in an HEL field but only 60 million of these acres actually satisfied the definition of highly erodible land. Roughly 22 million acres of highly erodible cropland were not located in HEL fields. Researchers compared erosion reduction on highly erodible cropland in an HEL field to similar cropland that is also highly erodible but is not located in an HEL field. In addition to HEL status, measures of “similarity” included soil quality, topography, inherent erodibility, and eligibility for commodity programs.
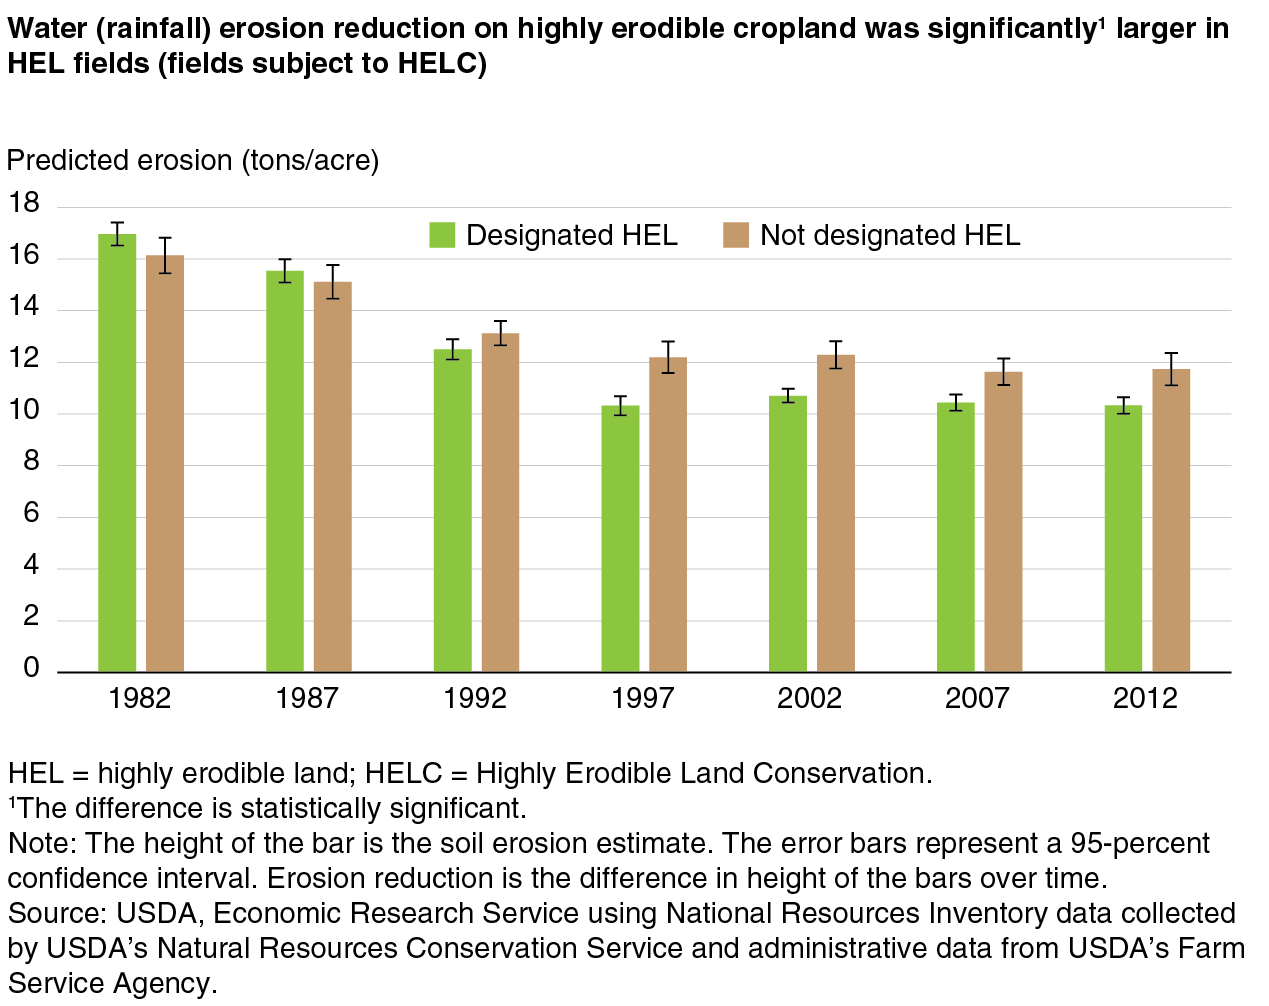
On cropland that was highly erodible for water (rainfall) erosion, ERS researchers estimate that the average soil erosion reduction between 1982 and 1997 on cropland in HEL fields was 6.6 tons per acre (from 16.9 tons per acre in 1982 to 10.3 tons per acre in 1997), compared with the 3.9 tons per acre estimated reduction on similar land not in an HEL field. The difference—about 2.7 tons per acre—is statistically different from zero, suggesting that HELC did make a significant difference in soil erosion reduction. During 1997-2012, after the initial implementation of HELC was complete, ERS analysis shows that these soil conservation gains were maintained.
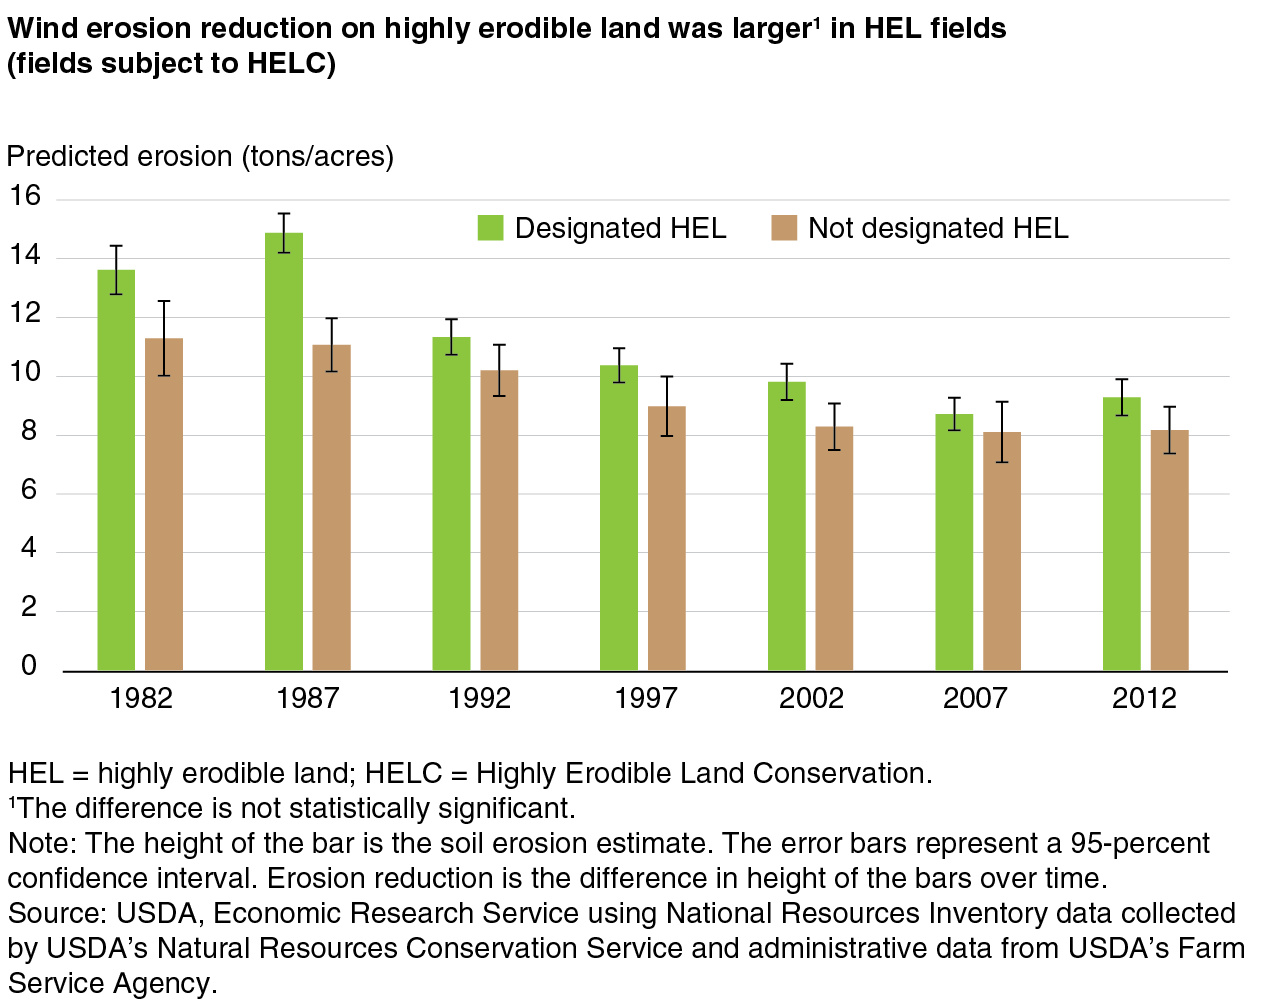
On cropland that is highly erodible for wind, ERS researchers estimate that the average soil erosion reduction between 1982 and 1997 on land in an HEL field was 3.2 tons per acre, compared to a 2.3 ton-per-acre estimated reduction on highly erodible land that is not in an HEL field. However, the difference in erosion reduction between the HEL fields and non-HEL fields—about 0.9 tons per acre—is not statistically different from zero. While the analysis does show large and significant erosion reductions for cropland that is highly erodible for wind, the erosion reductions on wind-erodible cropland in an HEL field were not significantly larger than for cropland that was not in an HEL field. For these reasons, researchers are not confident that these predicted differences in erosion reductions between the two groups are due to conservation compliance.
In addition to the direct effect, HELC may have had “spillover” effects. Once farmers gained experience with the soil-conserving practices required by HELC, they may have subsequently adopted these practices more broadly. Growth in conservation tillage and no-till acreage, for example, coincides closely with the implementation of HELC and may have been encouraged by this type of spillover effect.
Conservation Compliance in the 2014 Farm Act
Maintaining soil conservation gains depends, in part, on continuing effective Compliance incentives. Because these incentives are derived from other programs, changes that are not related to compliance objectives can have a large impact on incentives. The Agricultural Act of 2014 restructured farm commodity (income support) programs to complement crop insurance—and, for the first time since 1996, put crop insurance premium subsidies on the list of benefits that could be withheld in the event of a Compliance violation.
The link between crop insurance and Compliance is controversial. The link was severed in 1996, when the crop insurance program was relatively small, to encourage farmers to buy crop insurance. Since the mid-1990s, premium subsidy rates have increased significantly (the average subsidy is roughly 60 percent) and participation has grown to cover 80 percent or more of the four most widely grown crops (corn, soybeans, wheat, and cotton). The re-linking of crop insurance premium subsidies to Compliance in the 2014 Act recognized the increasing importance of crop insurance in farm support policy.
How strong are compliance incentives under the 2014 Act? A measure of the Compliance incentive is the farm-level benefits subject to sanction (the Compliance incentive) divided by the farm-level costs of meeting Compliance requirements (Compliance costs). For farms where this ratio is greater than one, meeting Compliance requirements is profitable.
To estimate the farm-level Compliance incentive, ERS researchers used three crop price scenarios that correspond roughly to crop prices in 2004 (low), 2010 (medium), and 2013 (high). These years were selected because they encompass the range of crop prices during 2000-16 for most crops—that is, high prices are roughly equal to the highest prices and the low prices to the lowest price received during that period. Incentives depend on crop prices because most commodity payments are triggered by low prices or low revenue. Crop insurance premium subsidies, on the other hand, rise with crop prices because higher prices increase the value of the insured crop. Higher crop prices mean that insured crops have higher value, which increases the crop insurance premium and the premium subsidy (calculated as a percentage of the premium).
| Price scenario | Barley | Corn | Cotton | Sorghum | Soybeans | Wheat |
|---|---|---|---|---|---|---|
| Low price (2004) | 3.28 | 2.83 | 0.68 | 2.80 | 6.72 | 3.40 |
| Medium price (2010) | 4.27 | 3.99 | 0.72 | 3.79 | 9.23 | 5.42 |
| High price (2013) | 5.25 | 5.65 | 0.81 | 5.28 | 12.87 | 8.78 |
| *Expected Source: USDA, Economic Research Service using price data from the USDA Risk Management Agency’s Price Discovery tool. |
||||||
While there were good estimates of farm-level benefits subject to sanction, there are no farm-level data on Compliance costs. Researchers instead estimated an upper bound on Compliance costs using a measure of crop profits in HEL fields. For most land subject to HELC, the cost of conservation systems was limited to avoid driving land out of crop production—so, compliance costs could not exceed crop profit.
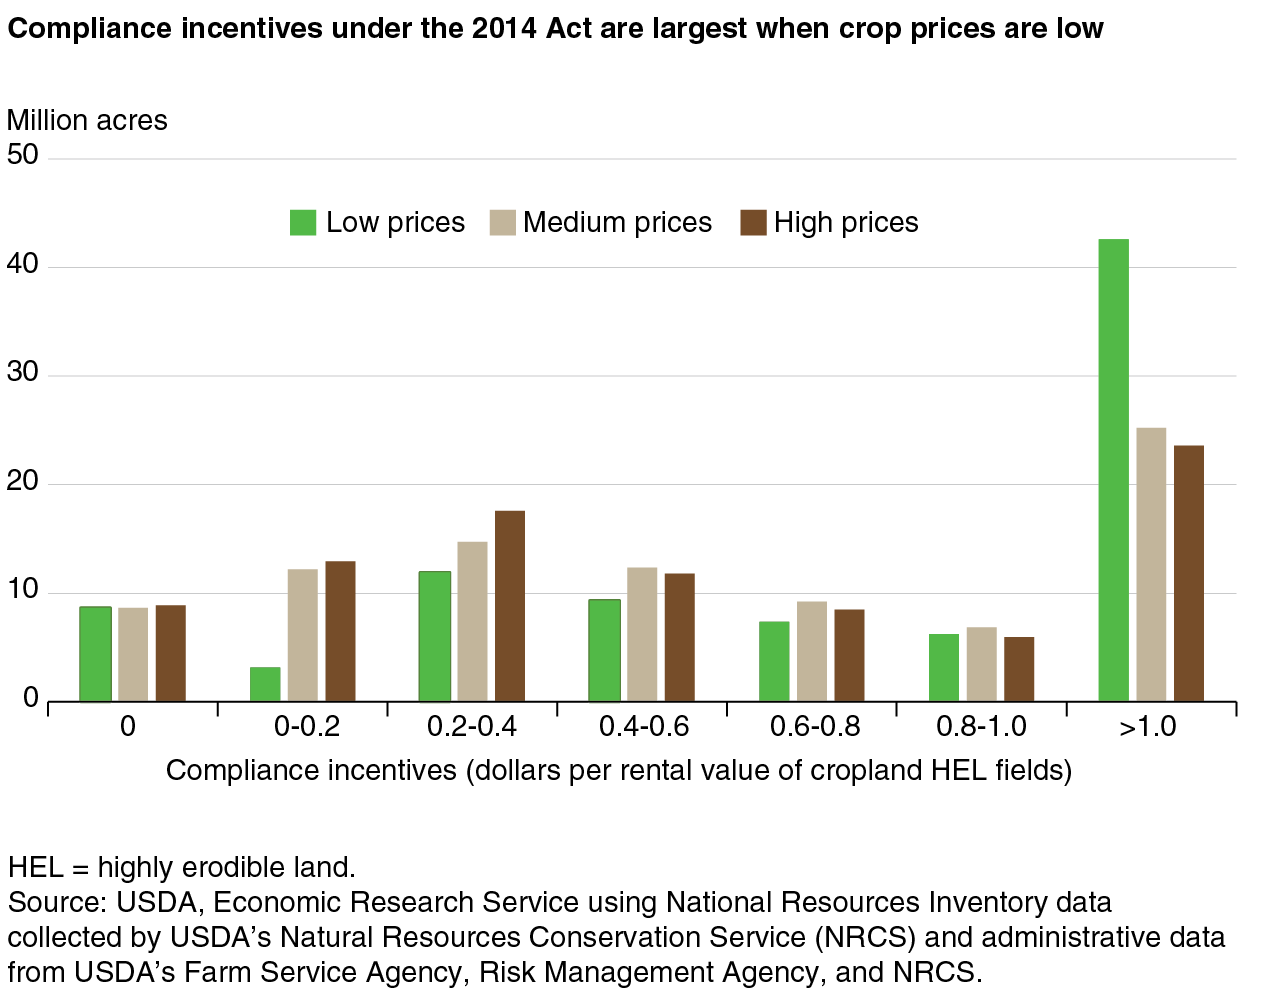
At the national level, Compliance incentives are no weaker (or stronger) than they would have been under a continuation of the 2008 Farm Act. Consider Compliance incentives in the “medium price” scenario (crop prices roughly equal to 2010 levels). Under the 2014 Farm Act, an estimated 27 percent (25 million acres) of cropland in HEL fields is on farms where Compliance incentives are clearly large enough to offset Compliance costs. Compliance incentives are relatively low (greater than zero but less than $0.4 per dollar of rental value) on farms that include 28 percent (27 million acres) of cropland in HEL fields. Roughly 10 percent of cropland in HEL fields (9 million acres) is on farms that receive no farm program benefits (and have no incentive to meet Compliance requirements). Researchers estimate that the distribution of compliance incentives across cropland subject to HELC would have been similar under a continuation of the 2008 Farm Act.
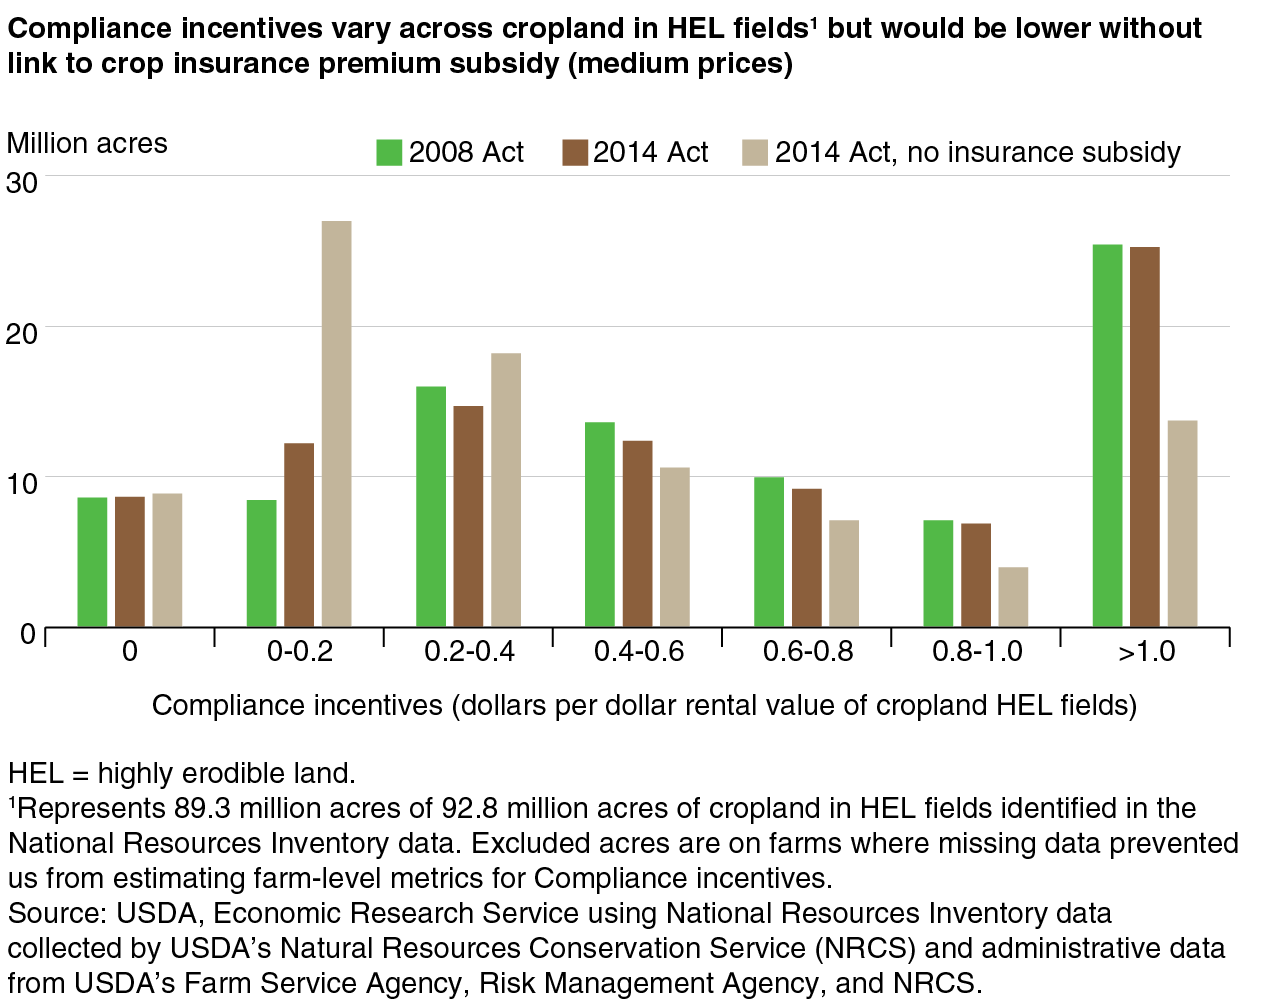
Under the 2014 Act, crop insurance premium subsidies account for a significant share of Compliance incentives. Severing the link between Conservation Compliance and crop insurance premium subsidies (while continuing the link between Compliance and other 2014 Farm Act programs) would mean a 65-percent increase in the amount of highly erodible land on farms where Compliance incentives are relatively low, from 26.9 million acres to 45.2 million acres. ERS researchers note that the role of crop insurance premium subsidies is larger when crop prices are higher and much smaller when crop prices are lower (see box for price levels in “high price” and “low price” scenarios).
Aggregated results mask considerable change to incentives on individual farms. The farm-level effect depends on the specific mix of farm-program benefits a particular farm receives. For example, the 2014 Act ended Direct Payments and re-linked crop insurance premium subsidies to Conservation Compliance for the first time since 1996. Farms for which Direct Payments were much larger than crop insurance premium subsidies are most likely to see a reduction in Compliance incentives under the 2014 Act (e.g., many farms in the Corn Belt). The opposite is true on farms for which Direct Payments were smaller than premium subsidies (e.g., many farms in the Northern Plains).
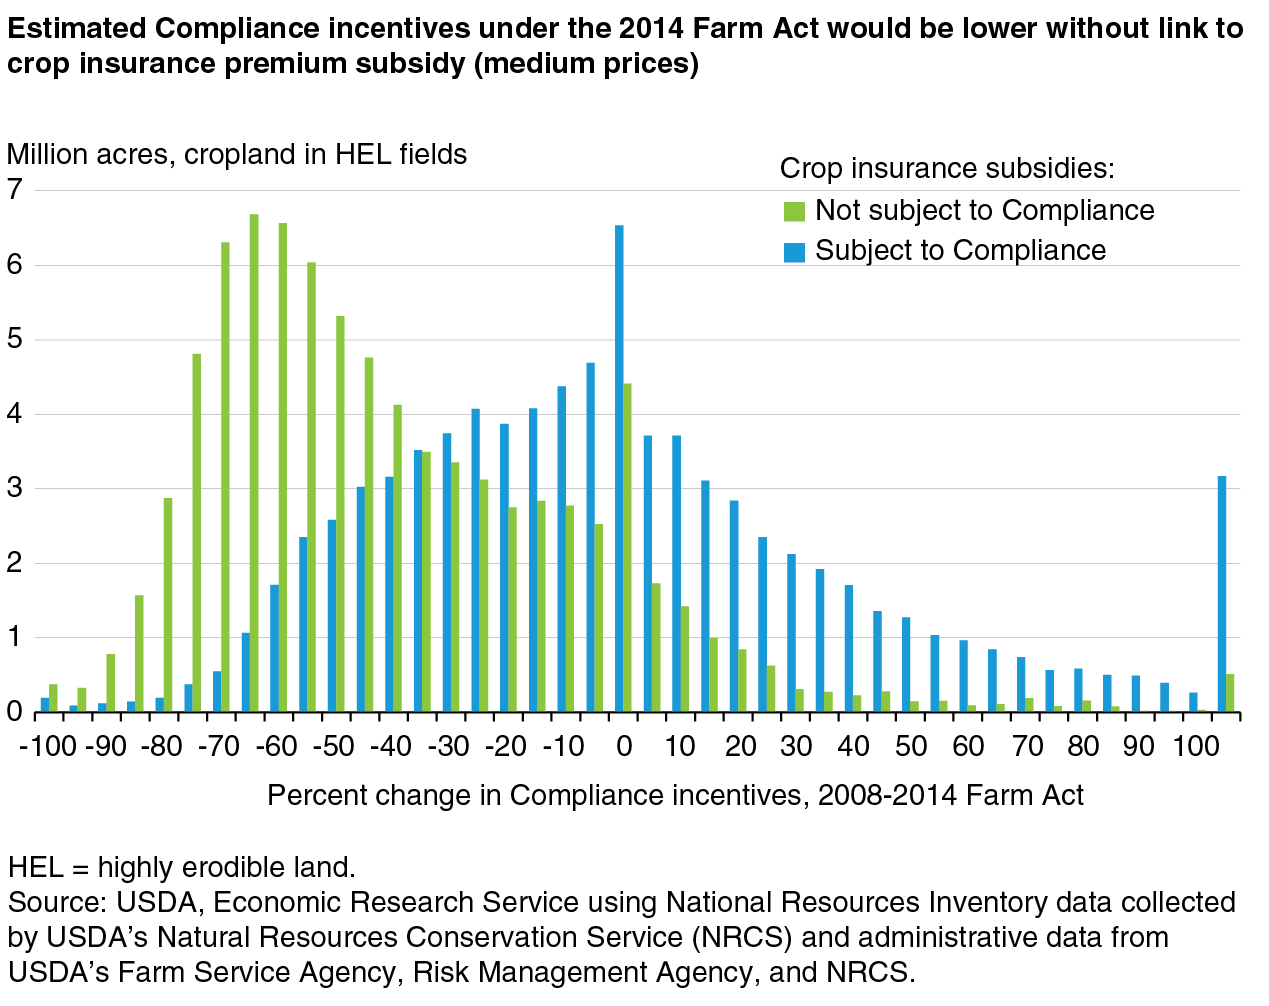
For the medium-price scenario, we estimate that 27 million acres (29 percent) of cropland in HEL fields are located on farms where Compliance incentives are at least 25 percent lower than they would have been under an extension of the 2008 Act. Conversely, roughly 18 million acres (20 percent) of cropland in HEL fields are on farms where Compliance incentives are at least 25 percent higher than they would have been under the 2008 Act. In the absence of crop insurance premium subsidies, a much larger share of cropland in HEL fields would be on farms where Compliance incentives are lower and the size of the declines would be larger than they would have been under 2008 programs.
Finally, the combination of commodity payments and crop insurance premium subsidies helps ensure that Compliance incentives are effective over a wide range of crop prices. When expected crop prices are low, high Compliance incentives reflect high expected commodity program payments. Market year average crop prices (or crop revenue) are also likely to be low enough to trigger commodity payments.
By comparison, when expected prices reflect the medium price scenario, market year average crop prices (or crop revenue) are much less likely to be low enough to trigger commodity payments. Higher crop insurance premium subsidies offset some of the decline in commodity payments compared to the low price scenario.
And when expected crop prices are high, market year average crop prices (or crop revenue) are very unlikely to be low enough to trigger commodity payments. This means expected commodity payments are low. Compared to medium-level expected prices, however, higher crop insurance premium subsidies offset nearly all of the decline in expected commodity payments.
Conclusion
Conservation Compliance reduced soil erosion on highly erodible cropland. Statistically, the evidence is strong for water (rainfall) erosion, but somewhat less strong for wind erosion. In either case, the ERS analysis addresses only the direct, enduring effect of HELC. If farmers who gained experience with soil conserving practices (e.g., conservation tillage) under HELC also adopted these practices on other land, the actual effect of HELC may have been larger.
The study shows that Compliance incentives under the 2014 Act are similar to those under the 2008 Farm Act, if it had continued. The study also shows that crop insurance premium subsidies make up a substantial portion of benefits subject to Compliance sanction and help maintain strong Compliance incentives over a wide range of crop prices.
Finally, aggregate results mask Compliance incentive changes on individual farms. A significant portion of cropland in HEL fields is on farms that are estimated to experience a 25-percent increase or decrease in farm-wide Compliance incentives. In the absence of crop insurance premium subsidies, the portion of farms that experience a decline in farm-wide Compliance incentives would be much larger.
This article is drawn from:
- Claassen, R., Bowman, M., Breneman, V., Wade, T., Williams, R., Fooks, J.R., Hansen, L., Iovanna , R. & Loesch, C. (2017). Conservation Compliance: How Farmer Incentives Are Changing in the Crop Insurance Era. U.S. Department of Agriculture, Economic Research Service. ERR-234.
You may also like:
- Farm & Commodity Policy. (n.d.). U.S. Department of Agriculture, Economic Research Service.
- Natural Resources & Environment. (n.d.). U.S. Department of Agriculture, Economic Research Service.