
Growing Organic Demand Provides High-Value Opportunities for Many Types of Producers
- by Catherine Greene, Gustavo Ferreira, Andrea Carlson, Bryce Cooke and Claudia Hitaj
- 2/6/2017
Highlights
- In 2015, the Organic Trade Association estimated U.S. organic retail sales at $43.3 billion, showing double-digit growth during most years since 2000, when USDA set national organic standards.
- The United States had over 21,700 certified organic operations in 2015—60 percent were crop and livestock farmers, while 40 percent were processors, manufacturers, and other food handling operations.
- Since setting national organic standards, USDA has streamlined trade arrangements with multiple foreign governments to expand international markets for U.S. organic producers, and has also widened access for organic producers to risk management, conservation, and other farm programs.
Organic agriculture began developing in the first half of the 20th century as an alternative to conventional production systems that use synthetic chemical inputs. USDA set national organic standards in 2000, providing a single set of rules for U.S. organic farmers and handlers and replacing the patchwork of State and private standards that had emerged by the early 1990s.
USDA defines organic production as the use of cultural, biological, and mechanical practices that support cycling of onfarm resources, promote ecological balance, and conserve biodiversity. Organic producers are required to avoid the use of synthetic chemicals, antibiotics, and hormones in crop and livestock production—and rely instead on biological pest management, cover crops, and other ecologically based practices. Research has associated these practices with a variety of benefits, including reduced pesticide residues in food and water, lower energy use, and enhanced biodiversity (see box “What Does the Organic Label Really Mean?”).
While U.S. organic food sales still account for a relatively small share of total U.S. food sales, they have exhibited double-digit growth during most years since 2000 and the organic share has been growing rapidly. In 2015, the Organic Trade Association estimated U.S. organic retail sales at $43.3 billion. Along with natural food supermarkets, restaurants, and direct marketers, most major U.S. food retailers—including Costco, Walmart, and Target—have expanded their organic food offerings in recent years.
Rapid expansion in consumer demand continues to provide opportunities for U.S. organic producers to enter high-value markets in the United States and other countries. Although the United States and the European Union (EU) are the two biggest markets for organic products, most countries have growing domestic markets.
Millennials Spur Growth in the Organic Market
Organic products have shifted from being a lifestyle choice for a small segment of consumers to being consumed at least occasionally by many Americans. In 2014, Gallup included questions on organics in its annual food consumption survey for the first time and found that 45 percent of Americans actively tried to include organic foods in their diets.
Consumer interest in organic food, however, varies by demographic and region. Over half of survey respondents age 18 to 29 reported that they actively try to include organic products, compared with one-third of those age 65 and older. The share of Americans with annual household income under $30,000 that actively tried to include organic foods (42 percent) was similar to the share with over $75,000 in household income (49 percent). And a higher share of consumers seek out organic products in the West (54 percent) than in the East (39 percent), South (43 percent), and Midwest (47 percent).
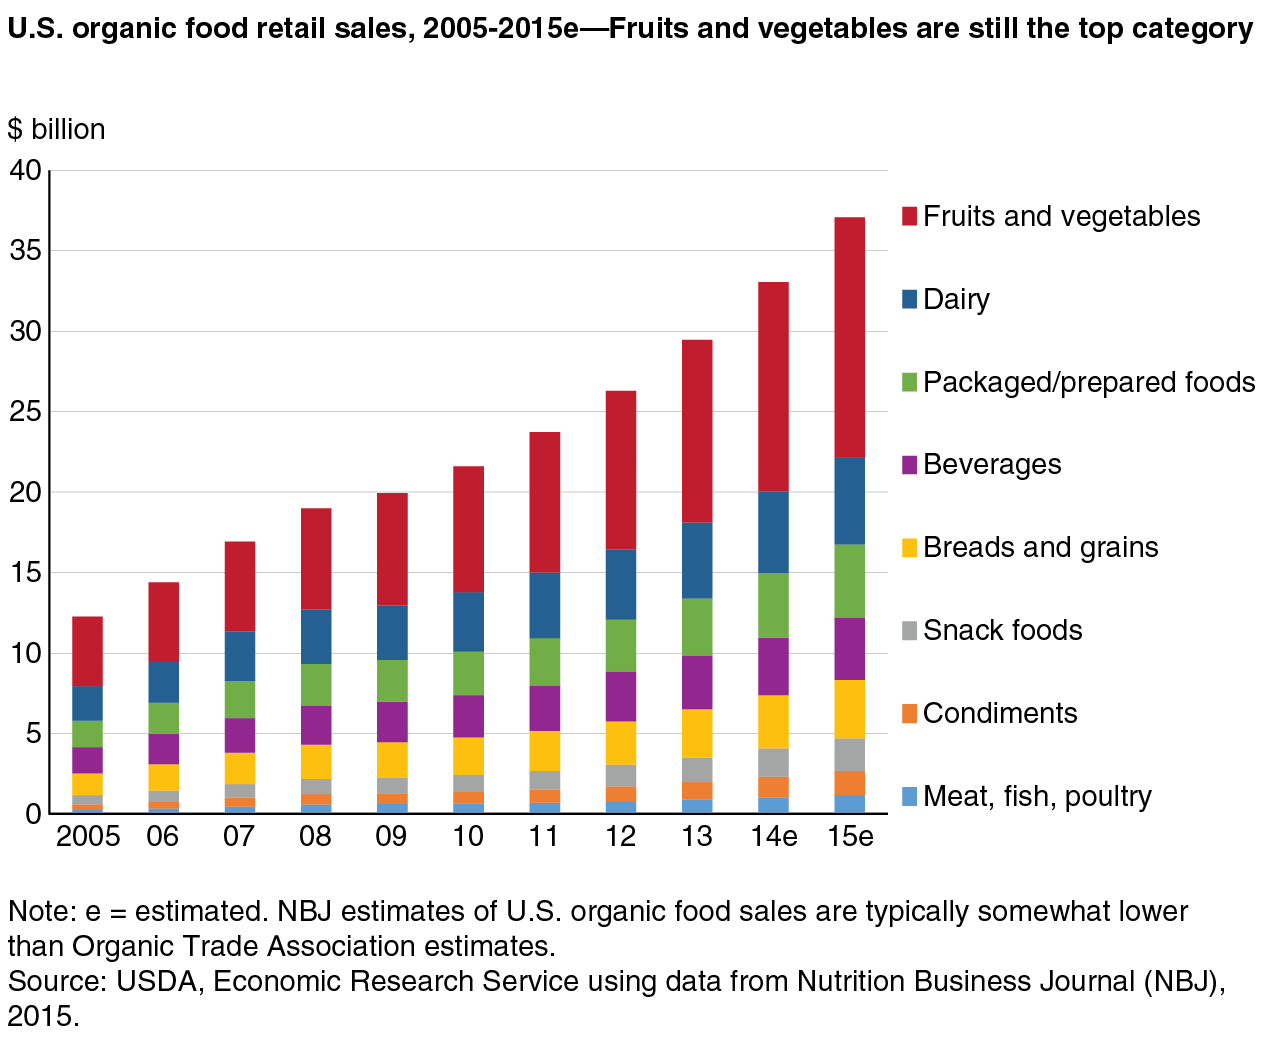
While fresh fruits and vegetables were still the top selling organic category, organic sales in all the other food categories also grew between 2005 and 2015. The U.S. organic dairy sector is the second largest category of organic sales, and organic dairy production is also expanding. According to the Organic Trade Association, organic food purchases accounted for approximately 5 percent of total U.S. at-home food expenditures in 2015, more than double the share in 2005.
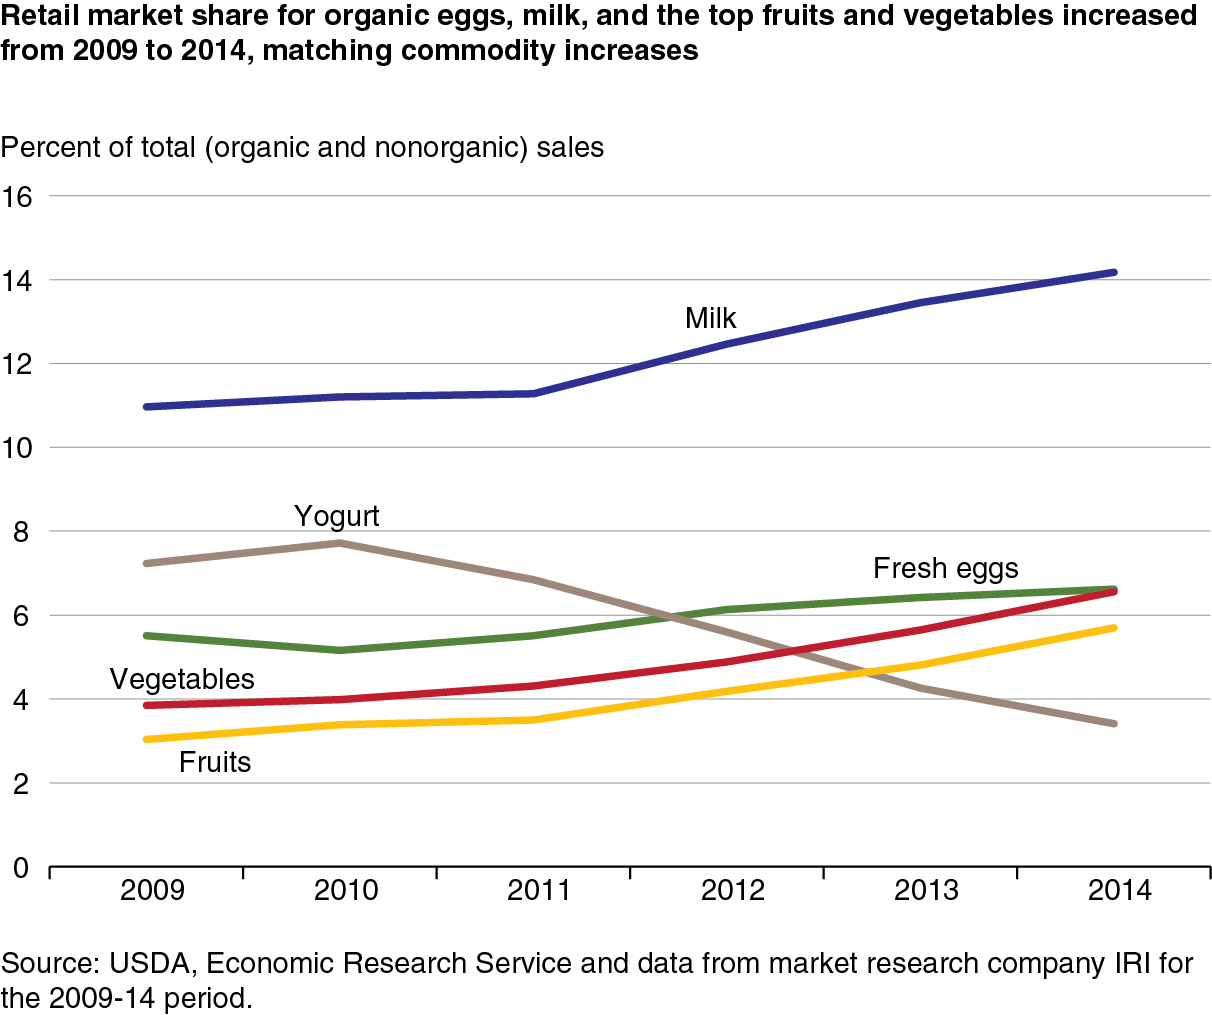
ERS analysis of U.S. organic sales data for five major retail food categories shows that the organic market share increased for most categories between 2009 and 2014. The highest organic market share in 2014 was for organic milk (14 percent of total sales), followed by organic eggs and organic vegetables (both at nearly 7 percent). Previous ERS research on the organic market share of 17 individual food products showed increases for all products examined between 2004 and 2010. These products’ organic market share in 2010 was generally higher for foods frequently fed to children and for those with lower premiums, including spinach, granola, and carrots.
Organic Production in the U.S. Varies Regionally
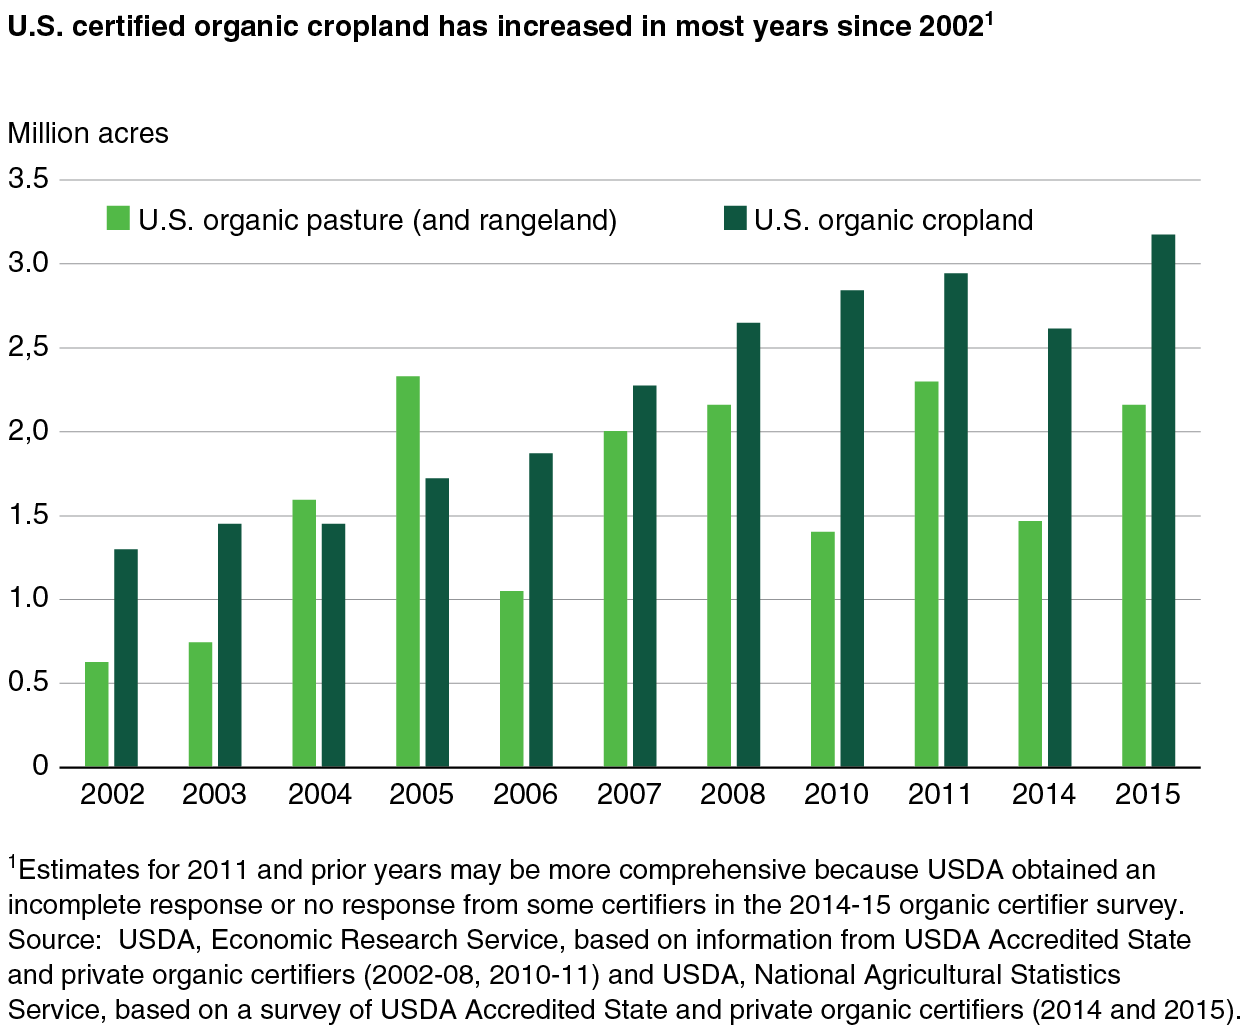
Although the organic sector still shows substantial regional and commodity concentration, all 50 States now have some organic production and processing. In 2015, the United States had 3.2 million acres of certified organic cropland and 2.2 million acres of certified organic pasture (including rangeland). That land accounted for less than 1 percent of all U.S. cropland and pasture but continued the long-term growth trend in the organic sector, according to ERS and NASS estimates based on data from U.S. certifiers.
U.S. adoption of organic systems has been much higher in some sectors. Markets for organic vegetables, fruits, and herbs have been developing for decades in the United States. Organic farming systems were used on 6 percent of U.S. vegetable acres in 2011 and on 4 percent of fruits and nuts acres. In contrast, organic production systems were adopted on less than 0.3 percent of the U.S. acres for corn and soybeans, the two largest crops in the United States.
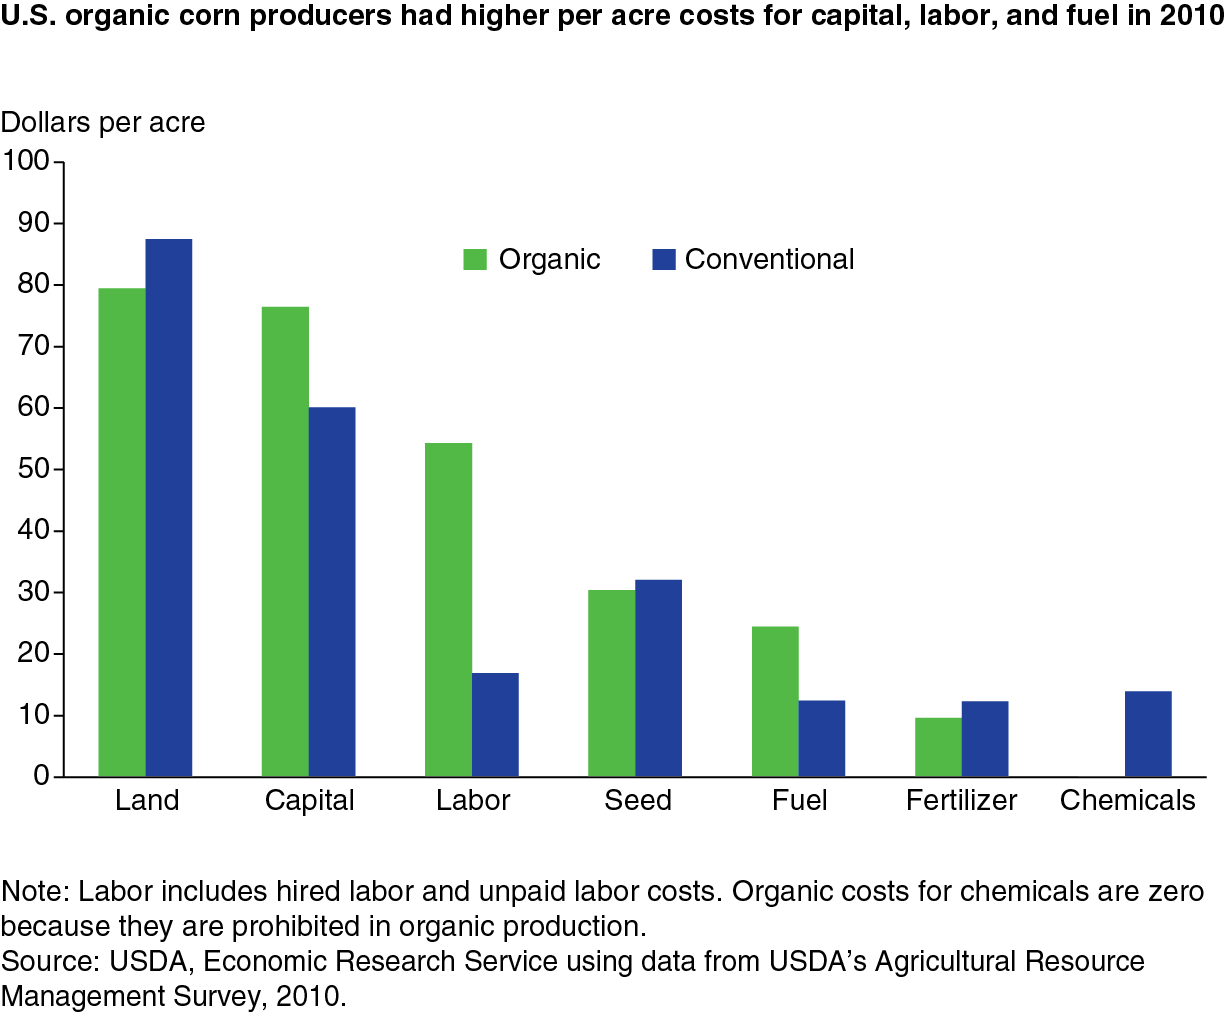
ERS recently compared the costs and returns for organic and conventional corn and soybean production using data from USDA’s Agricultural Resource Management Survey. U.S. organic corn producers had higher per-acre costs for capital, labor (including hired and unpaid labor), and fuel than producers using conventional systems. The pattern of cost differences was similar for soybeans. ERS found that the per-bushel returns to organic corn and soybean production were mostly higher than for conventional production, primarily because of the price premiums paid for organic crops.
The ERS study also found that the production practices used on organic and conventional field crop operations were quite different. Almost all of the conventional producers of corn and soybeans relied on chemical pesticides for weed control, while organic producers relied on tillage and other nonchemical practices. Organic corn and soybean producers often rotated row crops with small grain and meadow crops, and included an idle year in the rotation. By comparison, conventional producers mainly used a rotation of continuous row crops.
Despite potentially higher per-acre returns, the adoption of organic production systems for corn and soybeans has been slow. This is due to factors such as achieving effective weed control and the processes involved with organic transition and certification. Organic corn and soybean production was, on average, conducted on farms with less total acreage and less field crop acreage than conventional farms.
USDA’s organic regulatory program data show that organic farm production and food-handling operations are concentrated in California (the country’s top fruit and vegetable producer), the Northeast (which has many small-scale organic farms), and the Upper Midwest (a major producer of organic milk). Northeastern States have the highest share of certified organic farmers, particularly Vermont and Maine, where 5 percent and 6 percent, respectively, of all farmers are certified organic. In California, more than 3.6 percent of all farmers are certified organic.
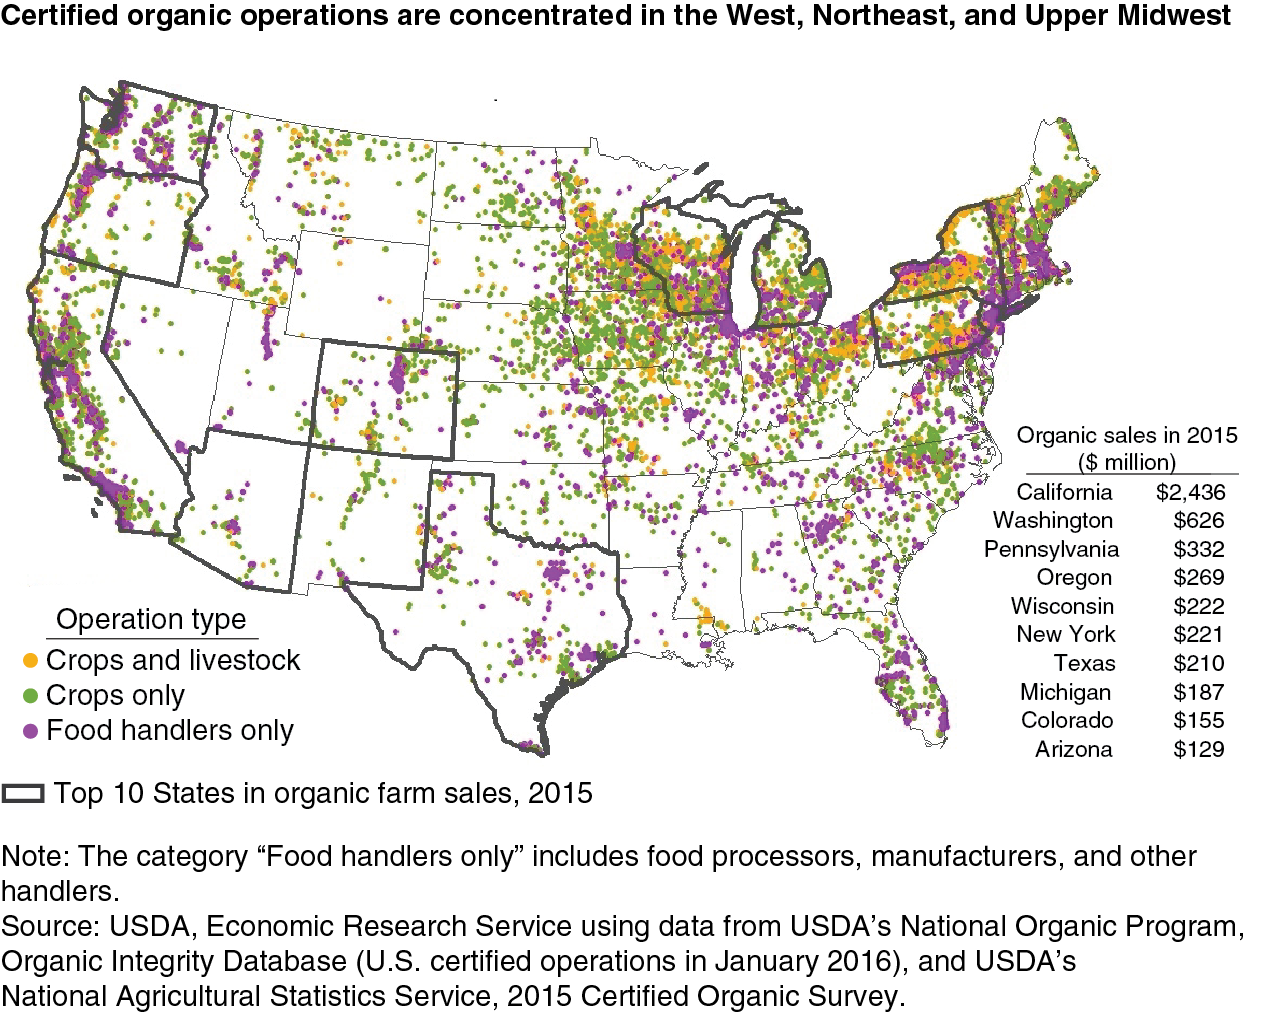
Organic processors, manufacturers, and other food-handling operations are concentrated around large metropolitan areas, while certified organic livestock operations are located predominantly in the Great Lakes region. Southern States have historically had the fewest organic operations, although USDA data show that several of these States have seen high growth recently. In New York, Indiana, North Carolina, Missouri, and Texas, more than half of organic producers were newly certified in 2013.
The top 10 States for organic farm sales were California, Washington, Pennsylvania, Oregon, Wisconsin, New York, Texas, Michigan, Colorado, and Arizona. These States accounted for 78 percent of the total value of all U.S. certified organic commodities sold in 2015. California alone contributed 39 percent of total U.S. organic farm sales.
Certified organic farm sales were $6.2 billion in 2015 and accounted for approximately 2 percent of total U.S. crop and livestock receipts. While overall U.S. crop and livestock receipts declined 11 percent between 2014 and 2015, sales of certified organic crop and livestock products increased 13 percent. Fruits, vegetables, and other specialty crops were the top organic sector in 2015—with 46 percent of total organic sales—followed by milk and eggs (31 percent), livestock and poultry (12 percent), and field crops (11 percent). Top individual crop sales in 2015 included organic apples ($302 million), lettuce ($262 million), and grapes ($210 million). The top animal product sales were milk ($1.2 billion), eggs ($732 million), and broiler chickens ($420 million).
Organic Farmers Are Younger and Often Market Directly to Consumers
Farm operators are younger in the organic sector than in the overall agriculture sector, and organic farms tend to be more diversified in the number of crops produced. Organic farming systems substitute legume-type cover crops and diverse crop rotations for synthetic fertilizer, and USDA regulations also require pasture for organic livestock. Organic farmers may also produce a number of different crops as a way to hedge against crop losses from pest infestations that are often crop specific.
Organic farms also have much higher levels of consumer-direct and value-added marketing than conventional farms. One reason is that the crops that tend to be marketed directly to consumers—fruits, vegetables and other specialty crops—claim a much larger share of the organic sector than for the overall U.S. farm sector. Value-added products that are processed on the farm are also an important type of farm diversification in the organic sector. Nearly 8 percent of the organic farmers in 2014 were also handlers, producing value-added products on the farm that garnered an additional $730 million in farm sales.
U.S. Is Both Exporter and Importer of Organic Products
A growing organic export market has emerged in recent years. The U.S. currently tracks only a small set of the organic commodities that are exported. The value of tracked organic commodities (mostly fresh fruits and vegetables) was $551 million in 2015, up 34 percent from 2011. Organic apples, grapes, and lettuces were among the top organic exports in 2015 and accounted for about 12 percent of the total export value of these three exports.
The U.S. is the largest foreign supplier of organic products to Canada and is also an important supplier to Mexico. However, many destinations for U.S. organic exports are not reflected in our U.S. trade data because many organic products are not being tracked. For example, EU imports from the United States tend to be consumer-oriented goods, such as processed products—but the United States does not track organic exports of most processed products.
The U.S. also imports organic commodities it does not produce in large quantities, such as bananas, coffee, olive oil, and mangos. According to the U.S. Census Bureau, the value of selected U.S. organic imports was approximately $1.6 billion in 2015. Organic goods imported for geographical advantages, like bananas, have remained relatively steady in terms of value, while organic animal feed imports, such as corn and soybeans, have risen sharply. Even though the United States is one of the world’s top producers and exporters of organic corn and soybeans, imports of these crops increased 216 percent and 30 percent, respectively, in 2015, due to the wide gap between domestic production and demand.
Farm and Retail Premiums Hold Steady for Most Products
Most organic commodities receive significant price premiums over conventionally grown products due in part to higher production costs and the extra costs associated with certification. Organic farmers must find organic approved seed, learn to manage fertility and pests through natural methods, and locate their own markets. Prices for organic grain crops can also be much higher than conventional grain crop prices due to high demand from the expanding organic dairy and poultry sectors.
Bringing organic products to grocery shelves incurs additional costs beyond the farm gate as well. For example, handlers and food processors must sequester organic and nonorganic ingredients, while retailers must prevent the mixing of unpackaged organic and nonorganic products. ERS research shows that many consumers are willing to pay more for organic foods, but estimating how much more can be challenging due to product and package comparability issues. Organic products may be more expensive simply because the item has additional processing or a trait or flavor desired by the consumer.
ERS examined the retail organic price premiums for 17 products from 2004 to 2010 using a statistical model that isolates the part of each product’s price related to the organic characteristic. All 17 of the commonly purchased organic products were more expensive than their nonorganic counterparts. Organic price premiums were more than 20 percent higher than the nonorganic price for all but one (spinach) of the products analyzed. Eggs and dairy had the highest premiums in 2010, ranging from 52 percent of the nonorganic price for yogurt to 82 percent for eggs. Fresh fruits and vegetables had the widest range of prices between organic and nonorganic.
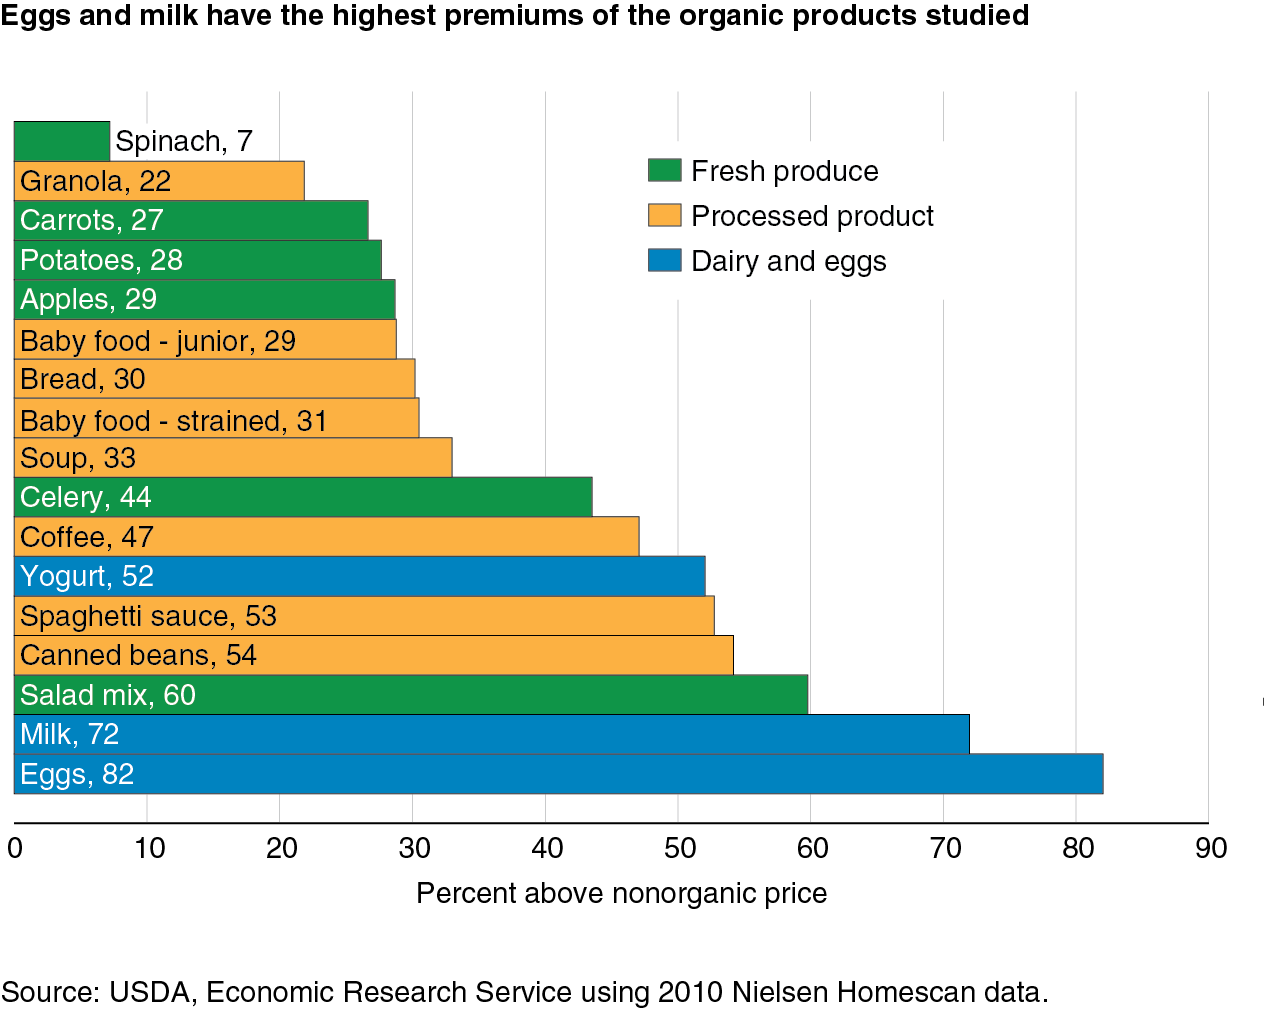
Most premiums did not steadily increase or decrease during the 7 years studied but fluctuated. Three products—spinach, canned beans, and coffee—saw premiums steadily decline between 2004 and 2010. Only two products—strained baby food and yogurt—had price premiums that steadily increased.
Access to Farm Programs Widened Since 2000
U.S. consumer demand for organic food has outpaced domestic production since the national standards were set in 2000. Public and private sector initiatives could further boost demand. In 2010, USDA set its first priority goal for organic agriculture: expanding the number of U.S. certified organic operations by 25 percent over a 5-year period. To facilitate transition to organic production, USDA developed new provisions in risk management, conservation, research, and other farm programs to widen access to these programs for organic and transitioning producers. USDA also expanded U.S. agricultural trade efforts to include bilateral negotiations to facilitate organic trade. In addition, Congress boosted funding for a number of organic programs in the 2014 Farm Act to assist producers with organic certification costs, expand organic research, and improve technical assistance and crop insurance.
USDA and congressional efforts to facilitate organic production include:
Cost-share assistance for organic certification. Organic certification is mandatory for all organic farmers and handlers with over $5,000 in annual organic sales. Certification costs include application fees, inspection costs, and travel costs and per diem expenditures for inspectors. Congress boosted total funding for USDA’s two organic certification cost-share programs in the 2014 Farm Act. Under these programs, USDA may reimburse producers and handlers up to 75 percent of their certification costs, up to a maximum of $750 per scope of operation certified.
However, more producers may now reach the coverage limit well before 75 percent of their certification costs are covered. Average organic certification costs have increased from $1,264 per farm in 2008 to about $1,517 per farm in 2015. Fewer than half of the certified organic farmers in 2015 were enrolled in a certification cost-share program. Beginning in 2017, this program will be administered by USDA’s Farm Service Agency to make producer participation easier. Producers that are transitioning to organic production will also be eligible to participate in the certification cost-share program beginning in 2017.
Environmental Quality Incentives Program (EQIP) Organic Initiative. EQIP provides technical and financial assistance for conservation practices and activities. The EQIP Organic Initiative created under the 2008 Farm Act targets funding for conservation practices related to organic production and transition. The Act, however, capped these payments at a lower level than payments from the regular EQIP.
USDA’s Natural Resources Conservation Service has also expanded its outreach on conservation assistance to organic and transitioning producers in recent years. In 2016, this agency established a field-level “organic champions” position in each state to improve assistance to organic and transitioning producers.
Federal crop insurance. In the Agricultural Risk Protection Act in 2000, Congress recognized that organic farming practices are good farming practices and extended crop insurance coverage to organic producers. Federal crop insurance was initially less attractive to organic producers because the program generally did not account for the higher prices that organic farmers would receive for their crops. USDA’s Risk Management Agency (RMA) subsequently published organic price elections for a substantial number of commodities. RMA also added a 2016 provision allowing certified organic or transitioning producers with a written contract from a buyer to insure their crop at the contract price.
Research on organic farming systems. Organic farming is based on detailed knowledge that is often specific to a region and crop. In 2002, Congress established the Organic Agriculture Research & Extension Initiative, the first major USDA grant program to support research projects that address the critical production challenges faced by organic farmers. The number of high-quality research applications for this competitive grant program has substantially exceeded the number that can be funded since the program’s inception in 2002. In the 2014 Farm Act, Congress set total mandatory funding at $20 million annually, just above its annual funding level under the 2008 Act.
Bilateral agreements to facilitate organic trade. The international organic market is characterized by numerous sets of regulations and standards that differ from country to country. After setting national organic standards, USDA began negotiations with a number of countries to develop bilateral trade agreements, called equivalency arrangements. These arrangements allow goods certified to either country’s organic standard to be sold as organic in both countries. Equivalency arrangements improve access to foreign markets by reducing the need for additional inspection, auditing, and other costs.
The United States entered into its first equivalency arrangement with Canada in 2009, and subsequently with the European Union (2012), Japan (2014), South Korea (2014), and Switzerland (2015). The United States also has unilateral arrangements with Taiwan, New Zealand, Israel, and India—and is expected to have a new equivalency arrangement with Mexico in 2017.
In addition to government efforts, the private sector is taking steps to encourage the adoption of organic farming systems in the United States. For example, General Mills has set goals for expanding the organic acreage for its ingredients and developed partnerships with the Organic Valley dairy cooperative, organic advocacy groups, university researchers, and others to encourage organic farming. Another example is food retailers, like Whole Foods and Costco, which have developed pilot programs to lend money to farmers for organic farming. Local and regional initiatives are also emerging as the interest in organic food and agriculture continues to expand.
This article is drawn from:
- Carlson, A. & Jaenicke, E.C. (2016). Changes in Retail Organic Price Premiums from 2004 to 2010. U.S. Department of Agriculture, Economic Research Service. ERR-209.
- Greene, C., Wechsler, S.J., Adalja, A. & Hanson, J. (2016). Economic Issues in the Coexistence of Organic, Genetically Engineered (GE), and Non-GE Crops. U.S. Department of Agriculture, Economic Research Service. EIB-149.
- McBride, W.D., Greene, C., Foreman, L. & Ali, M. (2015). The Profit Potential of Certified Organic Field Crop Production. U.S. Department of Agriculture, Economic Research Service. ERR-188.