
Farm Households Experience High Levels of Income Volatility
- by Nigel Key, Daniel Prager and Christopher Burns
- 2/22/2017
Highlights
- For many farm households, income varies considerably from year to year and may even be negative; farm household income volatility is driven mostly by farm income, which is more volatile than off-farm income.
- Total household income is more volatile on larger farms than on smaller farms, and crop farms have more volatile household income than livestock farms.
- Between 1996 and 2013, the volatility of farm household income declined 1.2 percent per year.
Farm income is highly variable, with earnings subject to fluctuations in output and prices. Income variability affects key farm decisions—how much labor to use on-farm versus off-farm, how much income to save as a cushion for low-earning years, how much income to invest in machinery or land, which combinations of crops or livestock to produce, and how much income to spend on risk-reducing inputs such as pesticides or irrigation. Because household income variability influences these decisions, it can strongly affect agricultural production and household well-being. Also, by influencing land, water, and agrochemical decisions, income variability can affect environmental quality.
Federal agricultural policies have long been designed to shelter farmers from income fluctuations through the use of price supports, direct income support, disaster assistance programs, and yield and revenue insurance programs. Recently, the 2014 Farm Act shifted spending priorities to programs designed to reduce income risk—eliminating direct payments and creating new programs with payments linked to annual or multiyear fluctuations in prices, yields, or revenues.
Despite the importance of income volatility for farm household behavior and welfare and the growing emphasis of Federal programs on farm income risk reduction, there is little information about the extent of individual U.S. farm household income volatility and the degree to which it varies across different types of households. Aggregate statistics (e.g., the national mean or median income) can provide useful insight into how the farm sector as a whole fares from year to year but can mask considerable variation at the farm level. In a given year, producers in one region might be thriving, whereas those in another region might be incurring losses from local drought or pest infestations—so individual household income can vary much more than aggregate statistics would suggest
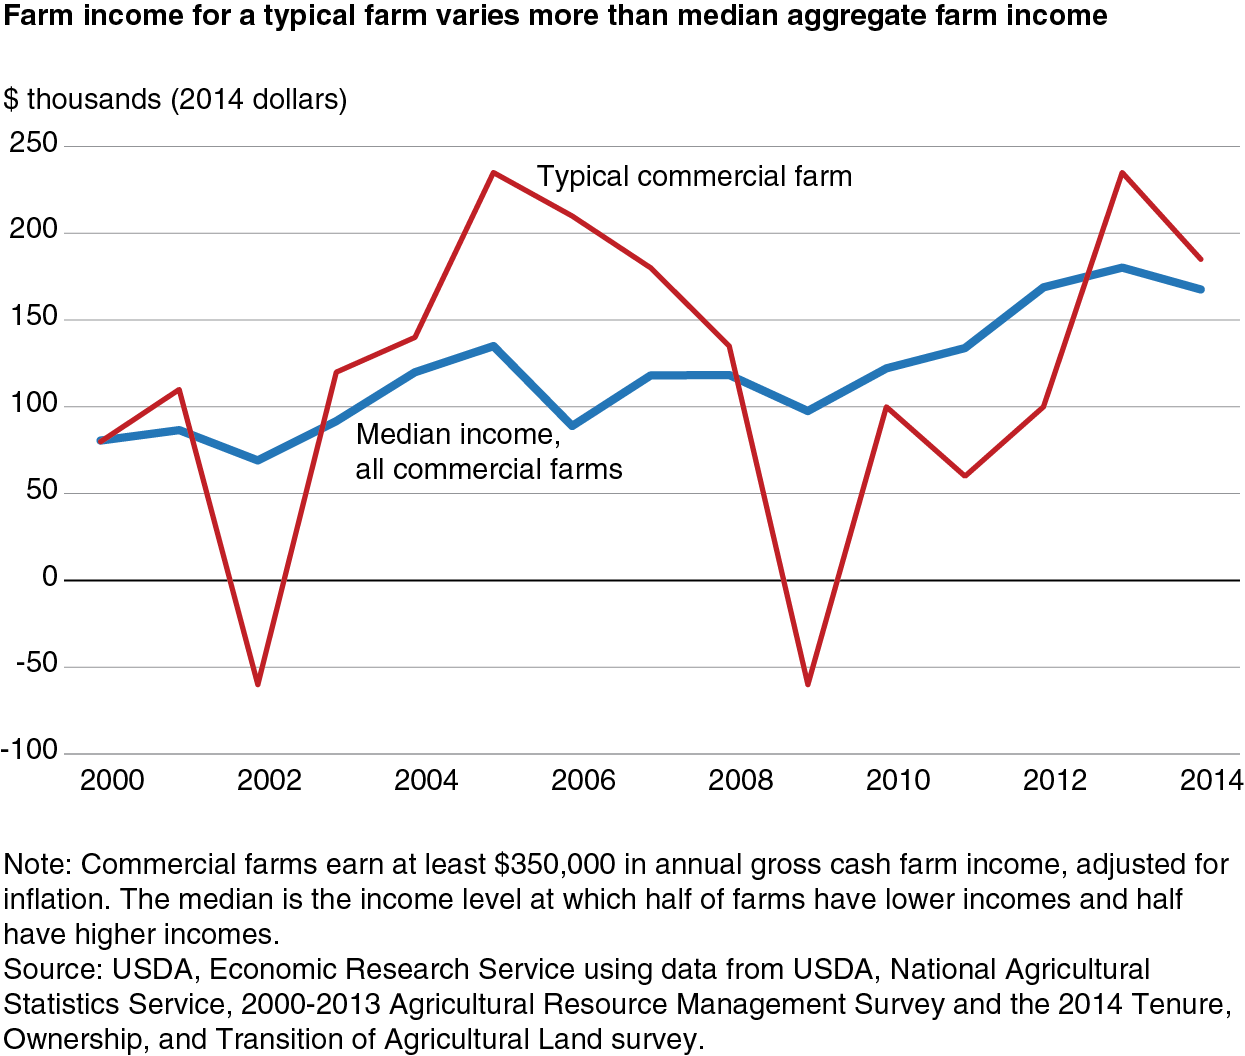
For example, between 1999 and 2004, the median farm income for a commercial farm household (with at least $350,000 in gross cash farm income, adjusted for inflation) ranged from about $70,000 to $180,000, and the average magnitude of the change (positive or negative) in median income between consecutive years was about $20,000. The median income over the period varied less than the income of a typical commercial farm. This is illustrated in the figure with the red line, which shows the annual farm income of a single hypothetical commercial farm. Between 1999 and 2014, this typical farm had the same average income as the median commercial farm (about $120,000). However, the income stream for the farm shown here varied more from year to year—with an average income swing of $86,000. Because farm income spans a wide range, in some years, a usually profitable commercial farm household loses money.
To better understand the extent of farm income variability experienced by U.S. farm operations, ERS researchers matched observations of farms that were collected more than once between 1996 and 2013 by USDA’s Agricultural Resource Management Survey (ARMS). The survey data show how farm and nonfarm income changed over time for the same household, which allows for an accurate assessment of inter-annual income fluctuations. Because the subset of farms that were surveyed more than once tend to be large operations, the dataset of repeat observations does not represent the farm population as a whole. However, the farms observed display characteristics that are very similar, on average, to commercial farms – the types of farms responsible for most U.S. agricultural production.
For the farms that were surveyed more than once, several measures of volatility indicate that farm income is more volatile than off-farm income. The median absolute change in farm income between periods was $86,462, which was 80 percent more than the median farm income ($48,057). In contrast, the median absolute change in off-farm income was $16,793, which was about half the median off-farm income ($33,037). Similarly, 46 percent of households in the sample experienced negative farm income in at least one of the two periods, and 14 percent had negative farm income in both periods. In contrast, off-farm income was negative in either period for less than 0.1 percent of the sample.
| Farm income | Off-farm income | Total income | |
|---|---|---|---|
| Median ($) | 48,057 | 33,037 | 98,893 |
| Median absolute change between years ($) | 86,462 | 16,793 | 100,925 |
| Standard deviation between years | 184,449 | 35,665 | 199,270 |
| Share negative in at least 1 year (%) | 46 | 0 | 26 |
| Share negative in both years (%) | 14 | 0 | 4 |
| Coefficient of variation | 1.35 | 0.67 | 1.06 |
| Note: The sample includes 27,515 pairs of observations of the same farm between 1996 and 2013. The term “years” refers to survey years. The coefficient of variation is a measure of income volatility and is defined as the standard deviation of income between years divided by the mean income. Source: USDA, Economic Research Service using data from USDA’s 1996-2013 Agricultural Resource Management Survey. |
|||
Because farm income is a large component of total household income, total household income is quite volatile, with 26 percent of the sample having negative income in at least one year, and 4 percent having negative income in both years. Farm households have more volatile household income than nonfarm households. The farm households reflected in the ARMS data had a median income change between periods of $100,925, which was approximately the same as their median income. In contrast, studies of nonfarm households have found that, during the same period, the median absolute change in household income between years was about $11,000, which was approximately 25 percent of the median income of nonfarm households.
Households operating larger farms have more volatile income
Do the main type of commodity produced, the size of the operation, or the operator’s education have an influence on farm household income volatility? Model results indicate that crop farms have a total household income that is about 9 percent more volatile than that of livestock farms. Total income (farm and off-farm) might be less volatile on livestock farms than on crop farms because the prevalence of marketing and production contracts on hog and poultry operations reduces farm income volatility. It is also possible that crop production is inherently more volatile than livestock production as crops are more vulnerable to weather and pests.
| Characteristic of farm operation or operator | Estimated percent change in total household income volatility |
|---|---|
| Being a crop farm rather than a livestock farm | 8.8 |
| Having assets worth $750,000 to $1.5 million rather than less than $750,000 | 22.9 |
| Having assets worth $1.5 million to $3.0 million rather than less than $750,000 | 41.2 |
| Having assets worth more than $3.0 million rather than less than $750,000 | 58.7 |
| Operator has a high school education rather than less than high school | -11.0 |
| Operator has some college education rather than less than high school | -11.5 |
| Operator has a college degree rather than less than high school | -18.9 |
| The operator’s primary occupation is farmer | 63.1 |
| The operator is married both years | -22.9 |
| Each year the survey was conducted after 1996 | -1.2 |
|
Note: Total income volatility is measured using the coefficient of variation in total household income, which is the standard deviation of income between years divided by the mean income. The table shows the estimated effects for the statistically significant variables in the regression model. |
|
Households with larger farm operations have more volatile income than those with smaller operations. For example, households with farm assets between $750,000 and $1.5 million had total income volatility that was 23 percent greater than those with less than $750,000 in farm assets. And those with farm assets of at least $3 million had total income volatility that was 59 percent greater than that of other farm households. Total household income is more volatile on larger farms mainly because these farms derive a greater share of their total income from the farm.
Among all farm types, the volatility of total income is substantially lower if the principal farm operator has more education. Operators that graduated from high school had income volatility that was 11 percent lower than operators who did not graduate from high school. And operators with a college degree had total household income volatility that was 19 percent lower than those who did not graduate from high school. A contributing factor to the negative correlation between education and income volatility may be that the survey period spanned the Great Recession—a time in which less-educated workers faced larger increases in unemployment than better educated workers.
Operators who reported farming as their primary occupation had income volatility that was 63 percent higher than operators who did not farm full time. Full-time operators are likely to derive more of their total earnings from farm income, which is more variable than off-farm income. Being married for both survey years is associated with a 23-percent decrease in total household-income volatility. Compared with single farm operators, married couples operating a farm likely earn a larger share of household income from less volatile off-farm sources, which reduces total income variability.
Income volatility has declined over time
The model results also indicate that the volatility of total farm household income declined 1.2 percent per year over the study period. Several factors may account for the decline. It may be that recently adopted farming technologies and practices (e.g., genetically engineered crops, no-till farming, global positioning system technologies, precision agriculture) have reduced variations in crop yields. Farm income volatility may also have moderated because of changes in risk management by farmers, including a greater reliance on contracting (the value of production under contract increased roughly 10 percentage points between 1991 and 2007). The expansion in risk mitigation programs, and Federal crop insurance in particular, may have contributed to the decline in income volatility. Acres enrolled beyond the most basic catastrophic coverage level increased from 117 million acres in 1996 to 280 million acres in 2013, and Federal subsidies to purchase insurance increased from $720 million to $6.6 billion in constant 2009 dollars over the same period.
This article is drawn from:
- Key, N., Prager, D. & Burns, C. (2017). Farm Household Income Volatility: An Analysis Using Panel Data From a National Survey. U.S. Department of Agriculture, Economic Research Service. ERR-226.