
A Primer on Land Use in the United States
- by Daniel Bigelow
- 12/4/2017
Land use and land-use change have important economic and environmental implications for commodity production and trade, soil and water conservation, and other policy issues. Changes in land use occur for various reasons, and some changes are less reversible than others. Commodity prices, environmental factors, Government policies and programs, and population growth can affect land-use decisions by influencing the relative economic returns to different uses.
Although land-use decisions are typically made by landowners at the level of individual plots (or parcels), a consistent series of aggregate statistics over time is useful for benchmarking broader shifts and trends. The ERS Major Land Uses (MLU) series is the longest running, most comprehensive accounting of all major uses of public and private land in the United States. The series was started in 1945 and has since been published about every 5 years using the latest data from the USDA National Agricultural Statistics Service’s Census of Agriculture.
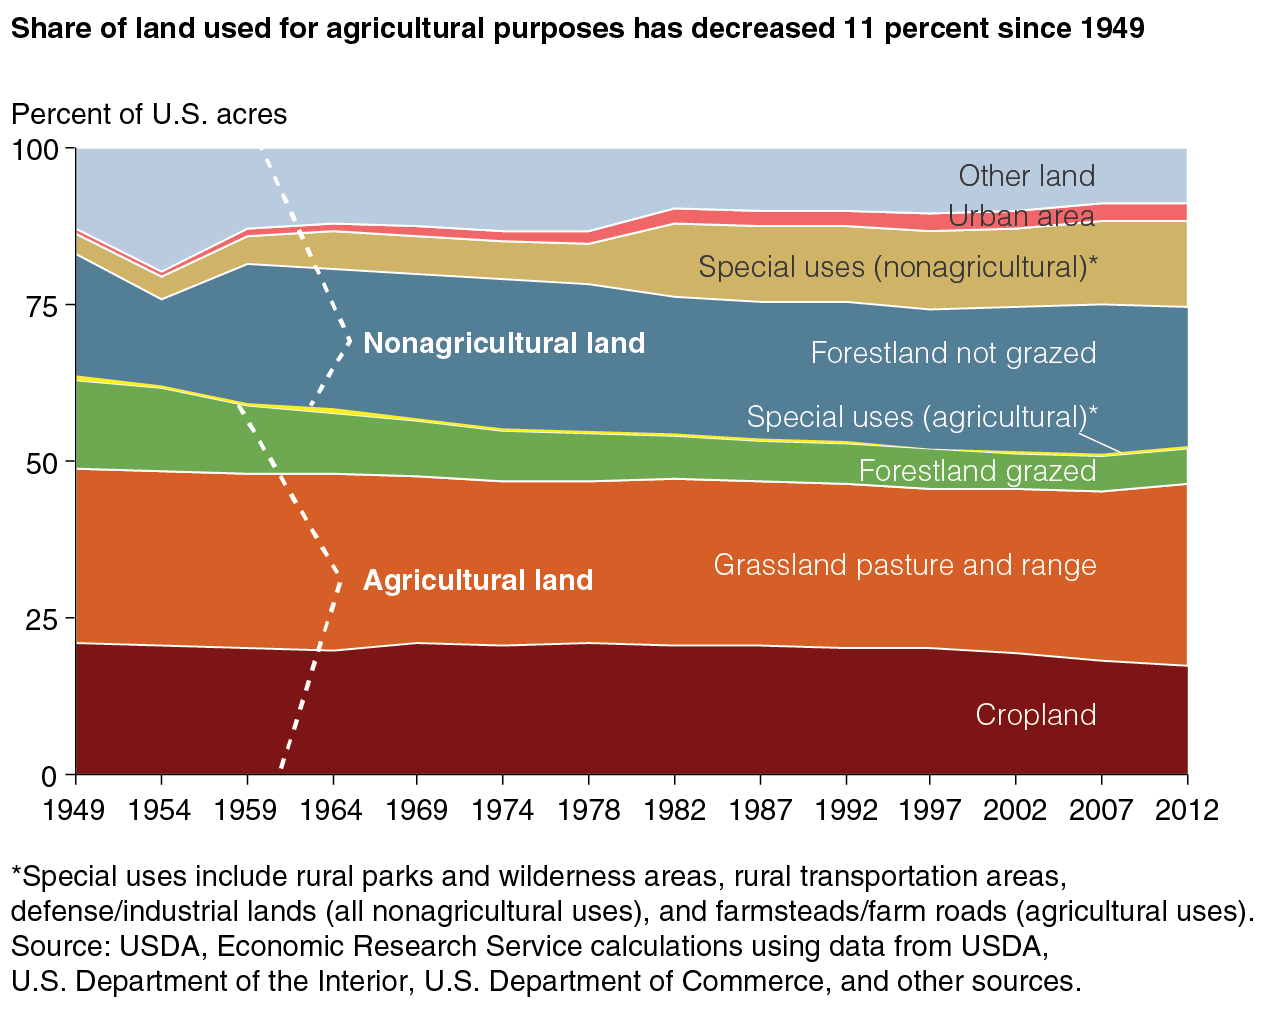
The Mix of Land Uses Has Exhibited Some Changes in Recent Years
The U.S. land area totals just under 2.3 billion acres. Agricultural land use has become less common over time, declining from 63 percent in 1949 to 52 percent in 2012 (the latest data available). Gradual declines have occurred in cropland, while grazed forestland has decreased more rapidly. In 2012, 392 million acres of agricultural land were in cropland (18 percent less than in 1949); 655 million acres were in pasture and range (4 percent more); 130 million acres were in grazed forestland (59 percent less); and 8 million acres were in farmsteads and farm roads (45 percent less).
Nonagricultural land uses include ungrazed forest-use land, nonagricultural special uses, urban land, and miscellaneous other categories that are not separately inventoried (wetlands, rural residential, mining areas, etc.). Increases in land used for nonagricultural special uses, which include national parks and other protected areas, have contributed to the relative increase in nonagricultural land use over time. Urban land, which represents a relatively small share of the U.S. land base, has nearly tripled in area since 1949 to accommodate economic and population growth.
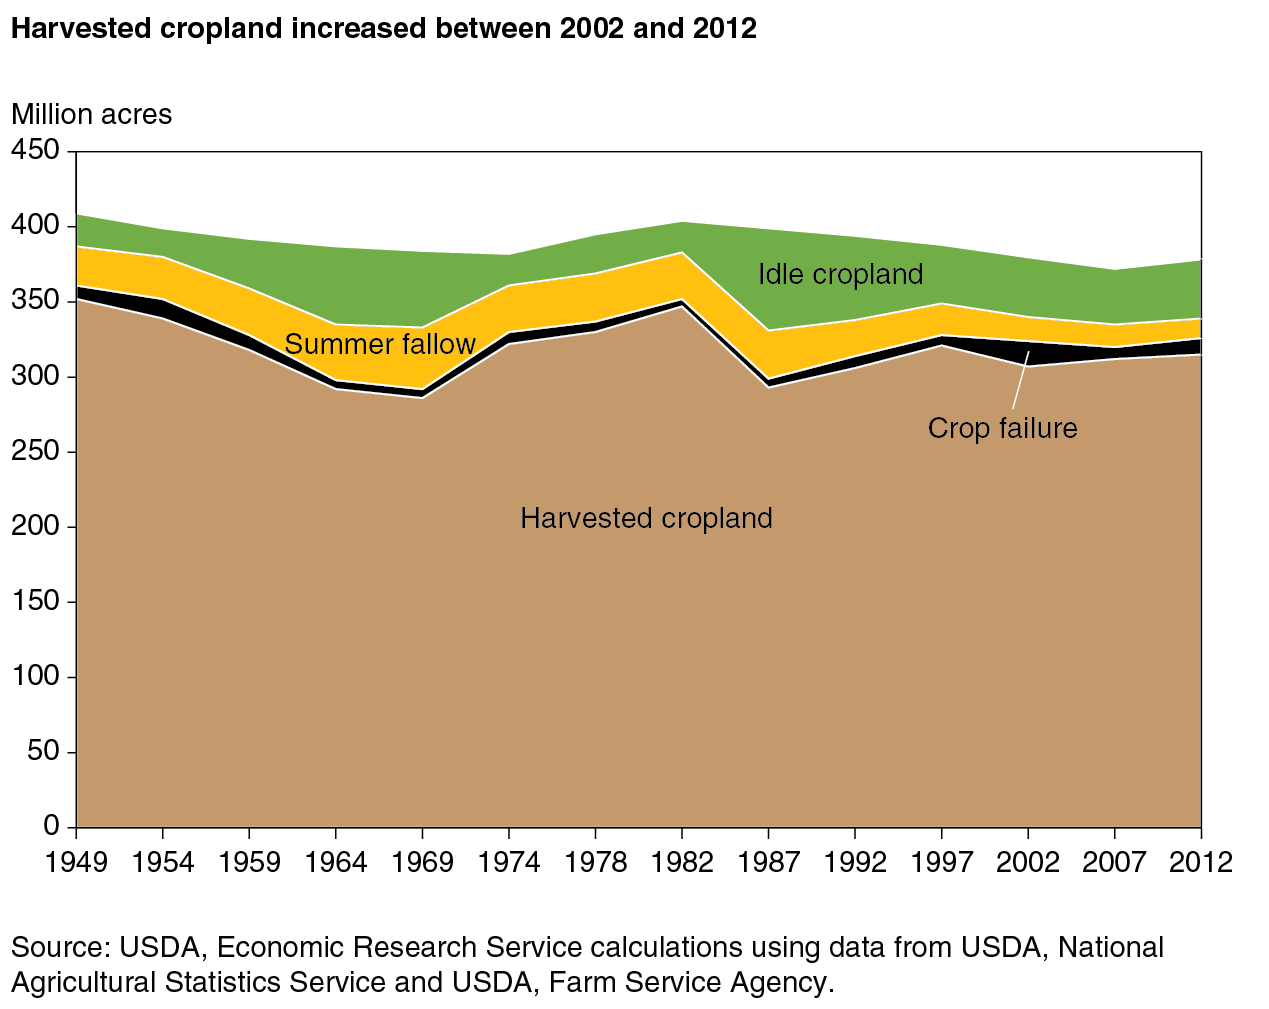
A variety of factors—such as commodity prices, weather, changes in technology, and Government programs—affect how cropland is used. Between 2002 and 2012, a combination of high commodity prices and drought conditions influenced trends in cropland use. Cropland harvested, which accounts for the majority of cropland use, increased by 8 million acres. Rising commodity prices for corn and soybeans, in particular, contributed to the increase by incentivizing farmers to plant additional acres of these commodities.
In addition, droughts in several major crop-producing regions resulted in above-average failed cropland acreage, reaching 17 million acres in 2002 and 13 million acres in 2011. Idled cropland, a majority of which is enrolled in the Conservation Reserve Program (CRP), also increased during the most recent droughts despite a reduction in land enrolled in the CRP. This suggests that some farmers voluntarily removed land from crop production because of poor growing conditions or constrained irrigation water supplies. Land used for summer fallow declined by 3 million acres in recent years, partially due to increased adoption of moisture-conserving production practices such as no-till and mulch-till.
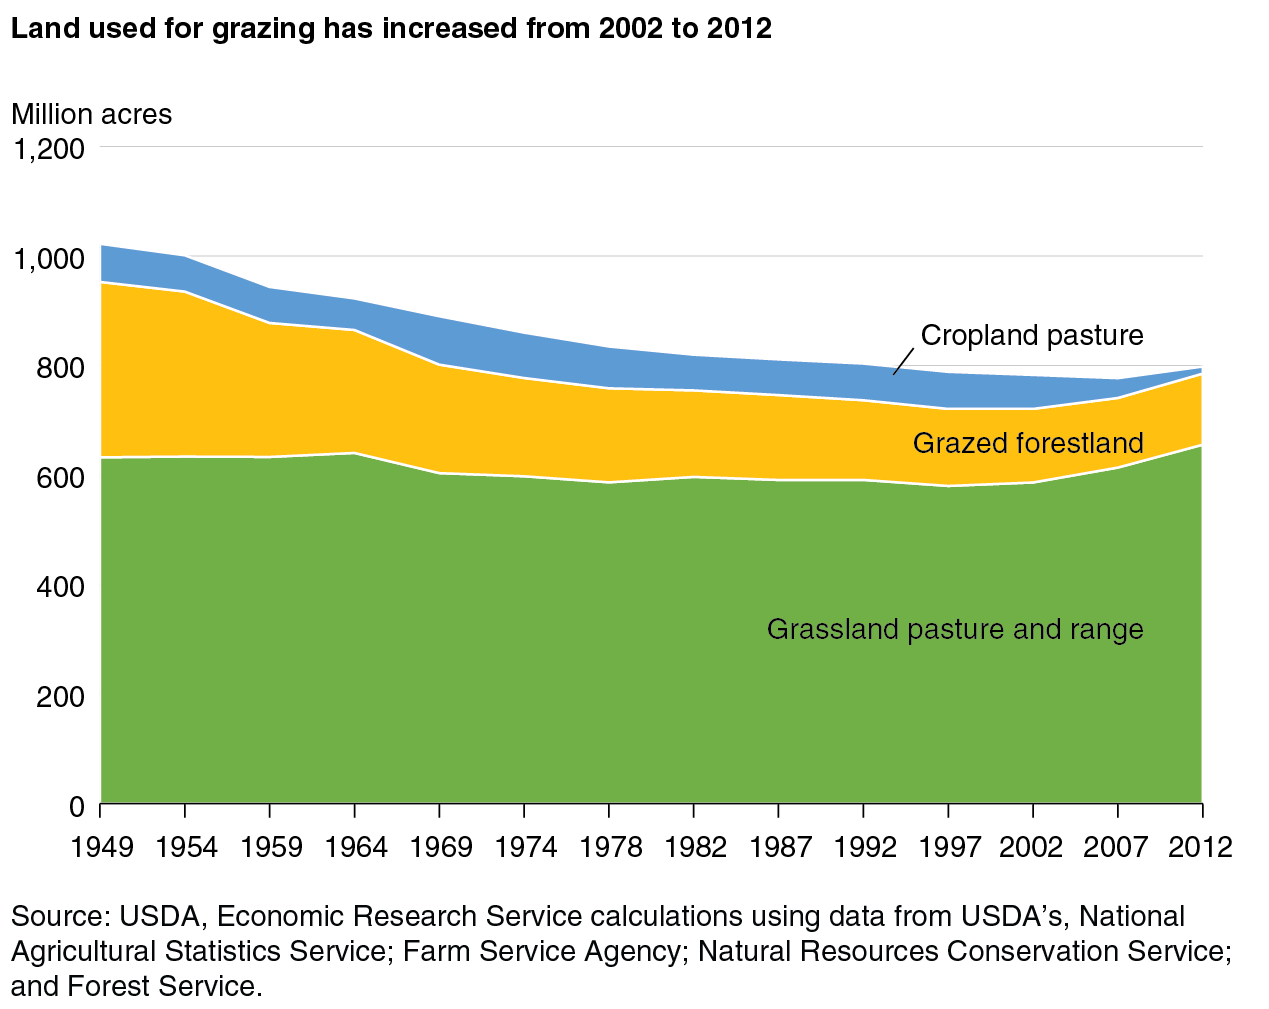
Land used for grazing purposes—comprised of permanent grassland pasture and range, grazed forest-use land, and cropland pasture—has exhibited a long-term decline since 1949. However, between 2002 and 2012, total grazing land increased by 15 million acres. While cropland pasture declined substantially in the most recent 10-year period, this decline was more than offset by a corresponding uptick in permanent pasture. These changes were largely a result of a reclassification of most land formerly labeled as cropland pasture resulting from changes in the 2007 and 2012 Census of Agriculture questionnaire. The vast majority of grazing land is in permanent grassland pasture and range use and, aside from the recent uptick, the acreage of land in this category remained relatively stable at 587-604 million acres between 1969 and 2002. As forests have been cleared from farmland, a long-term decline in grazed forestland of 186 million acres has taken place since the start of the MLU series. Between 2002 and 2012, grazed forest-use land exhibited a small decline of 4 million acres.
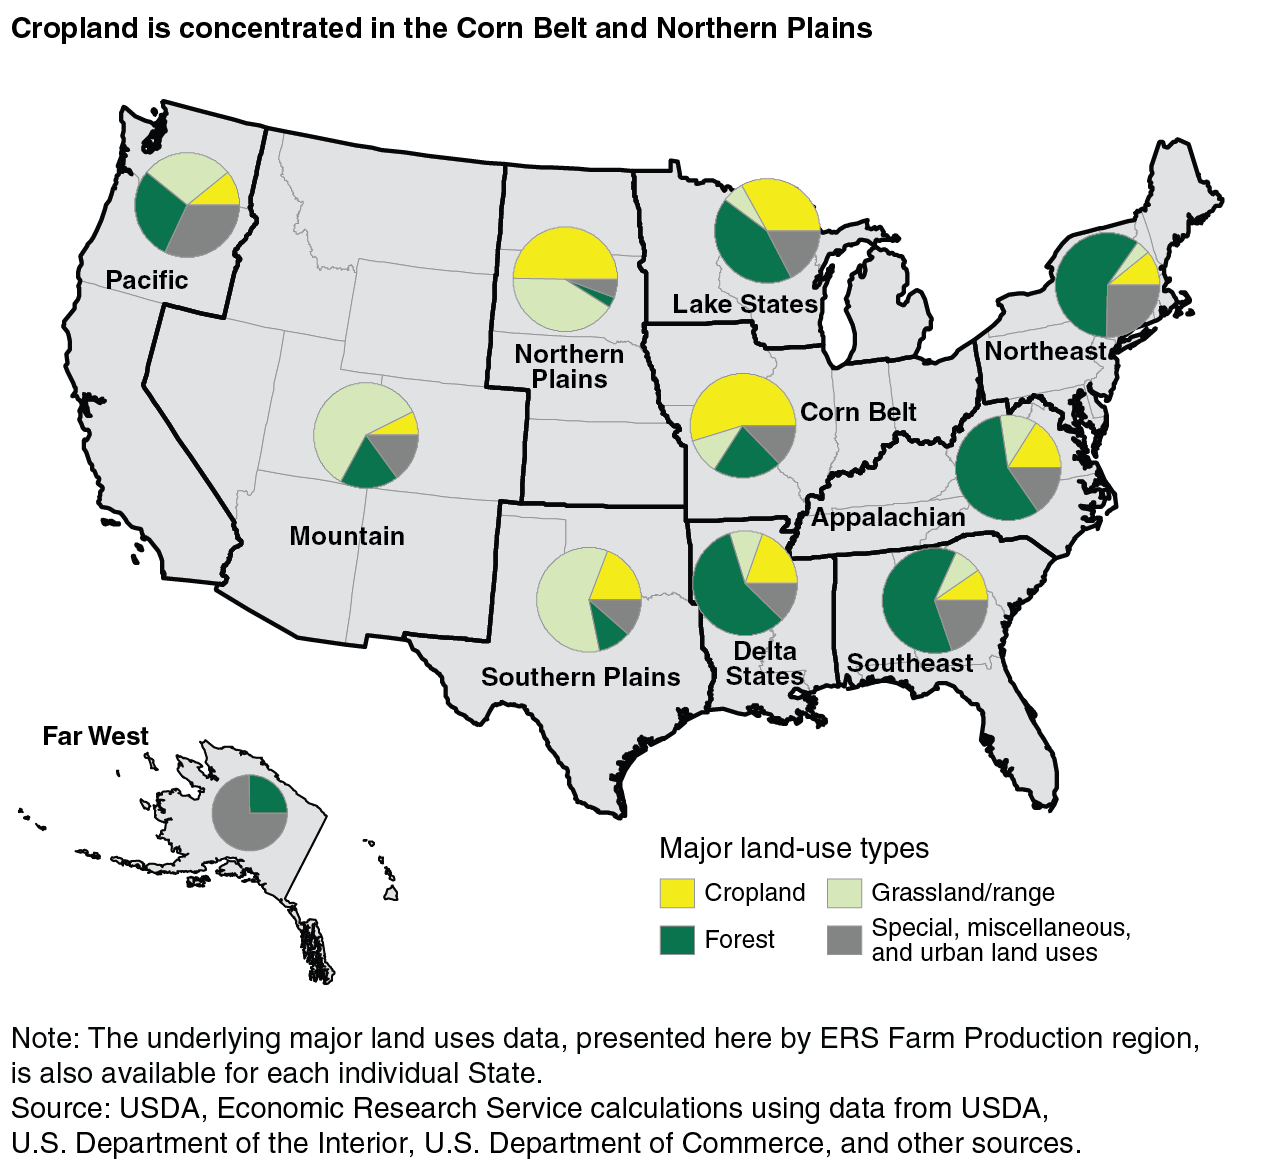
The distribution of both agricultural and non-agricultural land uses varies substantially across the country based on factors such as soil, climate, and Federal and local policies and programs. Cropland is concentrated in the Corn Belt and Northern Plains regions, where several States (including Iowa, Kansas, and Illinois) have more than half of their land base devoted to cropland. Grassland pasture and range accounted for a large share of land in the Mountain (60 percent) and Southern Plains (59 percent) regions. Forest-use land is mainly found along the eastern seaboard in the Southeast (62 percent), Northeast (59 percent), Delta States (58 percent), and Appalachia (57 percent) regions.
Urban land is most prevalent in the Northeast, where several States have urban shares of roughly 40 percent (New Jersey, Rhode Island, Massachusetts, and Connecticut). Although urban land use makes up a small fraction of the land base (3 percent), it has continually increased over time in response to population and economic growth. Increases in urban land are often offset by declines in undeveloped rural land (e.g., cropland, pasture/range, and forestland). Land-use changes between undeveloped categories are generally reversible—but, once developed, urban land rarely reverts back to an undeveloped use. The National Resources Inventory reveals most new land development between 2007 and 2012 took place on land that was formerly in forestland and cropland uses.
This article is drawn from:
- Bigelow, D. & Borchers, A. (2017). Major Uses of Land in the United States, 2012. U.S. Department of Agriculture, Economic Research Service. EIB-178.
- National Resources Inventory: 2012 Annual Data. (2017). USDA, Natural Resources Conservation Service.
You may also like:
- Hellerstein, D., Hitaj, C., Smith, D. & Davis, A. (2017). Land Use, Land Cover, and Pollinator Health: A Review and Trend Analysis. U.S. Department of Agriculture, Economic Research Service. ERR-232.
- Marshall, E., Aillery, M., Malcolm, S. & Williams, R. (2015). Climate Change, Water Scarcity, and Adaptation in the U.S. Fieldcrop Sector. U.S. Department of Agriculture, Economic Research Service. ERR-201.
- Beckman, J., Borchers, A. & Jones, C. (2013). Agriculture's Supply and Demand for Energy and Energy Products. U.S. Department of Agriculture, Economic Research Service. EIB-112.