Examining Farm Sector and Farm Household Income
- by Daniel Prager, Christopher Burns and Nigel Key
- 8/7/2017
Highlights
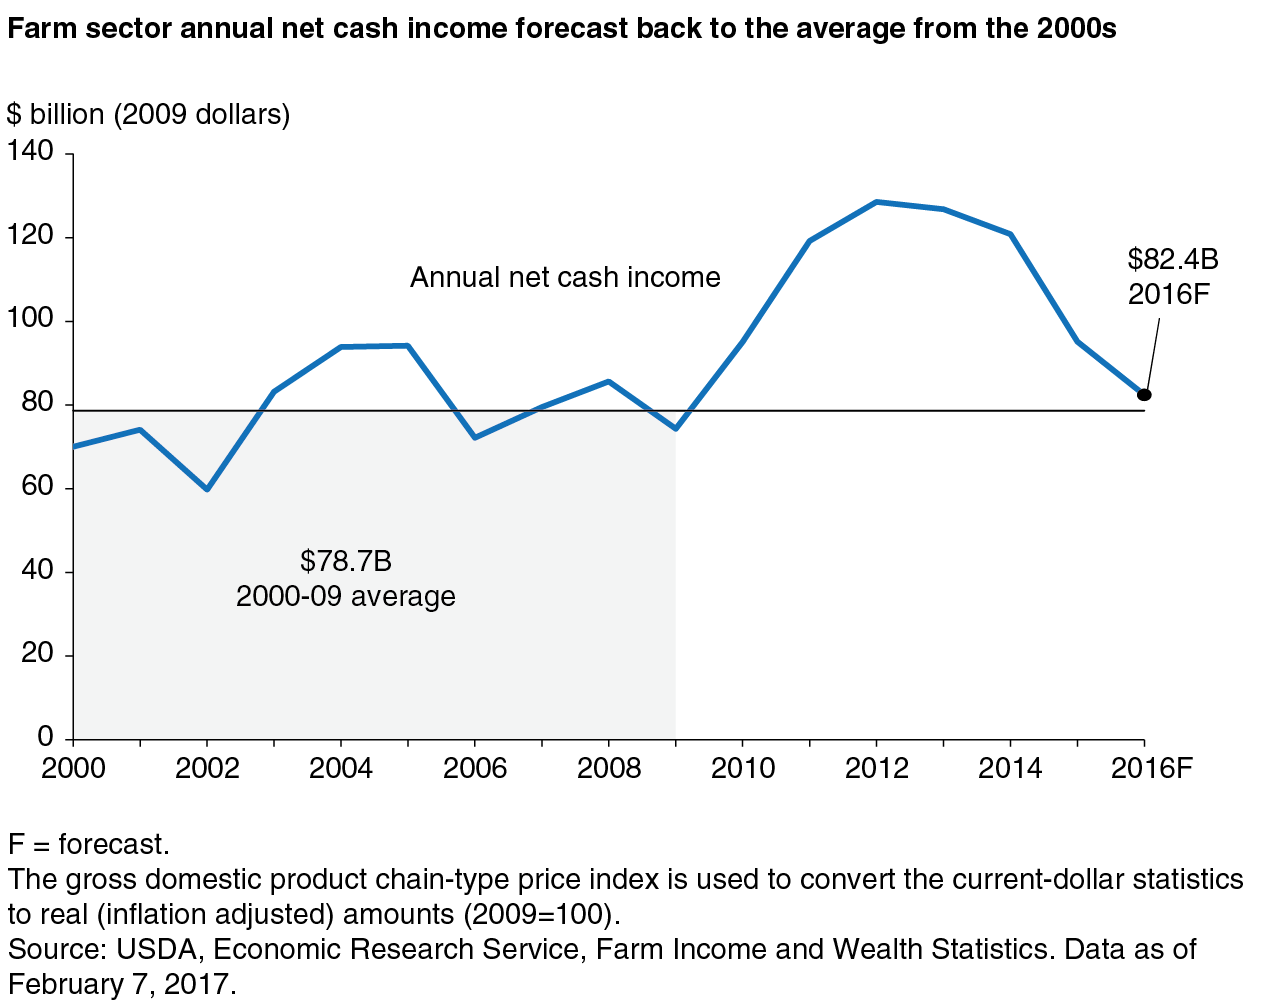
- Farm sector net cash income is expected to decline 35 percent between 2013 and 2016, following several years of record highs—though it will remain near its recent 10-year average.
- Starting in the late 1990s, the median household income for farm households has exceeded the median income of all U.S. households; in 2015, farm households had a median total household income of $76,735, a third greater than that of all U.S. households but less than that of U.S. households with a self-employed head.
- Federal Government payments—including disaster assistance programs and commodity program payments—are expected to be about $13 billion in 2016, and buffer swings in farm income.
The U.S. farm sector represents about 2.1 million farms. Together, these farms operate more than 900 million acres and support more than 6 million people living in the associated farm households. This article discusses the long-term trends in farm sector and farm household income, and includes estimates for 2016. (As of the publication date, ERS does not yet have all the data relevant to 2016 farm activity; until that data are available in late 2017, ERS is “forecasting” 2016 net cash farm income.)
Assessing the financial well-being of the farm sector as a whole can be challenging due to the diversity of farms that make up the sector. Farms vary by location, size, commodities produced, and many other characteristics. For that reason, trends for the farm sector can differ from trends experienced on individual farms. This article takes a long-term perspective, and examines net cash income as an indicator of farm profitability, reviewing recent trends and the major factors contributing to them.
Farm Sector Net Cash Income Down in 2015 and 2016 From Record Highs
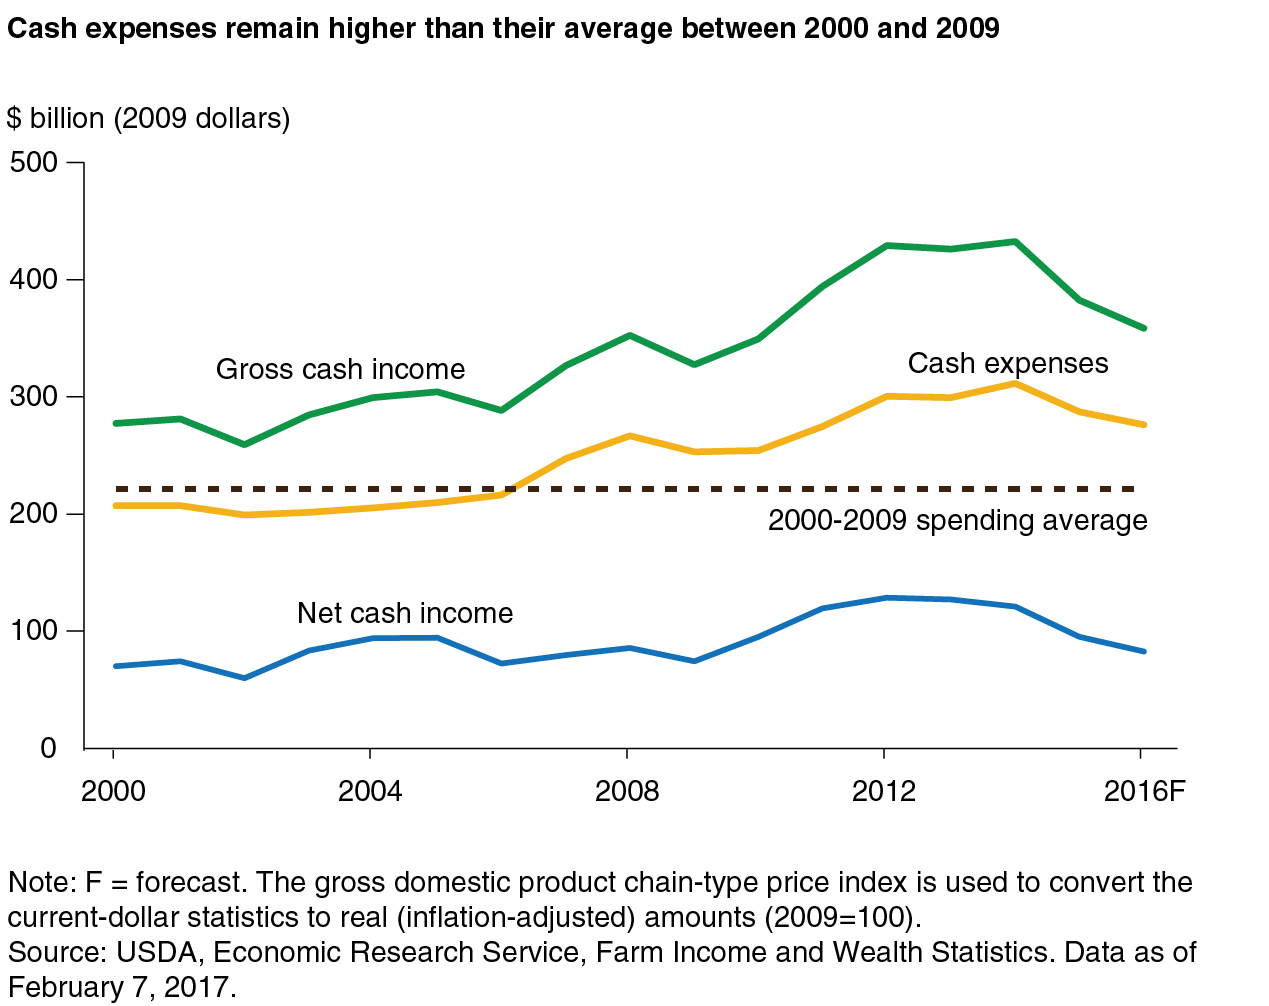
Farm sector net cash income is equal to all of the farm and farm-related revenue received (gross cash income) minus any cash expenses paid during the year. Net cash income for the farm sector was relatively stable through the 2000s. But, since 2009, the U.S. farm sector has experienced more volatility.
Beginning in 2010, farm sector net cash income rose to record highs, peaking in 2012 and 2013. Factors affecting both the demand and supply for agricultural commodities led to this growth. Demand for corn and other grains and oilseeds increased with implementation of Federal bioenergy policies; corn is the primary feedstock for ethanol production. High overall demand for agricultural commodities, alongside high prices, and a resulting increase in U.S. agricultural exports by more than $45 billion contributed to a $61-billion rise in the sector’s net cash income from 2009 to 2013. Global markets and trade expanded greatly due to strong income growth in developing countries. For example, U.S. soybean exports rose steadily from 2011 to 2015—growing over 50 percent during that period—with China accounting for the majority of U.S. exports each year.
Changes to the supply of commodities also drove up prices and, consequently, net cash income. A drought affected the Midwest and Great Plains in 2012, significantly reducing yields for corn and soybeans—and raised prices. More than three-quarters of the domestic cattle inventory was located in drought areas at the height of the 2012 dry spell, as was more than two-thirds of U.S. production and hay acreage. Commodity prices rose to reflect scarcity, benefiting crop farms in regions that did not experience production disruptions—while crop insurance indemnity and disaster assistance aided farms who experienced losses. As a result, farm sector net cash income was actually higher.
Following this period of elevated prices and record high earnings, U.S. farm sector net cash income has fallen sharply. During the 2016 growing season, increased plantings, combined with unseasonably good weather, led to record production and added to large stocks on hand for many major commodities due to multiple consecutive years of high production levels. Slowing global demand, a strengthening dollar, and large inventories depressed crop as well as animal and animal product prices and is expected to contribute to the decline in 2016 net cash income for the farm sector.
After adjusting for inflation, the decline in net cash income from 2013 to the ERS forecast for 2016 would be the largest decline since the 1980s in both absolute ($44 billion) and percentage (35 percent) terms. Prices received by farmers for all major commodities are lower, with many (such as corn, wheat, and milk) down 30 percent or more from highs recorded just a few years earlier. The recent declines in net cash income for the farm sector are large in percentage terms. But, when viewed over a longer time horizon and after adjusting for inflation, net cash income is forecast to return to the levels observed before this record growth. In 2016, net cash income is forecast nearly $4 billion (or about 5 percent) higher than the average net cash income from 2000 to 2009.
Farm expenses followed a similar trend to farm income, often with a lag. Farm sector income peaked between 2012 and 2013, but the highest spending levels didn’t occur until 2014—and have come down only marginally since. Farm expenses decreased substantially in 2015 in response to declining revenues, but they still remain about $50 billion (over 20 percent) higher than their average between 2000 and 2009. And while fertilizer, energy, and feed have all declined relative to the 2014 peak, other costs have continued to rise—including labor and interest costs.
Farm Income for Individual Farms Often Varies More Than for the Farm Sector
While the previous discussion focused on examples of drivers of year-to-year income shifts at the sector level, year-to-year changes that occur on individual farms can be even greater (or smaller). In any given year, the income earned by an individual farm varies based on many factors, including rotations and yields, commodity prices, the cost of inputs, and Government payments received. Annual decisions about other sources of farm-related income—such as renting out land; the sale of hunting, grazing, or energy rights; and selling commodities from inventory—can also contribute to this variation.
These fluctuations in farm income present challenges to farm businesses and directly affect the financial well-being of farm households. When income from farming is high, farmers are more likely to have the financial resources to invest in new farm equipment or land. When income is low, farmers may find it more difficult to repay debts, invest in their business, or obtain credit. For many farm households, fluctuations in farm income can affect household expenditures. Farmers may try to cope with downturns in farm income by liquidating their assets, borrowing money, delaying purchases (thus reducing spending), or working more off-farm.
Nearly 99 percent of farms are family farms. For most farms, total household income includes income from both farm and off-farm sources. According to the 2012 Agricultural Census, there are roughly 6.5 million farmers and families who live in farm households and depend on farming for a portion of their total household income. Income from farming is defined as the household’s share of net cash income from the farm and includes farm wages to the operator or other household members and income from renting farmland. Off-farm income is largely comprised of wages and salaries earned by household members working in other occupations. Off-farm income also includes income from operating other businesses; interest and dividends from investments; transfer payments, such as pensions and unemployment benefits; and gifts or bequests.
Over the past 25 years, total household income on a typical farm has increased steadily with median total household income for farm households outpacing the median income of all U.S. households starting in the late 1990s. In 2015, farm households had a median total household income of $76,735, a third greater than that of all U.S. households ($56,516), though less than the median income of all U.S. households with a self-employed head ($78,400 in 2013).
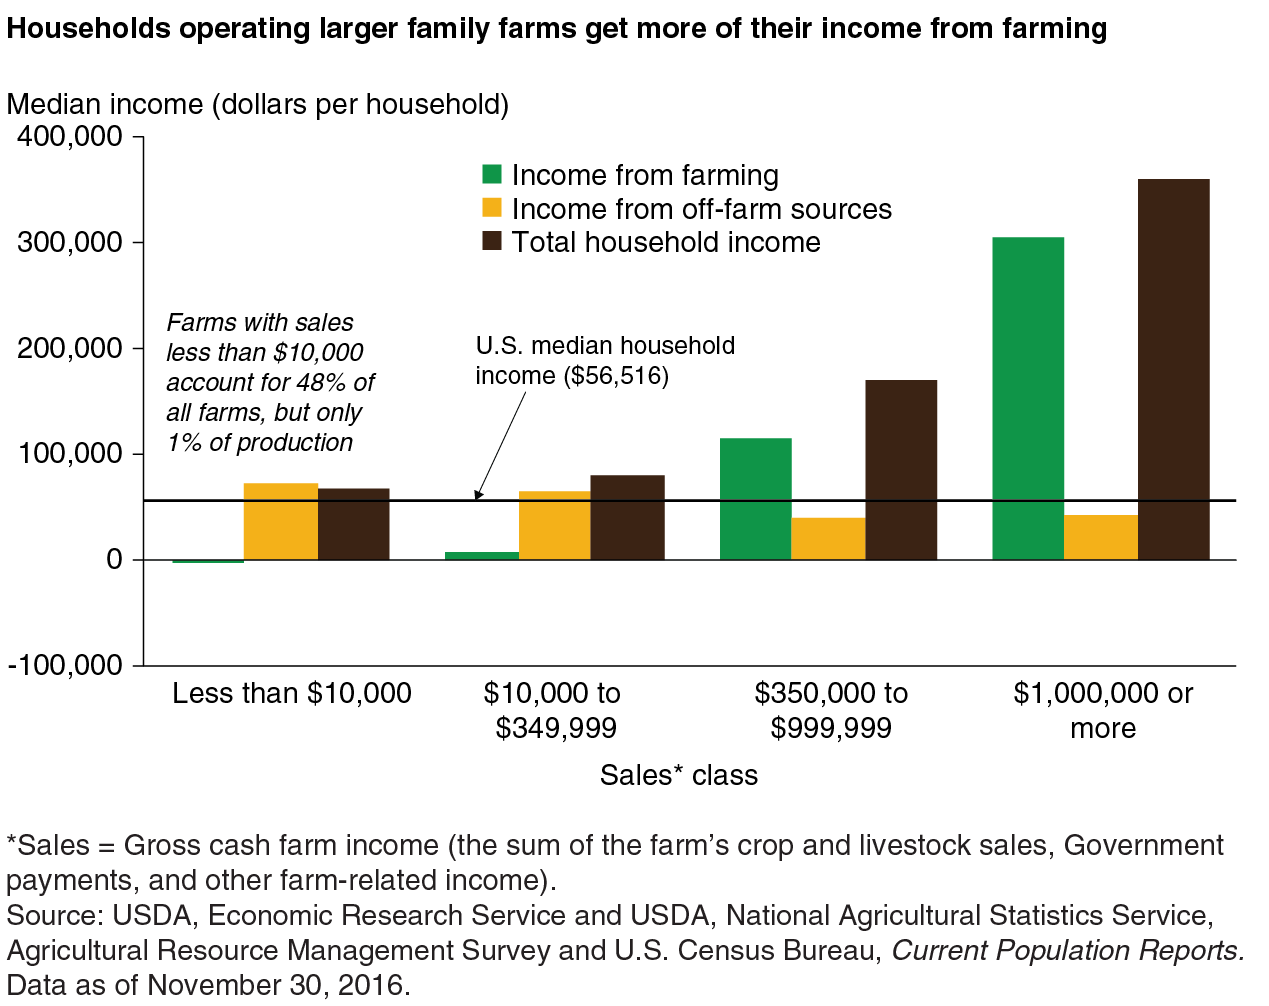
However, a household’s income from farming can vary much more than the total household income. Gross cash farm income (GCFI) is a common way to categorize farm size and represents income—such as cash sales and government payments—before any expenses are subtracted out. More than half of households operating small farms (GCFI less than $350,000) typically incur small losses from farming. Small family farms account for 90 percent of U.S. farms, but only contribute about a quarter of the value of production. The majority of their total household income comes from off-farm sources.
As the size of the farm increases, off-farm income represents a smaller share of total household income. Households operating farms with a Gross Cash Farm Income (GCFI) of $350,000 and above (before expenses), earn the majority of their total household income from the farm operation. Households operating the largest farms (GCFI of $1 million or more, before expenses) had the highest total household incomes, reaching over $361,000 at the median in 2015.
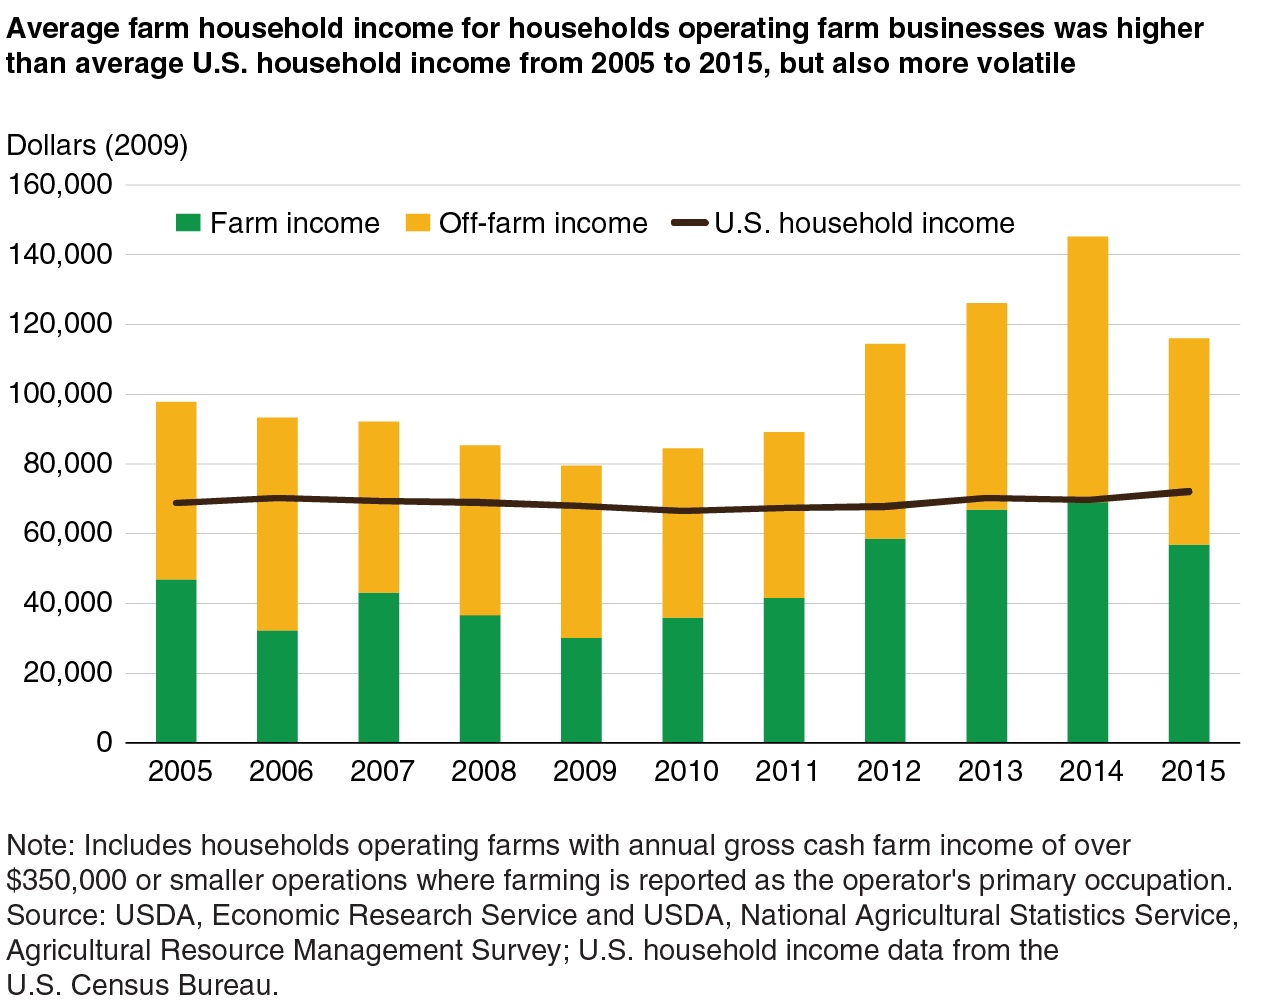
Although large farms can be highly profitable in a single year and in aggregate, roughly one in six large farms lose money in any given year. Most income volatility for these farms comes from the farm operation. Farm businesses account for two-fifths of farm operations and for more than 90 percent of the agricultural production in the United States. These businesses include larger farm operations with annual gross cash farm income of over $350,000 before expenses (23 percent of farm businesses) and smaller operations where farming is reported as the operator’s primary occupation (77 percent).
In general, households operating farm businesses tend to have higher levels of income volatility. Their average household income (using 2009 dollars to adjust for inflation) has grown from just under $80,000 in 2003 to nearly $120,000 in 2015. For these households, income from farming typically constitutes one-third to one-half of their total household income. The figure below shows that while average household income for these farm households has exceeded average U.S. household income over this period, it has been considerably more volatile—peaking in 2014, before dropping by approximately one-fifth the following year.
Farm households can plan for and adapt to these changes. Many households save during good years and can thereby withstand small or negative operating profits. Households can also adjust their farm or off-farm expenses when they expect revenues might decline. A majority of farm households have at least one member who works off-farm, which can stabilize total household income when income from farming is low.
The results from an analysis of a subset of farms surveyed more than once between 1996 and 2013 show the considerable variability experienced by an individual farm household. Roughly one-third of farm households earning between $75,000 and $125,000 on average had their incomes fluctuate from 1 year to the next by less than $50,000 in either direction. Another 40 percent of these farm households gained or lost more than $50,000 but less than $250,000 the following survey year. The remaining farm households saw their total household incomes change by more than $250,000. This volatility is similar to the volatility of income from nonfarm self-employment.
Agricultural Programs Buffer Farmers From Potential Weather and Price-Related Declines in Individual and Farm Sector Incomes
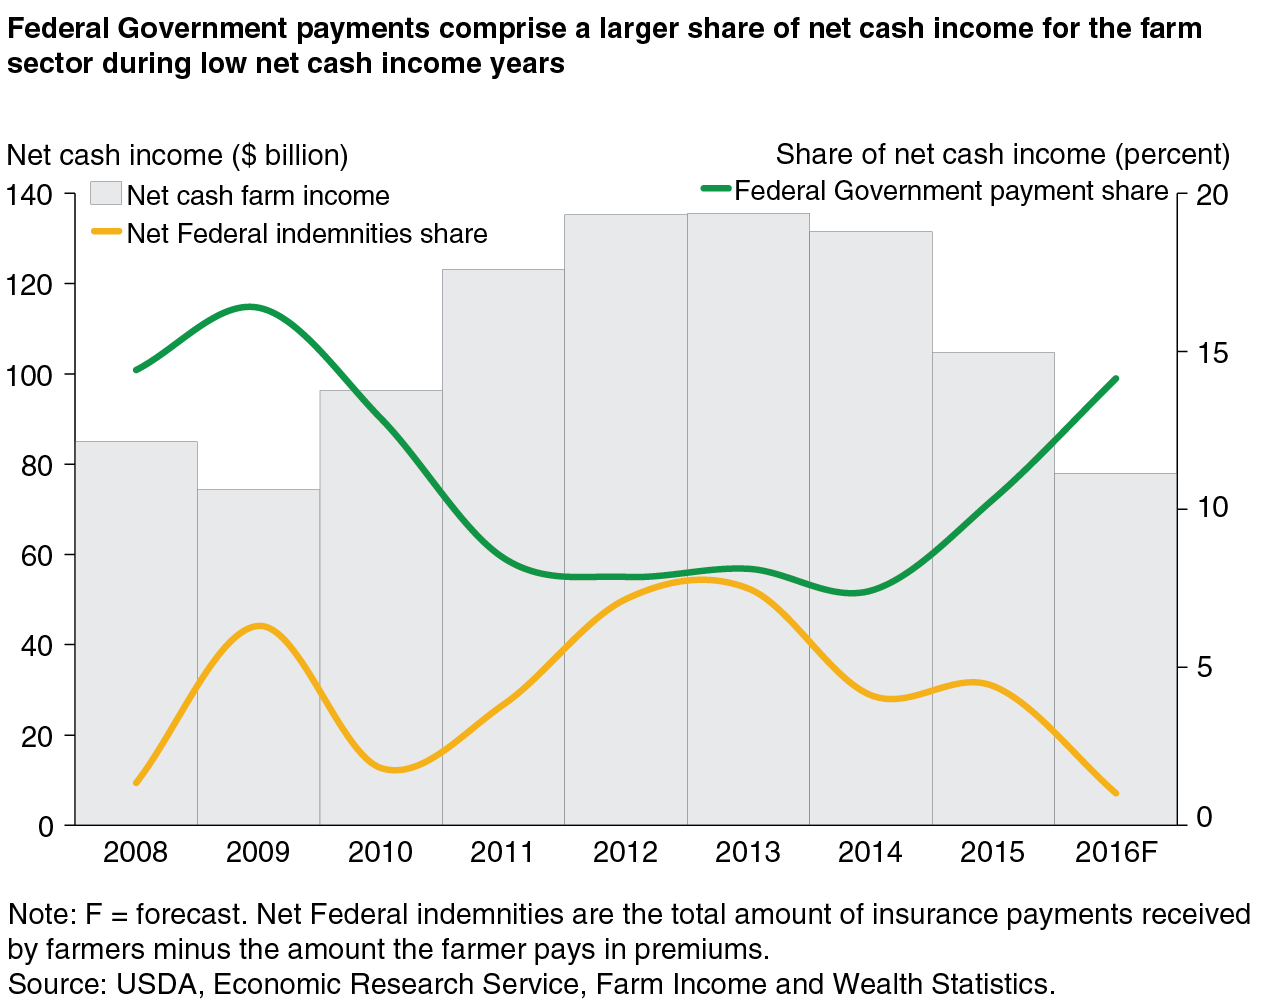
Federal agricultural policies, such as disaster assistance programs and commodity payments that fluctuate with agricultural prices or yields, reduce potential down-side risks to farm income. By design, Federal Government payments to farmers are counter-cyclical, contributing a greater share of net cash income during lower income years and a smaller share in higher income years. In total, Federal Government payments to farmers are forecast at about $13 billion in 2016.
In addition, a wide range of insurance policies are available to farmers with premiums partially subsidized by the Government. This insurance assists farmers with disruptions related to weather, yield, or revenue. Farmers pay a portion (typically less than 40 percent) of the insurance premium payments. The difference between the amount the farmer pays in insurance premiums and the amount received is called net Federal insurance indemnities. In 2016, farmers received net Federal insurance indemnities of less than $2 billion, but in 2013 received as much as $10 billion due primarily to losses incurred during the 2012 drought.
Over the past 10 years, annual swings in the share of Federal farm payments have tended to be offset by counter-cyclical swings in net Federal indemnities. Combined, Federal Government commodity program and disaster payments and net Federal insurance indemnities typically represent 15-20 percent of annual net cash income for the farm sector. This offsetting influence reflects complex interactions of weather-related price and yield shocks.
This article is drawn from:
- Farm Income and Wealth Statistics. (n.d.). U.S. Department of Agriculture, Economic Research Service.
- Key, N., Prager, D. & Burns, C. (2017). Farm Household Income Volatility: An Analysis Using Panel Data From a National Survey. U.S. Department of Agriculture, Economic Research Service. ERR-226.
You may also like:
- Foreign Agricultural Trade of the United States (FATUS). (n.d.). U.S. Department of Agriculture, Economic Research Service.
- 2014 Farm Bill. (n.d.). U.S. Department of Agriculture, Economic Research Service.


