
Illuminating SNAP Performance Using the Power of Administrative Data
- by Mark Prell
- 11/7/2016
Highlights
- Micro-level administrative data on participation, duration, and amounts of benefits received can enhance policy-relevant analyses of government programs.
- ERS developed the Next-Generation Data Platform, in partnership with USDA’s Food and Nutrition Service and the Census Bureau, to link SNAP administrative data to Federal survey data.
- Three recent ERS studies demonstrate how this linked data can be used to illuminate SNAP performance issues, such as effectiveness in reaching those most in need.
Alexander Hamilton, as the first U.S. Secretary of the Treasury, was responsible for collecting customs duties on imports—the predominant source of Federal revenue for the new republic. Hamilton biographer Ron Chernow writes, “Hamilton’s appetite for information was bottomless. To his port wardens, he made minute inquiries about their lighthouses, beacons, and buoys. He asked customs collectors for ship manifests so he could ascertain the exact quantity and nature of cargo being exported. The whole statistical basis of government took shape under his command.”
In Hamilton’s time, data collection and tabulations were done by hand using quill and ink. Today, program evaluation, cost-benefit analysis, and sophisticated modeling techniques use advanced computers churning through millions of records. Yet, what was true then remains true today: government data collection and statistics are critical to inform public and private decisionmaking and to sustain analyses and public debate on government programs and policies.
An area of policy analysis receiving growing attention is the role of administrative data—the official records of a government program—in answering questions about a program’s impacts. Administrative data contain complete and reliable information on who participates in a program, how long he or she participated, and the amount of benefits received. In addition, because administrative data have already been collected to operate the program, a re-use of the data for statistical purposes does not incur the cost of launching a new survey to collect comparable data. Linking administrative data with data from large, nationally representative Federal surveys leverages the strengths of the two data sources, gaining results that could not be obtained using either source separately.
To harness the power of administrative data, ERS developed the Next-Generation Data Platform in partnership with USDA’s Food and Nutrition Service (FNS) and the U.S. Census Bureau. This joint project is a long-term effort to acquire State-level administrative data for USDA food and nutrition assistance programs and leverage those data through linkages to Census Bureau surveys and other administrative files such as unemployment insurance records and veterans’ records. Three initial studies conducted by ERS used the linked data to assess the performance of USDA’s Supplemental Nutrition Assistance Program (SNAP), providing novel insights for policymakers and the public.
Pros and Cons of Data Sources
For the most part, researchers use large, nationally representative Federal surveys as sources for the data needed to look at many facets of government programs and policies. Surveys are useful because they collect a wealth of socioeconomic data—income, age, years of schooling, race/ethnicity, and more—on both program participants and nonparticipants. Such data can be used, for example, to examine how food-spending patterns differ between those who participate in a program and those who do not. But in other ways these data fall short. Households can misreport, even if by poor recall, information of their program participation.
Administrative data—the official records of the program—contain complete and reliable information on who participates and the duration and amount of benefits received. However, the data contain only the information necessary to operate the program. They typically provide little if any information on many socioeconomic variables that can be important for research, such as a participant’s level of education or annual income and race/ethnicity. And the data provide no information at all on people who did not participate in the program. Using a linked, or matched, dataset that combines survey data and administrative records can overcome the limitations of each when used separately.
| Strengths | Limitations |
|---|---|
| Large Federal surveys | |
| Include SNAP participants and non-participants in sample | Households underreport SNAP participation and benefits |
| Include a rich set of socioeconomic data | May lack information on SNAP duration and benefits |
| Include data on food security, health, and other outcomes | |
| Administrative data (State SNAP records) | |
| Include all SNAP participants, rather than just a sample | Exclude non-participants |
| Reliable detail on SNAP duration and benefits each month | Include only data needed to operate SNAP |
| Already collected | No data on food security, health, and other outcomes |
States Are Benefiting From Innovative Research on SNAP
SNAP is the largest of USDA’s food and nutrition assistance programs. About 46 million people participated in the program in an average month in 2015 at a cost of about $74 billion for the year. A key performance metric of SNAP’s effectiveness in reaching its target population is the participation rate—the number of people participating in SNAP as a share of the number of people estimated to be eligible to participate. As a means-tested program, SNAP requires that people have incomes below designated limits to be eligible for benefits. Not everyone who is eligible is aware of the program, and if the person is aware, he or she may not choose to participate.
FNS, the USDA agency that administers SNAP, publishes an annual report on national and State-level estimates of participation rates. To produce more detailed estimates within a State requires vast quantities of localized data that have previously not been available for analysis. Intra-State estimates would be useful as States decide where to focus efforts and expenditures on providing information about SNAP, including how to apply. Such estimates would also be helpful in assessing administrative performance in local areas and in guiding administrative policies and procedures.
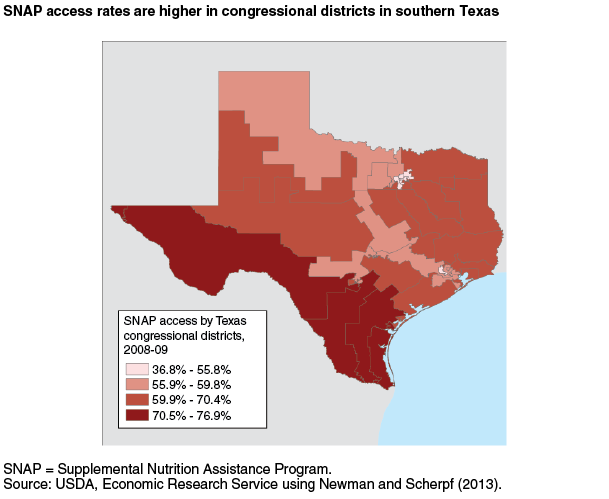
In a 2013 study, ERS researchers developed a new measure called a SNAP access rate. This rate is defined as the number of people who participate in SNAP, based on administrative records, compared to the number estimated to be eligible based on survey data. The researchers linked millions of records extracted from Texas SNAP administrative data to data in the Census Bureau’s American Community Survey (ACS) for Texas. Specifically, they used ACS data on annual income, citizenship, household composition, and other variables to model who is eligible for SNAP. The researchers used the linked data to calculate the access rate—the share of estimated eligibles that participate in the program. For Texas as a whole, the estimated 2008-09 SNAP access rate was 62.8 percent; intra-State access rates ranged from 36.8 to 76.9 percent across Texas congressional districts and from 45.7 to 78.2 percent across large counties.
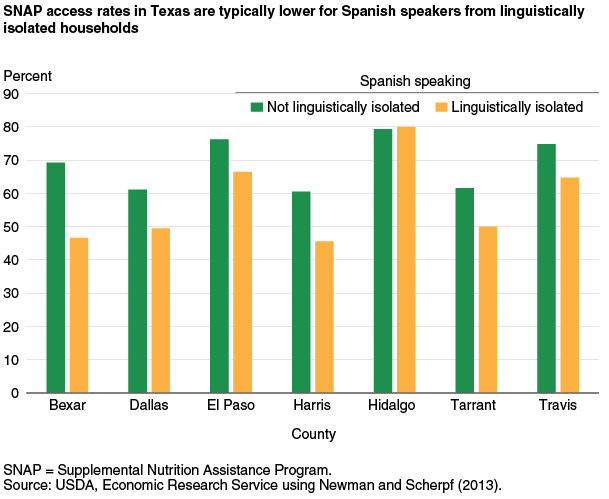
The study drilled down to provide statistics for several demographic subgroups. For example, SNAP access rates were estimated for Spanish-speaking households for several counties. Some of these households were designated as “linguistically isolated,” meaning that they lack an adult who has facility with English. Within Hidalgo County, one of the large counties for which intra-county differences could be estimated, there was no statistically significant gap in access rates between Spanish-speaking households that are and are not linguistically isolated. But in El Paso, another large county, the Spanish-speaking households that are linguistically isolated had an access rate nearly 10 percentage points below the access rate of those not linguistically isolated. So Hidalgo County did relatively better than El Paso County at reaching linguistically isolated Spanish-speaking households eligible for SNAP. The estimated SNAP access rates of Spanish-speaking households that are not linguistically isolated were essentially the same in Hidalgo and El Paso Counties (79.3 and 76.2 percent, respectively). The accuracy of this county-specific analysis relied on the linked data.
The researchers overcame several statistical challenges to conduct the 2013 Texas study. For example, the Census Bureau and SNAP regulations define a household differently. In the ACS, people who reside at the same address are in the same “household.” A SNAP “household” (or a SNAP “unit”) consists of people who purchase and prepare food together. The boundaries of these two definitions can differ at some residences. A mother and child may rent a room in a house and buy their own food and fix their own meals separately from the homeowner’s family. This residence would have two separate SNAP units if both groups satisfy the SNAP eligibility criteria. Or an aunt may live in the same house as her relatives but keep her food expenses and meal preparation separate from those of the other household members. This would be a one-person SNAP unit.
When researchers treat entire ACS households as if they are single SNAP units, the resulting SNAP “households” may contain too many people and have too much income, biasing the estimation of program eligibles. Instead, the ERS researchers used household composition data to model who, within an ACS household, is deemed to belong to a “constructed” or simulated SNAP unit. Then they added up incomes of the members in the constructed SNAP unit to estimate eligibility, excluding income of other people in the residence who do not belong to the constructed unit.
Another challenge in the Texas study arises whenever any two datasets need matching: which person in one dataset is the same person in the other? Is Joe Smith the same as Joseph Smith from Case #43G89-F? Without some method to identify matches, the information in one dataset cannot be brought into record-by-record conformity with the information in the other, making it impossible to combine their information. The ERS study used a Protected Identification Key (PIK) that the Census Bureau assigns to each individual in each data set; to prevent researchers from knowing the identities of survey respondents, the Census Bureau deletes personal information (such as names and addresses) from the file after assigning PIKs. Respondents were linked across datasets based on matching PIKs instead of names. Most constructed SNAP units had a person with a PIK for linking, although not quite everyone could be successfully “PIKed.”
The study’s innovations are now being applied to other States. A State that provides its SNAP data to the Census Bureau for linking with ACS data receives back specialized statistical results for that State based on the methodology and performance indicators used in the ERS Texas study. County- and demographic-specific information on SNAP and other assistance programs helps States understand local conditions to better administer the program.
SNAP Households in Deep Poverty Receive a Quarter of SNAP Benefits
Incomes vary across households that participate in SNAP. In general, households are eligible for SNAP benefits if their gross monthly incomes do not exceed 130 percent of the Federal poverty guideline and if they meet other criteria pertaining to net monthly income and assets. However, households with disabled or elderly members can qualify with higher incomes, and some States have adopted higher gross income thresholds. The growth in SNAP participation over the 2007-09 recession and its aftermath has led to questions about “targeting”—what percent of SNAP participants have “lower” incomes versus “higher” incomes? Targeting issues are frequently examined using data on annual income, because that is the way income is reported in most surveys.
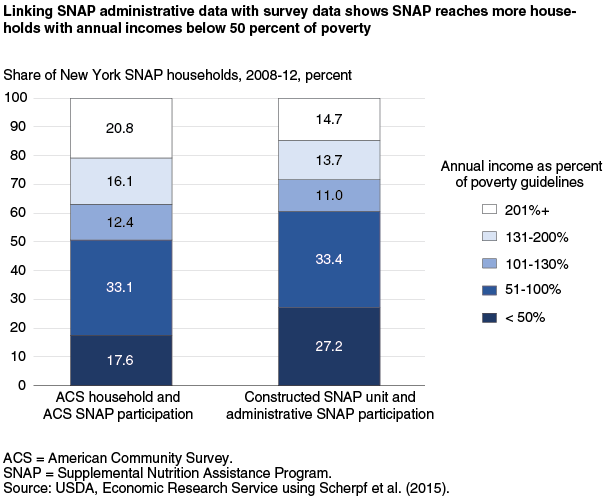
A second ERS study explored the targeting question and the results one would get using ACS data alone versus ACS data linked to SNAP administrative data from New York State. For the ACS-only measure, all people at the residence are considered in the same SNAP household, and participation is based on what the household reports to the ACS. In contrast, the linked-data measure uses the sometimes smaller, and lower income, constructed SNAP unit from survey data combined with monthly participation data based on official program records.
The study found improved targeting rates when using SNAP administrative data from New York State and careful modeling of constructed SNAP units versus using ACS data alone. The share of SNAP households in deep poverty (annual income less than 50 percent of the poverty guideline) increases from 17.6 to 27.2 percent between the ACS-only and linked data measures, while the share in poverty (annual income at or below 100 percent of poverty) increases from 50.7 to 60.6 percent. The linked data also reveal fewer SNAP households in the three above-poverty categories than the ACS-only data. Most of the difference between the two measures shows up in the category of deep poverty, which contains about a quarter of SNAP units in the linked-data measure.
SNAP Participation Rates Are Lower When Calculated in an Annual Timeframe
The number of different people who participate in SNAP at some time during the year exceeds the number who participate in an average month because there is participation turnover—new participants entering and old participants exiting as the months pass. Such turnover differs across different types of participants. People who are elderly or disabled tend to remain eligible for SNAP for long periods and exhibit little participation turnover, while working poor who stay in the program for shorter periods and enter and exit the program more often exhibit higher participation turnover.
The questions “Who is eligible for SNAP?” and “Who among the eligible participate?” may seem simple, but the answers depend on what timeframe is used to examine eligibility and participation. USDA calculates the official SNAP participation rate using a “monthly” timeframe of an average month of the year. Federal survey data on SNAP participation, on the other hand, frequently use an annual timeframe; such data come from a survey question that asks, “Did you receive SNAP at some time during the last year?” rather than “in an average month.”
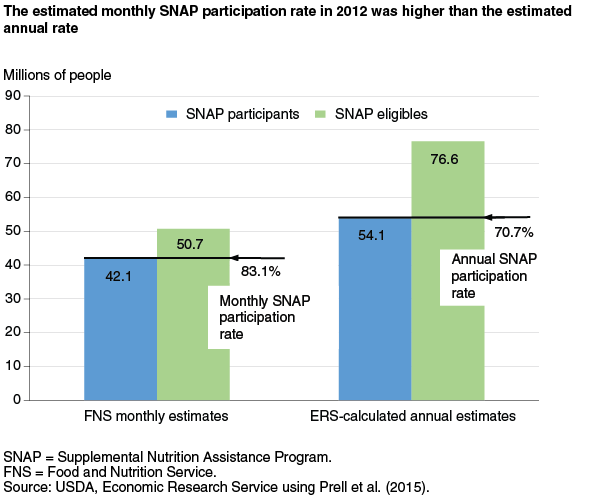
In a 2015 study, ERS researchers used an annual timeframe to develop a new measure called an annual participation rate based on ever-during-the-year eligibility and participation. The researchers used the Census Bureau’s Survey of Income and Program Participation to estimate an annual national SNAP participation rate for 2012. They estimated about 77 million people were eligible for 1 or more months at some time during the year. About 54 million of these 77 million people participated in SNAP for 1 or more months, resulting in an annual participation rate of about 71 percent. This annual rate was below the official monthly SNAP participation rate of about 83 percent for 2012. The annual participation rate was lower because, while the number of SNAP participants increased under the annual timeframe, the number of people eligible for SNAP increased even more.
ERS researchers also looked at annual versus monthly participation rates for New York SNAP participants. They used the State’s SNAP administrative data to obtain the number of people who received SNAP for 1 or more months of the year and estimated the number of people eligible for 1 or more months using survey data. They found the annual SNAP participation rate for New York in 2012 to be about 75 percent, less than the monthly SNAP participation rate of about 80 percent.
Researchers and policymakers who analyze SNAP trends need to be aware of these temporal effects on measured SNAP participation rates. The annual and monthly rates each provide a perspective on SNAP’s effectiveness in reaching different populations, and SNAP’s impacts can potentially differ depending on the timeframe used for analysis.
Integrating Data Sets Is a Goal of New Bipartisan Commission
To promote policy-relevant research using government data, the Evidence-Based Policymaking Commission Act was signed into law in March 2016. The Act creates a bipartisan Commission to determine how best to integrate separate datasets—some of which may contain confidential micro-level data—and make the data available for approved research projects, while evaluating how to ensure individual privacy and confidentiality. The Commission is to consider whether and how a data clearinghouse should be established that would bring together, for research purposes, survey and administrative datasets collected by and housed in different agencies—much like the Census-FNS-ERS Next-Generation Data Platform that fostered the three ERS studies reviewed here.
While technology and methodologies have changed since the country’s origins, the purpose of policy-oriented research has not. Statistical analysis shines a light on issues of how well programs are performing, who is and who is not benefiting from them, and how programs and policies might be improved. That lesson was well understood by Alexander Hamilton, who established precedents across the centuries as the first Treasury Secretary and the Government’s first applied economist.
This article is drawn from:
- Newman, C. & Scherpf, E. (2013). Supplemental Nutrition Assistance Program (SNAP) Access at the State and County Levels: Evidence From Texas SNAP Administrative Records and the American Community Survey. U.S. Department of Agriculture, Economic Research Service. ERR-156.
- Prell, M., Newman, C. & Scherpf, E. (2015). Annual and Monthly SNAP Participation Rates. U.S. Department of Agriculture, Economic Research Service. ERR-192.
- Scherpf, E., Newman, C. & Prell, M. (2015). Improving the Assessment of SNAP Targeting Using Administrative Records. U.S. Department of Agriculture, Economic Research Service. ERR-186.