
Understanding Trends in Rural Child Poverty, 2003-14
- by Thomas Hertz and Tracey Farrigan
- 5/16/2016
Highlights
- The share of rural children living below the official poverty line rose from 20.1 percent in 2003 to 26.7 percent in 2012, its highest level since at least 1968, before declining to 23.7 percent in 2014.
- The cause of the net increase in rural child poverty from 2003 to 2014 was not primarily a reduction in average family incomes in rural areas, which fell by 1.0 percent over the period; rather, it was an increase in income inequality between low-income and more affluent rural families.
- Though some of the increase in rural income inequality is attributed to changing rural demographics, the majority reflects a general increase in earnings inequality in rural areas across all demographic groups.
During the 1950s and 1960s, the adage “a rising tide lifts all boats” broadly applied to the U.S. economy. As average family incomes grew, the share of the population living in poverty fell rapidly. In the 1970s and 1980s, however, this relationship changed. Prior economic analyses have documented that during this period, average incomes continued to rise, but poverty increased. This indicates that incomes did not rise for families near the bottom of the income distribution. In other words, income inequality increased, and this translated into higher poverty, even though the economy was growing.
The recent increase in rural (nonmetropolitan) child (age 0 to 17) poverty suggests that a similar dynamic is still at work. According to the Current Population Survey, the source for official Federal Government estimates of poverty, rural child poverty grew between 2003 and 2007, even as the national economy expanded. Between 2007 and 2010, rural child poverty increased again, as might be expected given the profound economic recession of 2007-09. But the rural child poverty rate continued to rise through 2012, despite the resumption of economic growth at the national level. Finally, between 2012 and 2014, rural child poverty began to decline, but its level in 2014 remained well above that of 2003.
Why has rural child poverty risen, even in times of national economic growth, and why it has not returned to pre-recession levels? To answer these questions, ERS researchers calculated the relative importance of average growth (or decline) in rural incomes versus changes in rural income inequality, in generating this decade-long net increase in rural child poverty. Findings complement those from ERS studies on rural employment trends by shining light on the degree to which new rural jobs are being captured by low-income families with children.
Trends in Rural Child Poverty
Estimates of the share of rural children living in poverty presented in the table below use both the official Federal Government definition of poverty and a modified definition recommended by the National Research Council (see box “Measuring Trends in Child Poverty”). Based on the modified definition, between 2003 and 2007, rural child poverty grew by 1.4 percentage points despite growth in the national economy. Between 2007 and 2010, which spans the Great Recession, rural child poverty rose by another 1.5 percentage points. Between 2010 and 2012, the first years of the national economic recovery, rural child poverty rose by 2 more percentage points. Finally, in 2012-14, rural child poverty began to decline, falling by 1.6 points. Over the longer run, between 2003 and 2012, rural child poverty grew by 4.9 percentage points. And over the full analysis period 2003-14, the change was smaller, at 3.4 percentage points, due to the decline in poverty in the last 2 years.
| Year | Share of children in poverty (percent): official estimates |
Share of children in poverty (percent): modified family units |
|---|---|---|
| 2003 | 20.1 | 18.7 |
| 2007 | 22.3 | 20.2 |
| 2010 | 24.7 | 21.7 |
| 2012 | 26.7 | 23.7 |
| 2014 | 23.7 | 22.1 |
| Changes | ||
| 2003-07 | 2.2*** | 1.4** |
| 2007-10 | 2.4** | 1.5 |
| 2010-12 | 2.0* | 2.0* |
| 2012-14 | -3.0 | -1.6 |
| 2003-12 | 6.6*** | 4.9*** |
| 2003-14 | 3.6** | 3.4*** |
| *Statistically significant change at 90-percent confidence level. ** 95 percent. *** 99 percent. Note: Changes in the lower panel may appear to differ from changes in the upper panel due to rounding errors. The “modified family units” include unmarried partners of the household head and their children. Source: USDA, Economic Research Service calculations based on data from Census Bureau Current Population Survey. |
||
Rural Economic Recovery Lagging for Lower Income Families
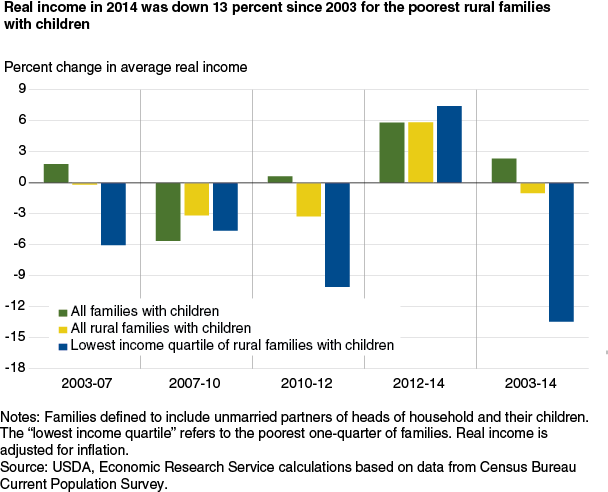
An analysis of changes in family incomes before, during, and after the last recession reveals how rural families fared in relation to the national average and how lower income families fared compared with more affluent families. After accounting for inflation, and expressed in 2014 dollars, the average income of rural families with children was $67,300 in 2003, the year that marked the start of the last national economic expansion. The average income level for rural families remained virtually unchanged over the next 4 years, even as the average income for all U.S. families grew by 1.8 percent. Between 2007 and 2010, rural family incomes fell by 3.1 percent on average, as the recession took its toll. Although the national economy grew from 2010 to 2012, the average income of rural families with children continued to slide, falling by another 3.3 percent, to a low of $62,900. Between 2012 and 2014, rural family incomes rebounded strongly, rising by 5.9 percent to $66,600, which was just 1.0 percent below the level in 2003. On the basis of average income alone, one would expect that rural child poverty in 2014 would be only marginally higher, not 3.4 percentage points higher, than it was in 2003.
Thus, part of the increase in rural child poverty can be attributed to the inability of rural average incomes to keep pace with national average incomes during the expansions of 2003-07 and 2010-12. But, average income trends during the period do not tell the full story, particularly when considering the experience of lower income families, those near the poverty line. Average income for the lowest income quartile of rural families with children fell by 6.0 percent during the expansion of 2003-07, 4.6 percent during the recession years, and 10.1 percent during the initial years of the economic recovery, 2010-12. Although incomes for this group grew strongly between 2012 and 2014, they still remained 13.4 percent below their 2003 levels. In other words, between 2003 and 2014, incomes at the bottom of the economic pyramid fell much faster than the average, which implies that rising rural income inequality contributed to the increase in rural child poverty. A more detailed look at the components of income for these bottom-quartile families shows that their declining incomes were primarily driven by a 20-percent decline in annual hours of work per family between 2003 and 2014.
Rising Income Inequality Explains More of the Increase in Child Poverty Than Does Falling Average Incomes
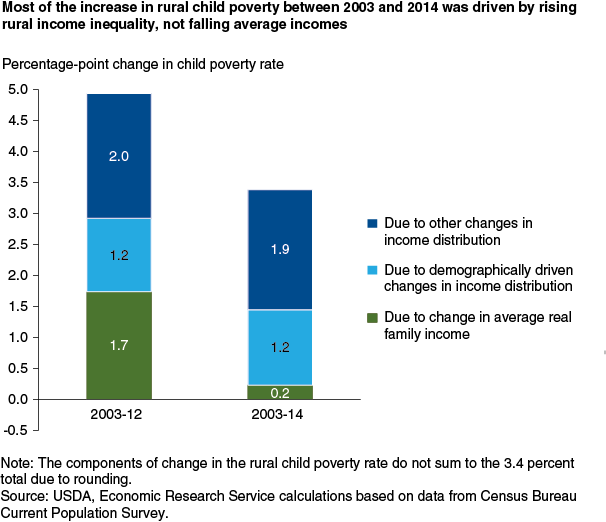
Using data from the Census Bureau’s Current Population Survey, ERS researchers quantified the shares of the rise in rural child poverty that can be attributed to the decline in average rural family income versus an increase in rural income inequality (see box “ How ERS Estimated the Effects of Falling Average Incomes Versus Rising Income Inequality”). In 2003-12, when rural child poverty rose by 4.9 percentage points, declining average incomes for rural families accounted for 1.7 percentage points of the increase (amounting to 35 percent of the total). The remaining 3.2 percentage points stemmed from rising rural income inequality. Of this amount, 1.2 percentage points (24 percent of the total) were attributed to changes in demographic variables, which include the size and composition of families, and the age, sex, race/ethnicity, country of birth, marital status, and educational level of the head of household. The remaining 2.0 percentage points (41 percent of the total) were attributed to increases in rural income inequality that could not be explained by shifting demographics.
By 2014, the rebound in rural average incomes had reduced poverty considerably, but the unfavorable changes in the rural distribution of income were not reversed. As a result, rural child poverty remained elevated. ERS estimates that the slight net decline in average rural family incomes between 2003 and 2014 accounted for 0.2 percentage points of the net increase in child poverty over this period, or 7.0 percent of the total 3.4-percentage-point change. The remaining 3.2 percentage points (93 percent of the total) reflected the persistence of an elevated level of rural income inequality. Of this amount, 1.2 percentage points (36 percent of the total) could be attributed to changes in demographic variables. The final 1.9 percentage points (57 percent of the total increase in rural child poverty between 2003 and 2014) reflected the effects of increased rural income inequality that could not be explained by demographic change.
How Changing Rural Demographics Contributed to Rising Child Poverty
Lastly, model results show how changes in each of the demographic variables examined contributed to the increase in poverty for rural families with children between 2003 and 2014. An increase in the number of children in the average rural family (which rose from 2.37 to 2.48) worked to raise poverty by 0.6 percentage points, while declines in the number of adults of prime working age (which fell from 1.67 to 1.64) and in the share of household heads that were married (which fell from 71.7 to 66.3 percent) raised rural child poverty by 0.9 and 0.7 points, respectively. A slight increase in the average age of the household head helped reduce rural child poverty by 0.5 percentage points. The most beneficial demographic change, however, was a rise in the share of rural household heads with a college degree, which rose from 15.8 to 19.5 percent, lowering poverty by 0.9 percentage points.
| Effects of changes in: | Percentage-point change in rural child poverty, 2003-14 |
|---|---|
| Number of children | 0.6** |
| Number of adults of prime working age, by gender | 0.9** |
| Marital status of household head | 0.7** |
| Age of household head | -0.5** |
| Race and country of birth of household head | 0.1* |
| Education of household head | -0.9** |
| Total of above | 0.9* |
| *Statistically significant change at 95 percent confidence. **At 99 percent confidence. Note: The total, 0.9 percentage points, differs slightly from the 1.2 points estimated elsewhere in the article due to differences in the two statistical techniques employed. See box “How ERS Estimated the Effects of Falling Average Incomes Versus Rising Income Inequality” for a fuller description of these demographic variables. Source: USDA, Economic Research Service calculations based on data from Census Bureau Current Population Survey. |
|
Conclusions
By 2014, the average income for rural families with children had almost recovered to its pre-recessionary level, yet rural child poverty remained elevated. This implies that income inequality in rural America had worsened; that is, the gap between the bottom and middle of the income distribution that existed prior to the Great Recession of 2007-09 had widened. ERS finds that this growth in income inequality accounted for most of the net increase in rural child poverty observed between 2003 and 2014.
Rising income inequality is often conceptualized as a matter of the increase in the gap between the top 1 percent and the bottom 99 percent of income earners, but ERS findings imply that inequality is also rising between the bottom income quartile and the rest of the population, and that this effect has exacerbated rural child poverty. Because labor income is the largest component of family income, the primary source of rising inequality lies in the labor market, which suggests that jobs creation in rural areas may help alleviate rural child poverty. However, the strength of the link between jobs creation and poverty reduction depends critically on whether low-income families have the skills needed to fill these new jobs. Further research is needed to help determine the best way to stimulate rural employment that matches with workers’ current skills and to ascertain the effectiveness of different educational and skills training policies in addressing any remaining skills deficits.
This article is drawn from:
- Hertz, T. & Farrigan, T. (2016). Understanding the Rise in Rural Child Poverty, 2003-14. U.S. Department of Agriculture, Economic Research Service. ERR-208.