
Linking Federal Food Intake Surveys Provides a More Accurate Look at Eating Out Trends
- by Joanne Guthrie, Biing-Hwan Lin and Travis A. Smith
- 6/6/2016
Over the past three decades, food prepared away from home—whether eaten at restaurants, picked up or delivered to eat at home, or served in school cafeterias—has become a regular part of more and more Americans’ diets. For decades, the Federal Government has conducted nationally representative surveys of Americans’ food and nutrient intakes and where foods are purchased. Yet, differences in data collection and coding methods for the surveys make it difficult to use them to analyze long-term trends.
Federal dietary surveys conducted between 1977 and 2012 asked respondents whether or not the food was eaten at home as well as where the food was acquired. The food source coding scheme changed over time, but many sources are common across all surveys: either from supermarkets, smaller grocery stores, or other retailers (at-home food) or from a food-away-from home (FAFH) source. Subcategories within FAFH include full-service restaurant with wait staff, fast-food establishment with no wait staff, school or day care, and a catchall “other” subcategory that includes vending machines and other miscellaneous sources.
Researchers at ERS and the University of Georgia recoded the food sources consistently across the following federally collected national surveys:
- USDA Nationwide Food Consumption Survey (NFCS) 1977-78;
- USDA Continuing Survey of Food Intakes by Individuals (CSFII) 1989-91 and 1994-98; and
- National Health and Nutrition Examination Survey (NHANES) 2003-04, 2005-06, 2007-08, 2009-10, and 2011-12.
By linking food intake surveys conducted between 1977 and 2012 and providing consistent FAFH definitions, the researchers were able to assess longrun shifts in where consumers of different ages and income levels purchase their foods. Information on FAFH sources for different subpopulations can help in efforts to target nutrition education and policies.
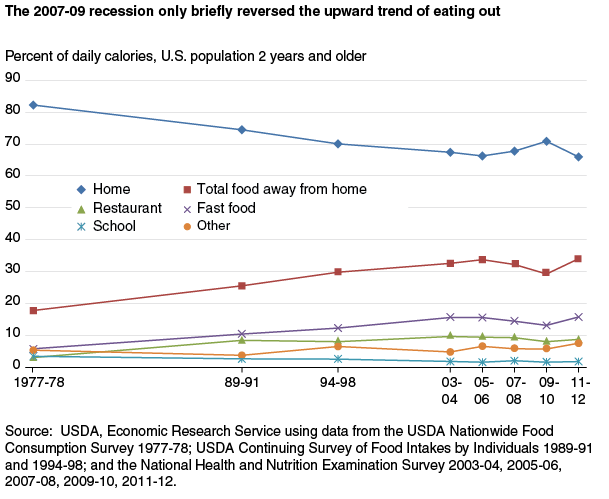
30-Year Decline in Home-Prepared Food Briefly Reversed in 2007-10
For approximately 30 years, the share of food energy (measured in calories) obtained from FAFH sources steadily climbed. For the U.S. population as a whole (age 2 and older), the share of calories from FAFH rose from 17.8 percent in 1977-78 to 33.8 percent in 2005-06. Increased consumption of fast-food fare drove this trend. The share of calories obtained from fast food increased from 5.7 percent in 1977-78 to 15.6 percent in 2005-06.
Between 2007 and 2010, the share of calories obtained from FAFH briefly dipped to 29.1 percent, while calories obtained from fast food dropped to 13.2 percent. This period roughly corresponds to the 2007-09 recession in America—the most severe recession since the 1930s. Americans economized during this time by eating less FAFH, not just shifting to lower cost FAFH options. For some households, unemployment played a role in the change in habits by reducing funds for discretionary eating out and providing more time to cook at home. But, by 2011-12, the FAFH share of total calories rebounded to 34.0 percent, and the fast-food share grew to 15.8 percent.
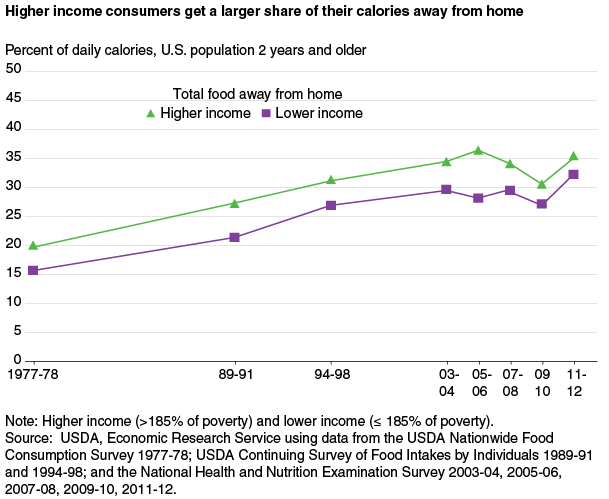
Across All Time Periods, Low-Income Individuals Ate Less Food Prepared Away From Home
Researchers also looked at individuals living in higher income households (above 185 percent of the Federal poverty level) and individuals living in households with lower incomes (at or below 185 percent of the Federal poverty level). While individuals with lower incomes increased their consumption of FAFH during the period, they ate less of it at all time points than did those with higher incomes—not surprising since FAFH is generally a more expensive choice than food prepared at home.
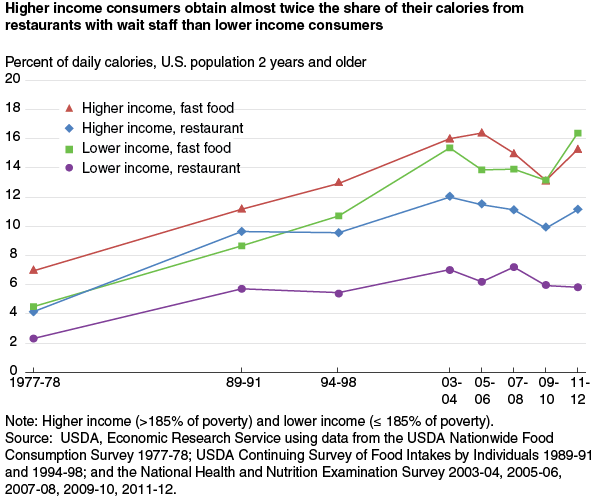
Across Income Groups, Fast Food Led as an FAFH Source of Calories
Among both higher and lower income individuals, fast food was the leading source of FAFH calories over 1977-78 to 2011-12. For most of that time, higher income consumers had a larger share of calories coming from fast food. But in 2011-12, the share for lower income individuals was slightly higher—16.4 percent versus 15.3 percent.
Higher income consumers obtained a larger share of their calories from restaurant foods than lower income consumers did over the period 1977-78 to 2011-12. For example, during 2011-12, higher income consumers obtained 11.2 percent of calories from restaurants, compared with 5.8 percent for lower income consumers.
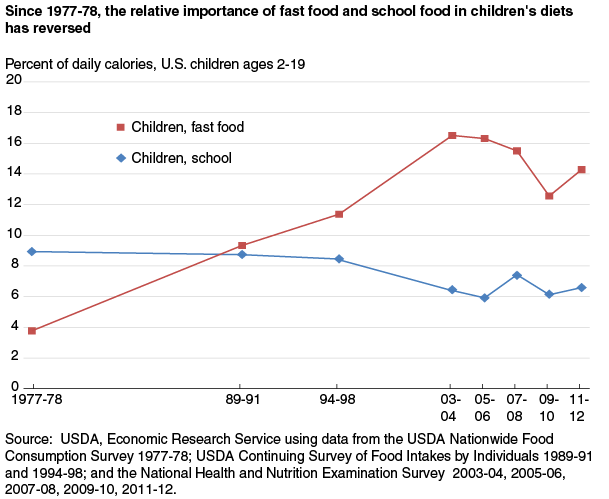
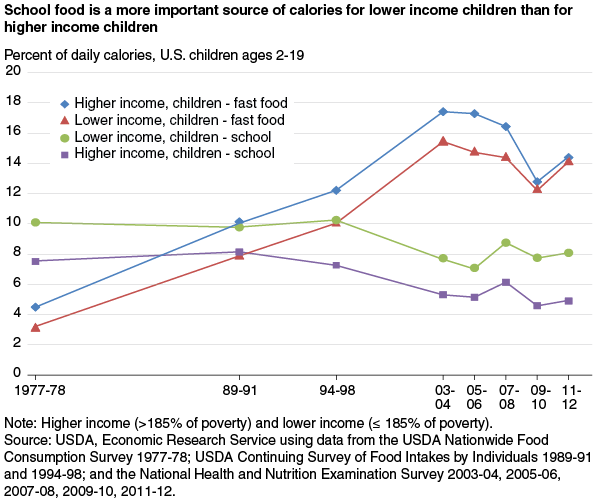
Beginning in 1989-91, Fast Food Replaced School Food as Children’s Leading FAFH Source
In 1977-78, fast food provided less than 4 percent of children’s mean daily energy intake. In the years that followed, children’s intake of calories from fast food rose sharply, peaking at 16.5 percent of total calories in 2003-04, declining to 12.6 percent in 2009-10, and rising again to 14.3 percent in 2011-12.
School foods dropped from providing 8.9 percent of children’s total calories in 1977-78 to 5.9 percent in 2005-06. Since then, the share of energy children obtain from school foods has ranged from 6 to 7 percent.
Lower income children ate more school foods at all time periods. Children in households with incomes at or below 185 percent of the Federal poverty level are eligible for free or reduced-price USDA school meals. In the earlier study years, lower income children ate less fast food than higher income children, with the share of calories for both groups peaking in 2003-04 at 15.5 percent and 17.4 percent, respectively. Intakes of each group dropped in 2009-10 and became more similar, at 12.4 and 12.8 percent, respectively, before rising in 2011-12 to over 14 percent.
Food Away From Home—An Integrated Component of Modern Diets
While consumption of FAFH dipped during the recession of 2007-09 and its aftermath, calories from FAFH rose again in 2011-12. This short-lived reversal suggests that Americans’ shift in eating habits toward more consumption of FAFH—a shift that occurred among both higher and lower income Americans and children as well as adults—is deep rooted and likely to continue if the economic recovery persists.
This article is drawn from:
- Food Consumption, Nutrient Intakes, and Diet Quality. (n.d.). U.S. Department of Agriculture, Economic Research Service.
- Food Consumption & Demand - Food Away from Home. (n.d.). U.S. Department of Agriculture, Economic Research Service.
You may also like:
- Todd, J.E. & Morrison, R.M. (2014, March 4). Less Eating Out, Improved Diets, and More Family Meals in the Wake of the Great Recession. Amber Waves, U.S. Department of Agriculture, Economic Research Service.