
Understanding America’s Diverse Family Farms
- by Robert A. Hoppe and James M. MacDonald
- 2/1/2016
Farms in the United States are diverse, ranging from very small retirement and residential farms producing little to enterprises with annual sales in the millions of dollars. Broad descriptions of farms based on U.S. averages can mask variation among different sizes and types of farms. Information on the different kinds of farms is important for understanding the economic well-being of farm households and the impact of farm policy.
ERS developed a farm classification, or typology, and uses it to categorize farms into more homogenous groups to better understand conditions within the farm sector (see table below). This classification is based on the size of the farm, the primary occupation of the operator, and family/nonfamily ownership of the farm. Farm size is measured by gross cash farm income (GCFI), or the farm’s annual revenue from sales of crops and livestock, Government payments, and other farm-related income, including fees from production contracts.
| Farm type | Operator’s primary occupation1 | Farm size, measured by annual GCFI2($) | Number of farms (2014) |
|---|---|---|---|
| Small family farms3 | Varies | Less than 350,000 | 1,859,326 |
| Retirement farms | Retired from farming | Less than 350,000 | 281,738 |
| Off-farm occupation farms | Nonfarm | Less than 350,000 | 943,137 |
| Farm-occupation farms | |||
|
Low-sales
|
Farming | Less than 150,000 | 525,248 |
|
Moderate-sales
|
Farming | 150,000-349,999 | 109,202 |
| Midsize family farms3 | Not a criterion | 350,000-999,999 | 124,124 |
| Large-scale family farms3 | Not a criterion | 1,000,000 or more | 69,559 |
| Large farms | Not a criterion | 1,000,000-4,999,999 | 62,706 |
| Very large farms | Not a criterion | 5,000,000 or more | 6,853 |
| Nonfamily farms3 | Not a criterion | Not a criterion | 23,266 |
| Note: USDA defines a farm as any place that produced and sold—or normally would have produced and sold—at least $1,000 of agricultural products in a given year. 1Occupation at which the operator spends 50 percent or more of his or her work time. 2Gross cash farm income (GCFI) is the sum of the farm's crop and livestock sales, Government payments, and other farm-related income, including production contract fees. 3Family farms include any farm where the majority of the business is owned by the operator and relatives of the operator. Nonfamily farms do not meet that requirement. Source: USDA, Economic Research Service using data from USDA's 2014 Agricultural Resource Management Survey. |
|||
To examine differences among groups in the typology, ERS uses 2014 data from the Agricultural Resource Management Survey (ARMS), conducted annually by USDA’s National Agricultural Statistics Service and ERS. This helps to provide a better understanding of U.S. farm structure and of relationships between farm and farm household finances.
Small Family Farms Dominate the Farm Count—But Not Production
Farming is still an industry of family businesses. Ninety-nine percent of U.S. farms are family farms, and they accounted for 90 percent of farm production in 2014. Nonfamily farms accounted for only 1 percent of U.S. farms and 10 percent of production.
Several factors favor family farming. For example, economies of scale are modest in farming; most cost reductions can be achieved by relatively small farm businesses, compared with other industries. Farming can also be highly seasonal, and farm households are able to adjust to seasonality by shifting their labor from one task to another or by working off the farm. Crop production requires local knowledge of soils, pests, and weather, while livestock production requires knowledge of livestock and how they respond to local conditions. Such knowledge takes time to acquire and is difficult to transfer to others.
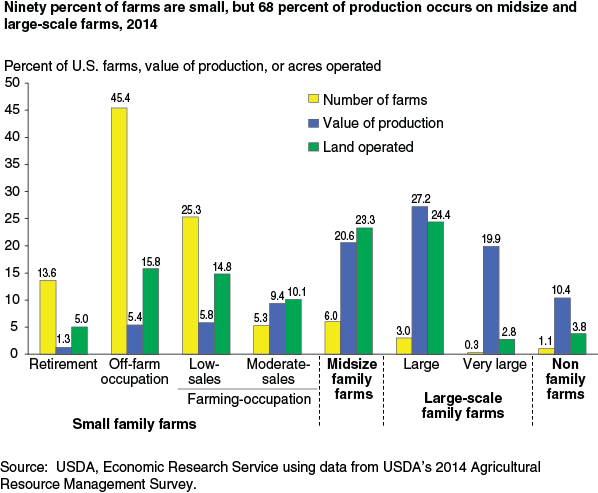
Small family farms accounted for 90 percent of all U.S. farms and operated 46 percent of farmland in 2014. Off-farm occupation farms alone made up 45 percent of U.S. farms but accounted for only 16 percent of farmland and 5 percent of production. Most production—68 percent—occurs on the 9 percent of farms classified as midsize or large-scale family farms, which also account for 51 percent of all farmland.
Larger family farms also account for large shares of specific commodities. In 2014:
- Large-scale and nonfamily farms accounted for most high-value crops (82 percent of production) and beef (63 percent).
- Midsize and large-scale family farms together accounted for most U.S. production of cotton (81 percent), cash grains/soybeans (76 percent), and hogs (66 percent).
- Large-scale family farms alone produced 73 percent of dairy output.
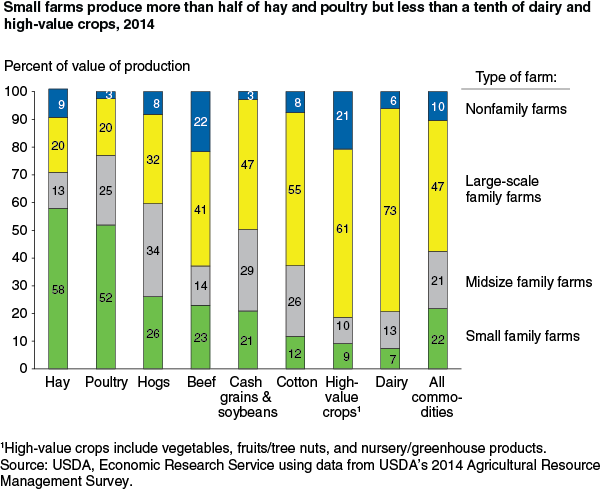
Although small farms accounted for only 22 percent of U.S. production in 2014, they produced over half the poultry (mostly under production contracts) and hay. Small farms with moderate sales account for most small-farm poultry production while most hay produced by small farms occurs on off-farm occupation and low-sales farms.
Lack of Farm Profitability Need Not Mean Low Household Income
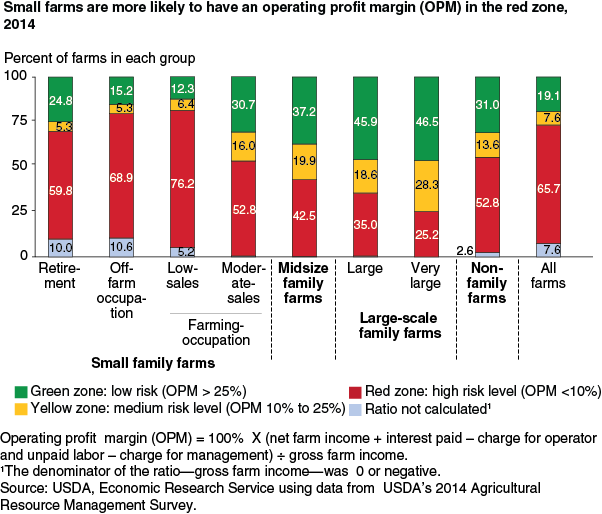
One commonly used measure of profitability is operating profit margin (OPM)—the ratio of operating profit to gross farm income—a measure of the funds available to finance the farm’s ongoing operation (see box, “Operating Profit Margin”). A farm is in the “red zone,” indicating potential financial problems, if its OPM is less than 10 percent.
Fifty-three to 76 percent of small farms (depending on the subset of small farms considered) were in the red zone in 2014. Most small farms in the red zone also had a negative operating margin, the result of losses from farming. But other small farms were more profitable: 12 to 31 percent of each small farm group had an OPM in the low-risk green zone, with a margin of more than 25 percent. Nevertheless, an even greater share of midsize (37 percent) and large and very large farms (46 and 47 percent, respectively) had an OPM greater than 25 percent. In addition, a majority of midsize and large-scale farms operated outside the red zone.
Despite the many small farms that operate in the red zone, such farms continue to exist because their operator households typically receive substantial off-farm income. Profit margins are less meaningful for small farms than for larger farms. One-half to two-thirds of farmers operating retirement, off-farm occupation, or low-sales farms report losses from farming. Off-farm income, however, enables average household income for farmers in these groups to range from $72,300 to $128,100, compared with $75,700 for all U.S. households in 2014. These small farm households often use off-farm income to cover farm expenses and fund their farm operations. Self-employment or wage/salary jobs are the main source of off-farm income for farm households. They may also write off losses from farming against other income for income tax purposes.
| Type of farm operated | Total average income (dollars) | Income from farming: amount (dollars) |
Income from farming: negative (percent) |
From off-farm sources: total (dollars) |
From off-farm sources: earned1 (dollars) |
From off-farm sources: unearned1 (dollars) |
|---|---|---|---|---|---|---|
| Small family farms | ||||||
| Retirement | 80,146 | 6,862 | 48.2 | 73,284 | 32,630 | 40,654 |
| Off-farm occupation | 128,086 | -1,745 | 66.8 | 129,830 | 100,513 | 29,317 |
| Farm-occupation | ||||||
|
Low-sales
|
72,320 | -1,048 | 52.3 | 73,368 | 41,507 | 31,862 |
|
Moderate-sales
|
181,335 | 49,711 | 21.3 | 131,624 | 10,362 | 27,262 |
| Midsize family farms | 201,539 | 124,968 | 18.0 | 76,570 | 49,224 | 27,346 |
| Large-scale family farms | ||||||
| Large family farms | 463,894 | 388,172 | 12.2 | 75,722 | 50,970 | 24,752 |
| Very large family farms | 2,220,659 | 2,025,162 | 9.1 | 195,497 | 101,981 | 93,516 |
| All family farms | 131,754 | 28,687 | 53.3 | 103,067 | 71,697 | 31,370 |
| Note: Household income is not estimated for nonfamily farms. Dollars = dollars per household. Percent = percent of households. 1Earned income comes from off-farm self-employment or wage/salary jobs. Unearned income includes interest and dividends, benefits from Social Security and other public programs, alimony, annuities, net income of estates or trusts, private pensions, etc. Source: USDA, Economic Research Service using data from USDA's 2014 Agricultural Resource Management Survey. |
||||||
Because many small-farm households rely heavily on off-farm income, general economic policies—such as macroeconomic or tax policies—may be as important to them as traditional farm policy. Likewise, retirement programs are important to operators of retirement farms and other older operators.
This article is drawn from:
- Hoppe, R.A. & MacDonald, J.M. (2015). America's Diverse Family Farms: 2015 Edition. U.S. Department of Agriculture, Economic Research Service. EIB-146.