Using the ERS County Economic Types To Explore Demographic and Economic Trends in Rural Areas
- by Lorin Kusmin
- 12/5/2016
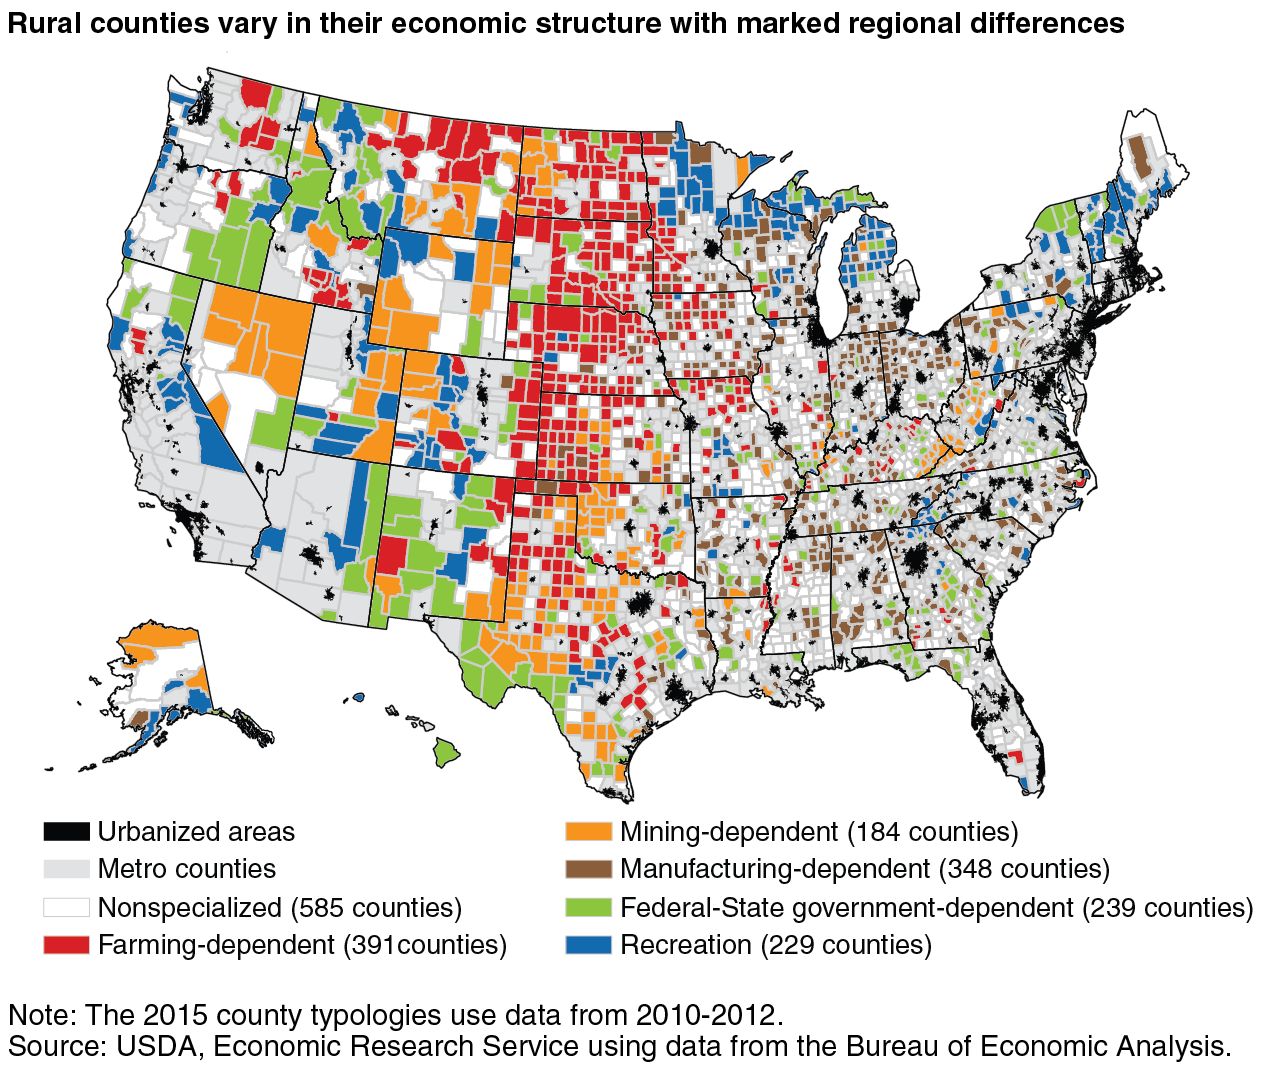
The 2015 ERS County Typology Codes classify all U.S. counties according to six categories of economic dependence: farming, mining, manufacturing, Federal/State government, recreation, and nonspecialized counties. ERS developed this typology to help characterize the socioeconomic diversity of rural America. Counties are usually classified as dependent on a particular sector when the share of employment or earnings in that sector is markedly above the average.
The 2015 County Economic Types were discussed in “Updated ERS County Economic Types Show a Changing Rural Landscape,” which appeared in Amber Waves in December 2015; that article focused on how the categories had changed since the previous update in 2004. While both rural and urban areas are now classified under the typology, this article focuses on how the diversity reflected in the typology can be used to better understand variation in demographic and economic trends in rural areas. Further detail on the criteria for classification can be found at http://www.ers.usda.gov/data-products/county-typology-codes.aspx.
Population growth trends vary across rural county economic types
The significance of these economic specializations can be seen in population trends for several major county types. Population trends reflect both migration and natural increase (the number of births minus deaths). Short-term changes in population growth largely reflect changing migration patterns, while long-term trends are also influenced by age structure and trends in fertility and mortality.
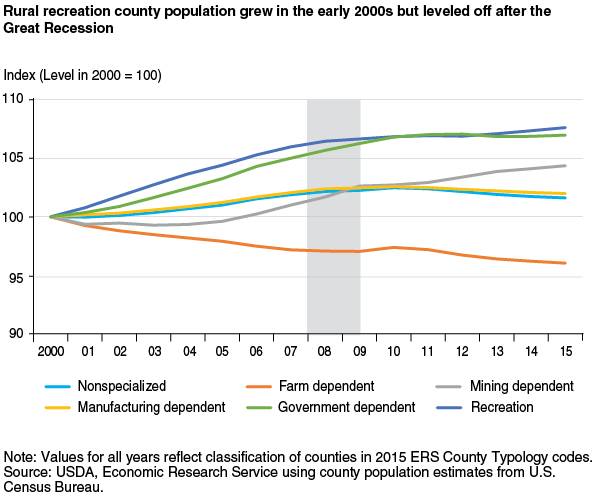
Recreation counties have seen the most robust population growth since 2000. Many of these counties attract retirees and others looking for amenities like open spaces and water views. However, growth in these counties slowed sharply during and after the Great Recession, reflecting declines in discretionary income and mobility associated with the downturn.
Population growth in government-dependent counties was also relatively strong in the 2000s before slowing in more recent years. Meanwhile, rural manufacturing counties, hard hit by the recession and its aftermath, went from modest population growth in the early 2000s to slight population decline in more recent years.
Demand for the types of goods and services produced by the local economy is not the only factor affecting population. For example, farming-dependent counties have seen population drop 4 percentage points since 2000, despite generally robust demand for U.S. agricultural products. This decline continues a long-term trend reflecting rising labor productivity in the farm sector, as well as the lack of other economic opportunities and amenities in many of these often remote counties. These conditions lead to substantial net outmigration of young adults, which in turn results in a population age structure consistent with fewer births and more deaths.
Median household incomes are below 2007 levels but improving for most rural county types
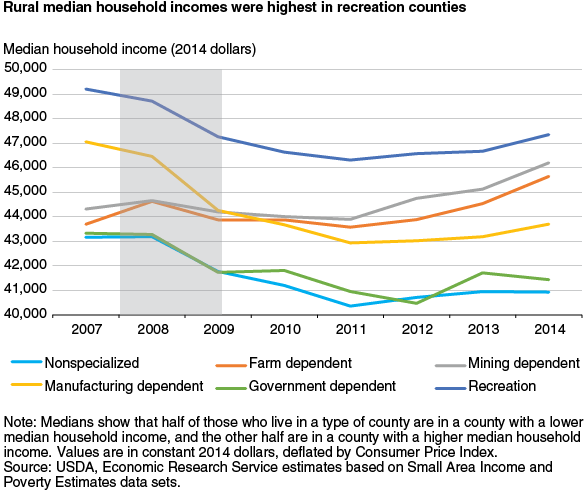
Median household incomes fell for all county types during the Great Recession. By 2014, however, median incomes in both farming- and mining-dependent counties had increased to more than 4 percent above 2007 levels. Median household income for all other county types remained below 2007 levels in 2014. (County-level estimates for median household income are not yet available for 2015.)
From 2007 through 2014, rural recreation counties had the highest median household incomes—despite the reduction in population growth that characterized these counties after the recession. These high levels of household income appear to reflect higher average levels of income from assets (dividends, interest, and rent) among the residents of these counties. Farming and mining counties also had high median household incomes, reflecting the relative prosperity of the farm and energy sectors during 2007-14. Nonspecialized and government-dependent counties had the lowest household incomes during the period. In many of the counties in the latter type, the prominence of the public sector reflects a lack of private employment opportunities.
Manufacturing counties enjoyed relatively high median household incomes in 2007 but suffered the greatest losses of any economic type during the Great Recession, reflecting the loss of manufacturing jobs. By 2014, the median income level in these counties was well below that for farming and mining counties.
Poverty rates rose for all rural county types during and after the recession but have begun to decline
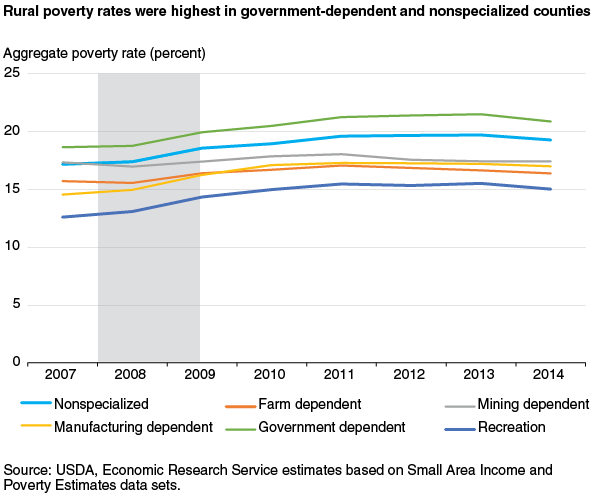
The highest poverty rates as well as the lowest median household incomes are in county types not associated with a clear private-sector economic base—that is, nonspecialized and government-dependent counties. In contrast, recreation counties have the lowest poverty rate and highest household incomes. While earnings in recreation jobs are low, many of these counties also attract migrants who are drawn by their amenities, and such migrants are likely to have relatively high incomes. Poverty rates and per capita incomes are intermediate for farming, mining, and manufacturing counties. The poverty rate rose substantially between 2007 and 2014 for all rural county types except mining counties. While national data from the U.S. Census Bureau’s American Community Survey showed a marked drop in rural poverty in 2015, county-level data on poverty in 2015 are not yet available.
*On December 15, 2016, a correction was made to the figure, Rural median household incomes were highest in recreation counties. The correction fixes the colors for the lines corresponding to recreation counties and government dependent counties, which were inadvertently reversed.
This article is drawn from:
- Kusmin, L. (2016). Rural America at a Glance, 2016 Edition. U.S. Department of Agriculture, Economic Research Service. EIB-162.


