
Changes in Food-At-Home Spending by SNAP Participants After the Stimulus Act of 2009
- by Charlotte Tuttle
- 12/5/2016
Highlights
- The American Recovery and Reinvestment Act of 2009 temporarily raised SNAP benefit levels to help low-income Americans cope with the economic crisis of the Great Recession
- ERS analyses found that during 2008-09, each dollar of SNAP assistance raised participants’ at-home food spending by an average of 53 cents—a higher portion than in previous studies.
- The lowest income households had the highest propensity to spend SNAP benefits on food—for every $1 in SNAP benefits, these households increased their food spending by 62 cents.
The Supplemental Nutrition Assistance Program (SNAP) is the largest of USDA’s 15 food and nutrition assistance programs. In 2015, an average of 45.8 million Americans participated in the program each month, receiving a total of $69.7 billion of benefits to be spent in grocery stores, supermarkets, supercenters, and other food retailers authorized to accept SNAP benefits. In 2013, with the Nation still recovering from the economic crisis following the 2007-09 recession and the national unemployment rate at 7.4 percent and 14.5 percent of Americans living in poverty, 47.6 million people received SNAP benefits.
A critical policy objective of SNAP is to increase the resources of low-income households for buying food. To achieve this objective, SNAP provides participating households monthly benefits through an EBT (electronic benefit transfer). Participants are only allowed to use SNAP benefits to purchase food bought at grocery stores, supermarkets, supercenters, and other food retailers—“food at home” for short. SNAP benefits are designed to supplement participants’ own food spending; SNAP households are expected to combine their own cash income with program benefits in order to purchase food.
A number of previous studies have attempted to answer the question, how does SNAP participation affect food spending behavior? Tackling this question raises challenges of distinguishing association from causality. The American Recovery and Reinvestment Act of 2009 (ARRA), also known as the Stimulus Act of 2009, resulted in a one-time large increase in SNAP benefits, allowing researchers to reexamine the relationship between SNAP participation and food spending free from some of the empirical challenges of past studies. A recent ERS report examined how ARRA-provided benefit increases affected food-at-home spending of SNAP participants, addressing not only the effects of higher benefits on spending behavior but also the effects of in-kind transfers like SNAP on household spending choices.
Cash Versus In-Kind Assistance
Federal assistance can be issued in two general ways: through cash, such as Temporary Assistance for Needy Families or unemployment benefits, or through in-kind assistance, such as free school meals, home energy assistance paid directly to utility companies, and SNAP benefits. In-kind transfers must be used for a specific purpose; in the case of SNAP, for purchasing food at home.
Despite these restrictions, neoclassical economic theory suggests that income, regardless of how it is received, is fungible. According to the theory, SNAP participants who typically spend some of their own money on food in addition to their SNAP benefits are expected to treat $1 in additional SNAP benefits the same as $1 in cash income. While SNAP benefits can only be used to purchase food at home, because most SNAP households combine cash and SNAP to purchase food, SNAP benefits free up cash previously spent on food for other needs. Households use the SNAP assistance to replace some of their own money they were spending on food.
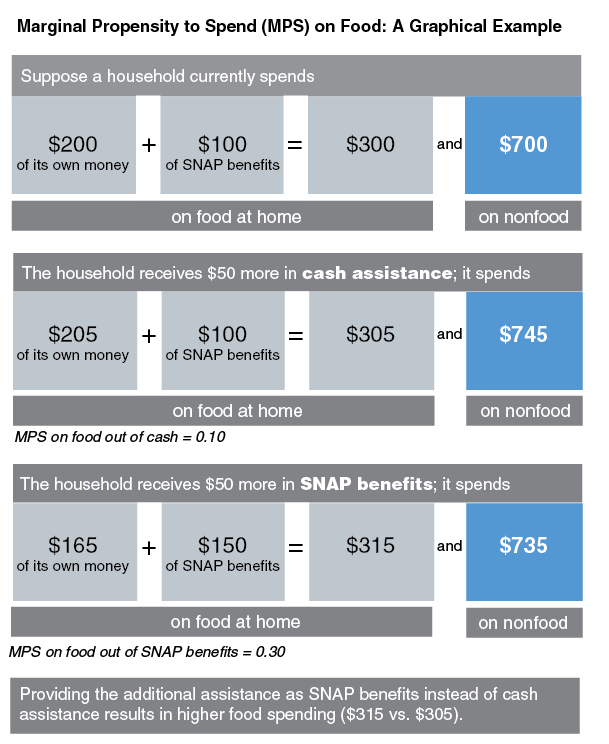
The portion of an additional dollar of cash income spent on food is referred to as the marginal propensity to spend on food (MPS on food) out of cash. Past studies have found that the MPS on food out of cash is 5 to 10 percent. For example, imagine a household receives $100 in SNAP benefits and spends $50 of its own money on food each month. If it is given an additional dollar in cash, the household would increase spending on food by 5 to 10 cents. The remaining 90 to 95 cents would be spent on other needs, such as clothing or health care.
The MPS on food out of SNAP benefits, however, is not the same as the MPS on food out of cash. Past research has found that if a household is given $1 in SNAP benefits, it increases food spending by more than 5 to 10 cents. Previous estimates of the MPS on food out of SNAP benefits ranged from 17 to 47 percent, all higher than estimates of the MPS on food out of cash. If the MPS on food out of benefits is higher, this means that households receiving assistance in the form of SNAP benefits will increase food spending by more than equivalent assistance in the form of cash, thereby increasing the food purchasing power of participating households, a stated goal of SNAP.
ARRA Provides a Unique Opportunity To Examine Spending Behavior of SNAP Participants
Researchers studying the relationship between SNAP benefits and food expenditure often find it difficult to disentangle the effects of program participation decisions from spending decisions. For example, SNAP may attract those who have a stronger preference for food and spend more money on food. It may not be the program driving higher food spending, but the preferences of the people who apply for SNAP. Hence, a causal relationship between participation and food expenditure is difficult to estimate.
Some analyses have attempted to surmount this challenge either through sophisticated empirical techniques or through the use of data from randomized control trials where benefits levels are assigned independently of other household factors. These studies used data from 20 to 40 years ago, and SNAP has changed considerably since then. Therefore, the results of previous studies may not be relevant to today’s program, and some of these studies may suffer from measurement challenges associated with analysis of SNAP.
A recent ERS study estimated the effect of SNAP benefits on participants’ food spending as a share of their total household expenditures, using more recent data and exploiting the natural experiment afforded by the ARRA increase in benefits in April 2009. ARRA presented such a natural experiment because it increased SNAP benefits independent of any behavior on the part of participants, such as leaving a job or reducing household size. In the case of ARRA, participant households received higher benefits at a specific point in time regardless of household factors (see box, “SNAP and the American Recovery and Reinvestment Act”).
To estimate the effects of ARRA on food expenditure shares of SNAP households, ERS researchers used an empirical model that allowed them to compare food expenditure shares of participant households to food expenditure shares of similar nonparticipant households before and after ARRA was implemented. Because the benefit level changes are exogenous to the households—in other words, households had no influence on the benefit levels they received—researchers were able to identify how changes in benefits affect food spending while avoiding measurement issues previous studies have faced.
The researchers used data from the 2008-09 Consumer Expenditure Survey (CE). The survey, administered by the Bureau of Labor Statistics, collects information on quarterly household spending for a set of households over five consecutive quarters. CE categories include large purchases such as vehicles and appliances, as well as regular spending on items such as food and rent. Demographic information is also collected, including age, race, marital status, number of children, income, and assistance program participation, including annual SNAP benefits. Because the CE collects information for survey households over five consecutive quarters, researchers are able to examine the purchases of households in the quarters before and after ARRA.
Within the CE data, researchers identified SNAP households that used their own money as well as SNAP benefits for their food purchases. About 8 percent of SNAP households relied exclusively on SNAP benefits for their food-at-home purchases; those households were not included in the analysis. Nonparticipant households with similar compositions to participant households were matched on income, marital status, number of children, race, and gender.
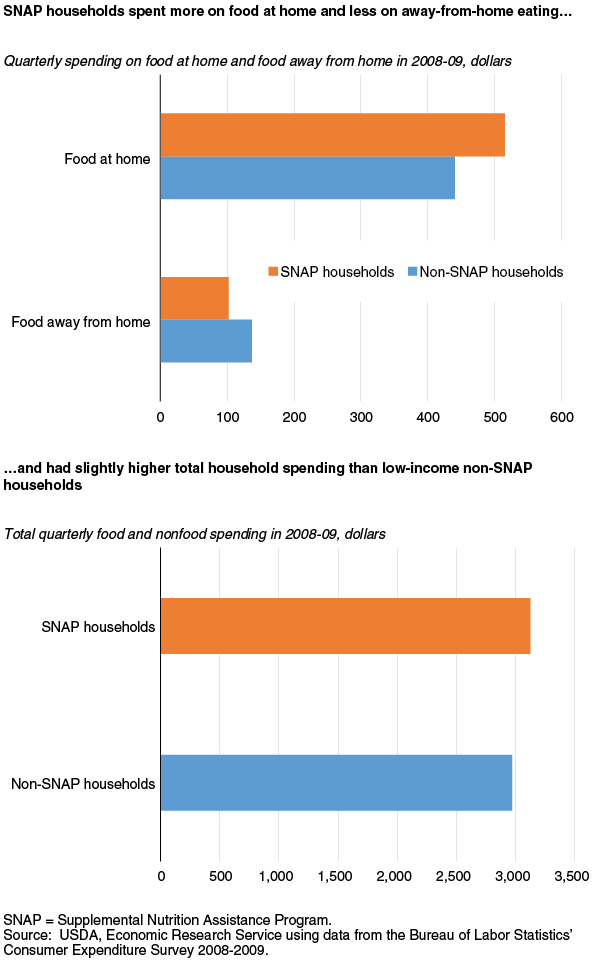
Total household spending by SNAP households was higher than that by similar non-SNAP households. Non-SNAP households spent an average of $2,968 per quarter on food and nonfood purchases in 2008-09, and SNAP households spent an average of $3,123. SNAP households spent more on food at-home and less on eating out (food away from home) during 2008-09 than similar households not participating in SNAP.
ARRA Boosted the Food Spending of SNAP Participants
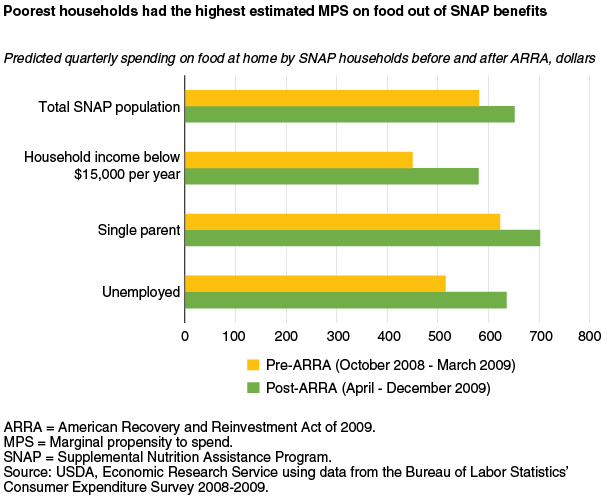
According to the ERS study, in the year prior to ARRA, the SNAP households that supplement their SNAP benefits with their own money spent an average of 19.2 percent of their total expenditures on food at home, or $581 per quarter. After ARRA (April-December 2009), those same SNAP households spent 20.6 percent of total expenditures on food at home, or $651 per quarter. Spending “more” on food can take the form of higher amounts of food, greater variety of foods, and/or costlier nonstaples. This increased spending implies that for every $1 of SNAP benefits, participants who combined their own income with SNAP to purchase food spent an additional 53 cents on food at home—a figure 40 to 50 cents higher than that found in previous studies estimating the MPS on food out of cash. Thus, SNAP has a bigger effect on food spending than predicted by neoclassical theory and found in previous empirical investigations.
The ERS study also examined data on food expenditures by four vulnerable subgroups to see whether these groups had a greater response to ARRA than the total SNAP population. The subgroups include single-parent households, households with incomes under $15,000 per year, households with a member 65 or older, and households with an unemployed member. Households in vulnerable financial situations, such as those with single parents or unemployed members, may have the greatest need and the greatest benefit from SNAP participation. All the subgroups, except households with an elderly member, increased their share of total expenditures spent on food at home after ARRA. Households with an elderly member did not have a significant change in food-at-home spending after ARRA.
According to the study, the food expenditure share for the lowest income households increased by 3.5 percentage points, or $130, after ARRA, compared to that for the lowest income nonparticipant households. The MPS on food for this subgroup of SNAP participants who spend more than their SNAP benefits on food was estimated to be 0.62, or 62 cents for every $1 in SNAP benefits.
Single-parent SNAP households increased their food spending as a share of total expenditures by 2.4 percentage points after ARRA, or $79 per quarter, with an MPS on food out of SNAP benefits of 0.42. SNAP households with an unemployed member had a 3.2-percentage point increase in food expenditure share, or $120 per quarter, with an MPS on food out of SNAP benefits of 0.39.
The lowest income households, single-parent households, and households with an unemployed member may have shown greater changes in food expenditure share than elderly households after ARRA due to the rigid financial constraints each subgroup faced in 2008 and 2009. Some research suggests that the economic crisis did not affect elderly households as severely as younger households. Low-income elderly individuals also rely on other Federal programs, such as Medicare, Medicaid, and Social Security.
The estimates of the MPS on food out of SNAP benefits from the ERS report are higher than those in previous studies. A number of factors may account for the difference. Previous studies used data from 20 to 40 years ago, prior to institutional changes to the program, including the issuance of EBT cards. The data used in the ERS report are from 2008 and 2009, when SNAP benefits were issued through EBT cards and other program parameters may have differed. Moreover, the ERS report takes advantage of the natural experiment provided by ARRA, thereby avoiding the measurement issues previous studies have faced. Finally, volatile economic conditions during 2008 and 2009 likely influenced household spending at all income levels. Consequently, the results of the most recent ERS study may be more relevant to times when households are coping with an economic downturn.
Mental Accounting May Play a Role
The results of this study indicate that SNAP participants who combine their own money with SNAP benefits to buy food spent more on food following the ARRA-provided benefit increase than they would have with an equivalent payment in cash. This implies that these households do not treat SNAP benefits as equivalent to cash income, as some economists have asserted.
The behavioral economics concept of mental accounting may explain the lack of fungibility between SNAP and cash. According to mental accounting theory, households treat different income sources differently, thereby categorizing household expenditure into specific income accounts. This means that a SNAP household likely earmarks SNAP benefits into a specific income account that is intended for food purchases. As a result, when this income account rose due to an increase in SNAP benefits after ARRA, more of the increased resources were used for food than if cash income were increased by the same amount. Because SNAP and income are not totally interchangeable, nutrition programs may have a greater influence over spending decisions of participant households than previous research, and economic theory, have suggested.
This article is drawn from:
- Tuttle, C. (2016). The Stimulus Act of 2009 and Its Effect on Food-At-Home Spending by SNAP Participants. U.S. Department of Agriculture, Economic Research Service. ERR-213.